


Bitcoin trades near $81,560 on October 17, roughly 9% above the September 15 low of $74,910 and 6.7% below the period high of $87,385 set on September 21. Since that peak, each rebound has run out of steam, and price is compressing between $80,000 and $82,700 in what looks more like distribution than a clean trend. BTC has slipped about 2% over seven days.
Leverage is the immediate driver: present, but cheap. Funding sits at 0.0053% per period, or 5.8% annualized, a level that signals neither overheating nor crowding. Open interest stands at $7.68B, down 1.1% over 24 hours and up 0.6% over seven days, while the long/short ratio reads 1.72 across accounts and 1.73 among top traders. ETF flows and on-chain data are not available in the sources reviewed, which leaves the demand picture incomplete.
Macro remains the dominant factor. According to CNBC (October 16), US inflation for September came in at 3.7% year over year, above expectations, while the 10-year Treasury yield exceeds 5.3% and the 30-year 5.7%, the highest levels since 2002 and more than 90 basis points higher since January. This week’s releases reinforced the pressure: core monthly inflation rose 0.3% against 0.2% expected (October 14), core retail sales 0.9% against 0.5%, and core PPI 0.7% against 0.3% (October 15). Bitcoin Magazine notes that this mix raises the risk of another Fed rate hike. Bonds absorbed the shocks, with buyers stepping in according to MarketWatch, while tech stocks were sold and CoreWeave fell 12% on Friday amid credit stress, per CNBC. Interviewed by Reuters, Kevin Warsh gave no hint on the October 27-28 policy meeting.
On the institutional side, the signals diverge. Decrypt reports that MSCI has finalized the exclusion of « non-operating companies » from its indices, effective November 30, a rule that directly targets Strategy and Metaplanet and could trigger passive selling. On the other side, Strive lifted its holdings to 35,595 BTC after buying 3,311 BTC and then 2,822 BTC, and Deutsche Bank is reportedly preparing Bitcoin custody « within weeks » (Bitcoin Magazine, citing Reuters). The Ledger incident, with $86M drained according to Specter, remains background noise with no demonstrated price impact. For the technical reading that follows, the stakes are clear: as long as the $82,300 to $82,700 ceiling holds, the compression can resolve lower.
Multi-Timeframe Technical Analysis
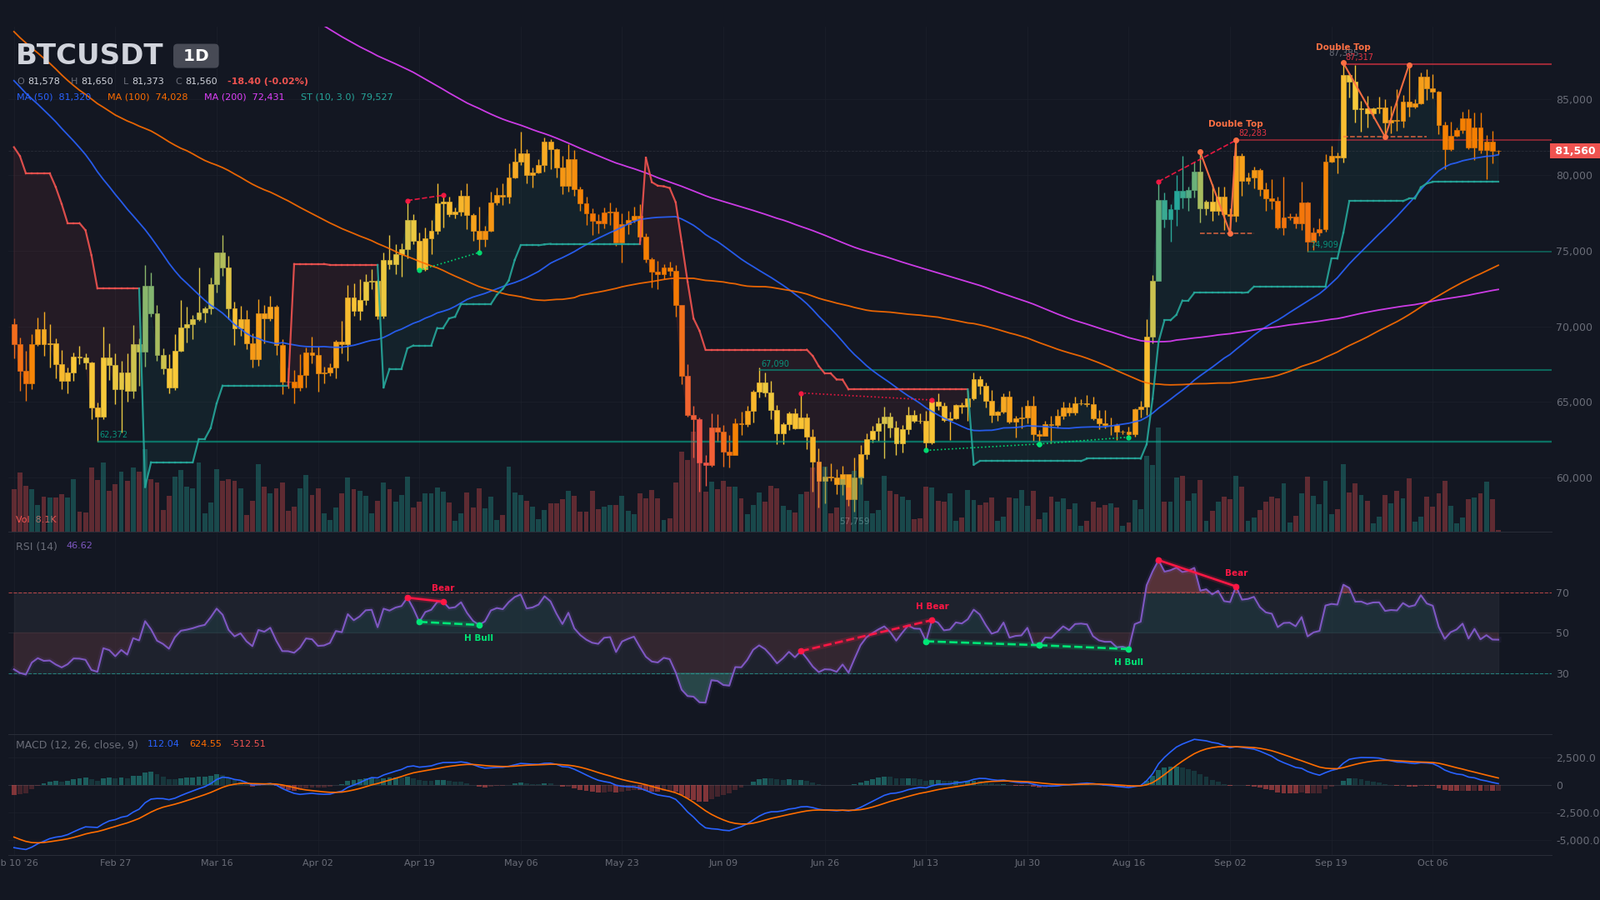
Daily Timeframe (1D): Confirmed Double Top Below the Neckline
The daily trend remains constructive in the long run: price holds above the 200-day SMA at $72,430, and the 50/200 golden cross of September 8, now 39 candles old, has not been invalidated. The current phase, however, is distribution below $87,300. Peaks keep sliding, from $87,385 on September 21 to $87,250 on October 2, $86,980 on October 5 and $84,340 on October 12, while the October 8 low at $80,345 sits below the earlier troughs. Price trades under the 20-day SMA ($83,430) and hugs the 50-day SMA ($81,320), the last line of defense before the $79,500 zone.
The double top flagged at the October 2 pivot is now confirmed, with its neckline at $82,500 and a measured objective of $77,680. While price stays below that neckline, it acts as resistance. A second double top, already confirmed (September 3 pivot, neckline $76,150, objective $70,410), remains in the background. The daily SuperTrend is still bullish at $79,530, which tempers the picture. RSI at about 47 is neutral and not overheated, following a regular bearish divergence between August 21 and September 3 (price rising from $79,560 to $82,280 while RSI fell from about 86 to about 73) that preceded the correction.
MACD remains above zero but below its signal line since the bearish crossover of September 29, with a negative histogram: momentum is fading without a break below zero. Volume on the current candle is only 6% of its 20-period average, far too incomplete to interpret.
Intermediate Dynamics (4H): Compression Wedge Below the Averages
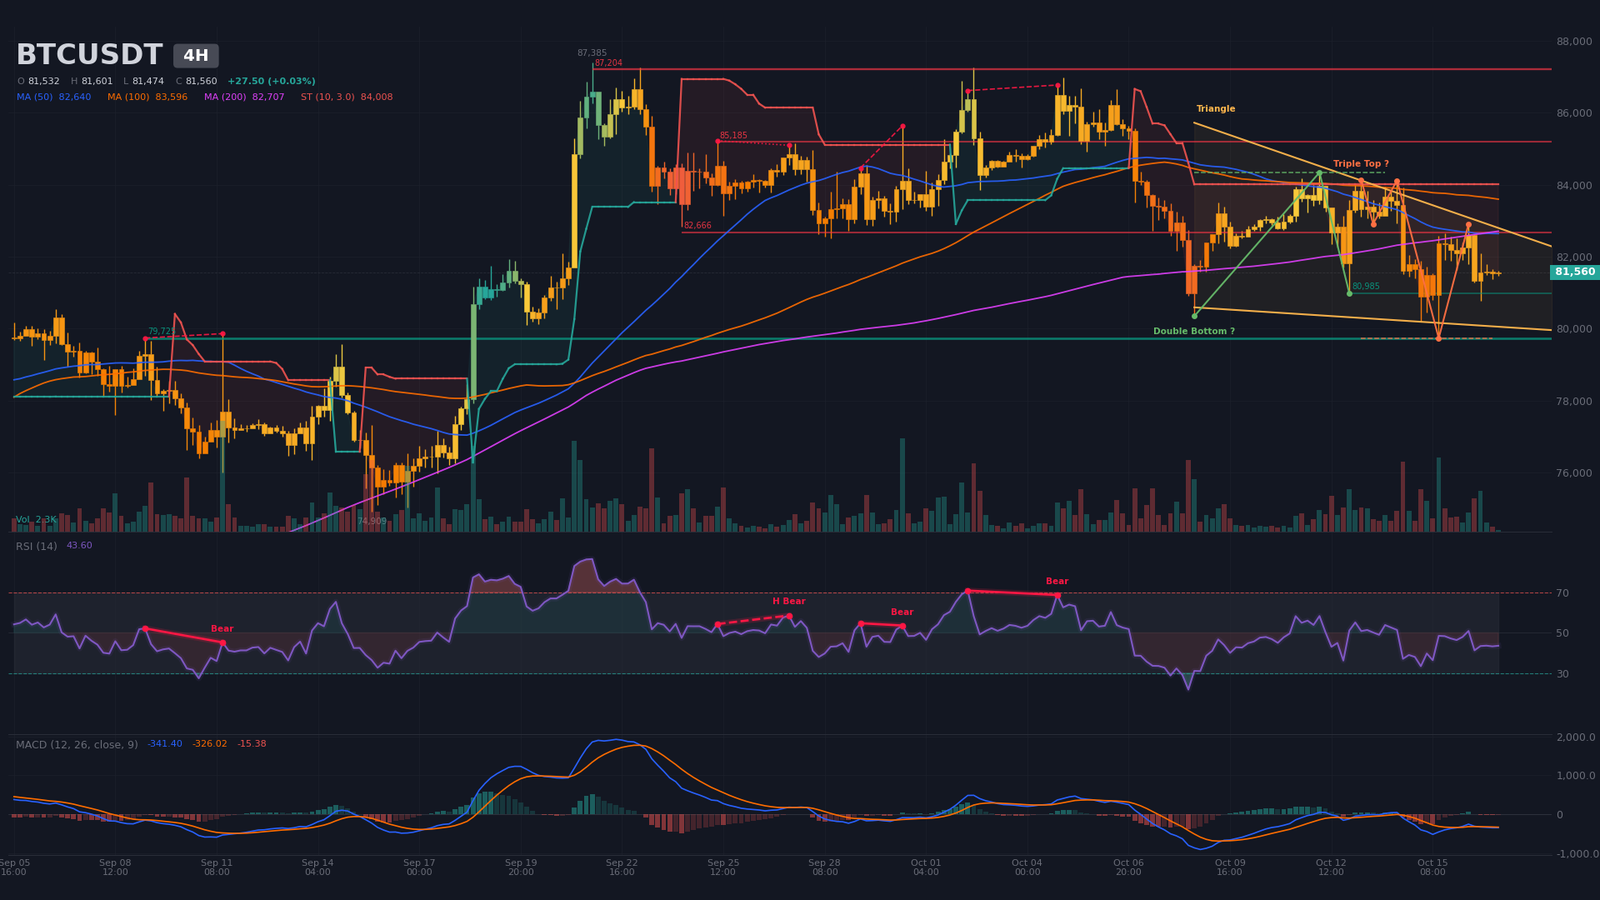
The H4 structure has turned clearly bearish. Price sits below the 20-period ($82,020), 50-period ($82,640) and 200-period ($82,710) SMAs, following a bearish 50/200 crossover dated October 16, and the SuperTrend is bearish at $84,010. Peaks are descending, from $84,340 on October 12 to $82,900 on October 16, while lows oscillate between $79,730 and $81,640. This forms a wedge detected since October 8, bounded by $83,085 on top and $80,105 at the bottom, with an apex estimated around October 26. A resolution before the Fed meeting is therefore probable.
Two opposing patterns coexist. A bearish triple top, with neckline at $79,730 and objective at $75,750, and a bullish double bottom, with neckline at $84,340 and objective at $88,015, are both unconfirmed. RSI at about 44 stays below 50, and MACD slipped under its signal on October 16, below zero, with a slightly negative histogram. Volume on the open candle is 9% of average. The dominant pattern is therefore the wedge, and its break in either direction will set the next leg.
Intraday Structure (15m): Tight Wedge and Hidden Divergences
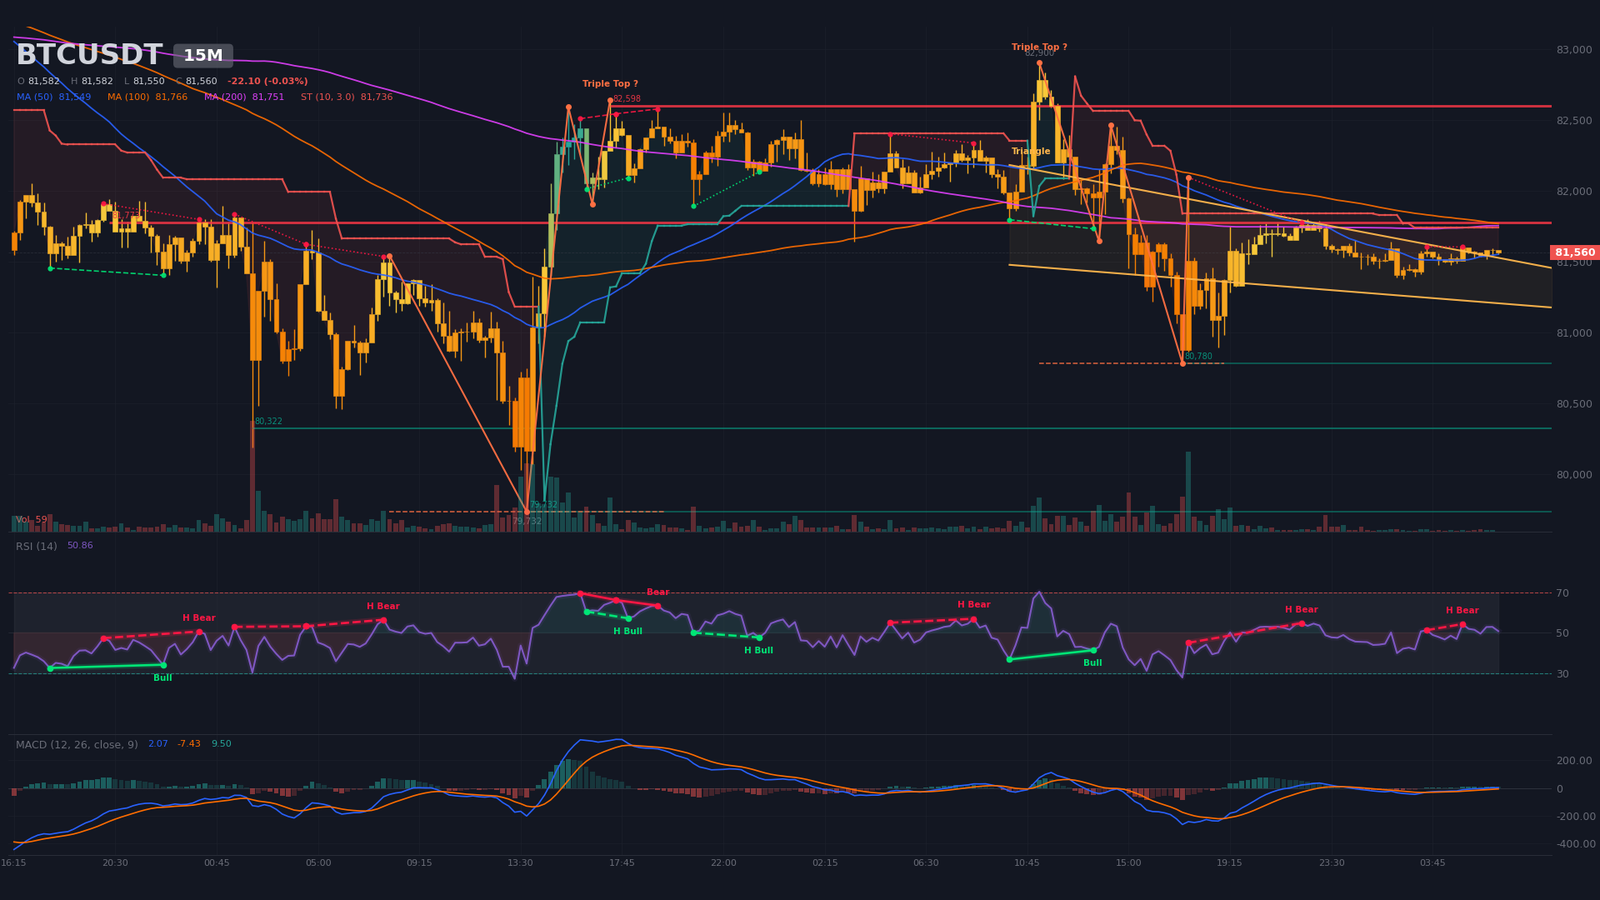
On the 15-minute chart, the micro-structure is a wedge between $81,220 (lower bound) and $81,570 (upper bound), with an apex estimated late on October 17 and an M15 ATR of roughly $80. Price holds above the 20 and 50 SMAs (about $81,530) but below the 200 SMA ($81,750), and the M15 SuperTrend stays bearish at $81,740. Intraday resistances stand at $81,770 (9 touches) and then $82,600 (5 touches), with supports at $80,780, $80,320 and $79,730. RSI at about 51 is neutral, and MACD crossed up on October 17 without notable momentum. Two recent hidden bearish divergences (October 16 and 17) favor a short-term continuation lower.
The M15 triple top, with neckline at $80,780 and objective at $79,080, remains unconfirmed. Volume at 22% of average reflects a quiet weekend market, and a breakout from the wedge is likely during the European session or on Monday, ahead of China’s GDP release on October 19.
Multi-Timeframe Synthesis
| Timeframe | Dominant trend | RSI (14) | MACD | Chart pattern |
|---|---|---|---|---|
| Daily (1D) | Long-term bullish, correction below $87,400 | ~47 | Bearish crossover on September 29, above zero | Confirmed double top ($82,500) |
| 4 hours (4H) | Bearish | ~44 | Bearish crossover on October 16, below zero | Compression wedge (apex around October 26) |
| 15 minutes | Neutral (tight range) | ~51 | Bullish crossover on October 17, weak | Tight wedge $81,220–$81,570 |
Level Map: Technical Levels and Pivots
The map combines daily and H4 swings, classic pivots, chart-pattern objectives, wedge boundaries and concentrations of estimated liquidations. No Fibonacci extension is retained, as the available swings do not isolate a single impulse. The central short-term pivot is the daily pivot, around $81,750, which separates the intraday bearish regime from a possible recovery.
| Level | Price (USD) | Category | Technical basis |
|---|---|---|---|
| Major resistance 3 (R3) | $87,200 – $87,800 | Structural resistance | Daily resistance at $87,317 (2 touches), H4 at $87,204, September 21 high; estimated short pocket $87,630–$87,810 |
| Major resistance 2 (R2) | $84,650 – $85,250 | Resistance / liquidity | H4 double-bottom neckline ($84,340), H4 resistance $85,185, estimated short pockets $84,650–$84,770 and $85,130–$85,250 |
| Immediate resistance (R1) | $82,300 – $82,700 | Resistance | Daily resistance $82,283, daily double-top neckline ($82,500), H4 resistance $82,666 and M15 $82,598 |
| Central pivot (P) | $81,300 – $81,750 | Pivot | Daily pivot $81,753, daily SMA50 $81,320, buy wall $81,470–$81,530, M15 resistance $81,773 |
| Immediate support (S1) | $80,350 – $81,000 | Support | H4 support $80,985, M15 support $80,780, daily S1 $80,605, October 8 low ($80,345) |
| Major support 2 (S2) | $79,270 – $79,730 | Support / liquidity | H4 support $79,725 (4 touches), daily SuperTrend $79,527, estimated long pocket $79,120–$79,360 ($79M) |
| Major support 3 (S3) | $77,680 – $78,050 | Chart objective | Daily double-top objective ($77,683), estimated long pocket $77,870–$78,050 |
Order Book and Liquidity Heatmap
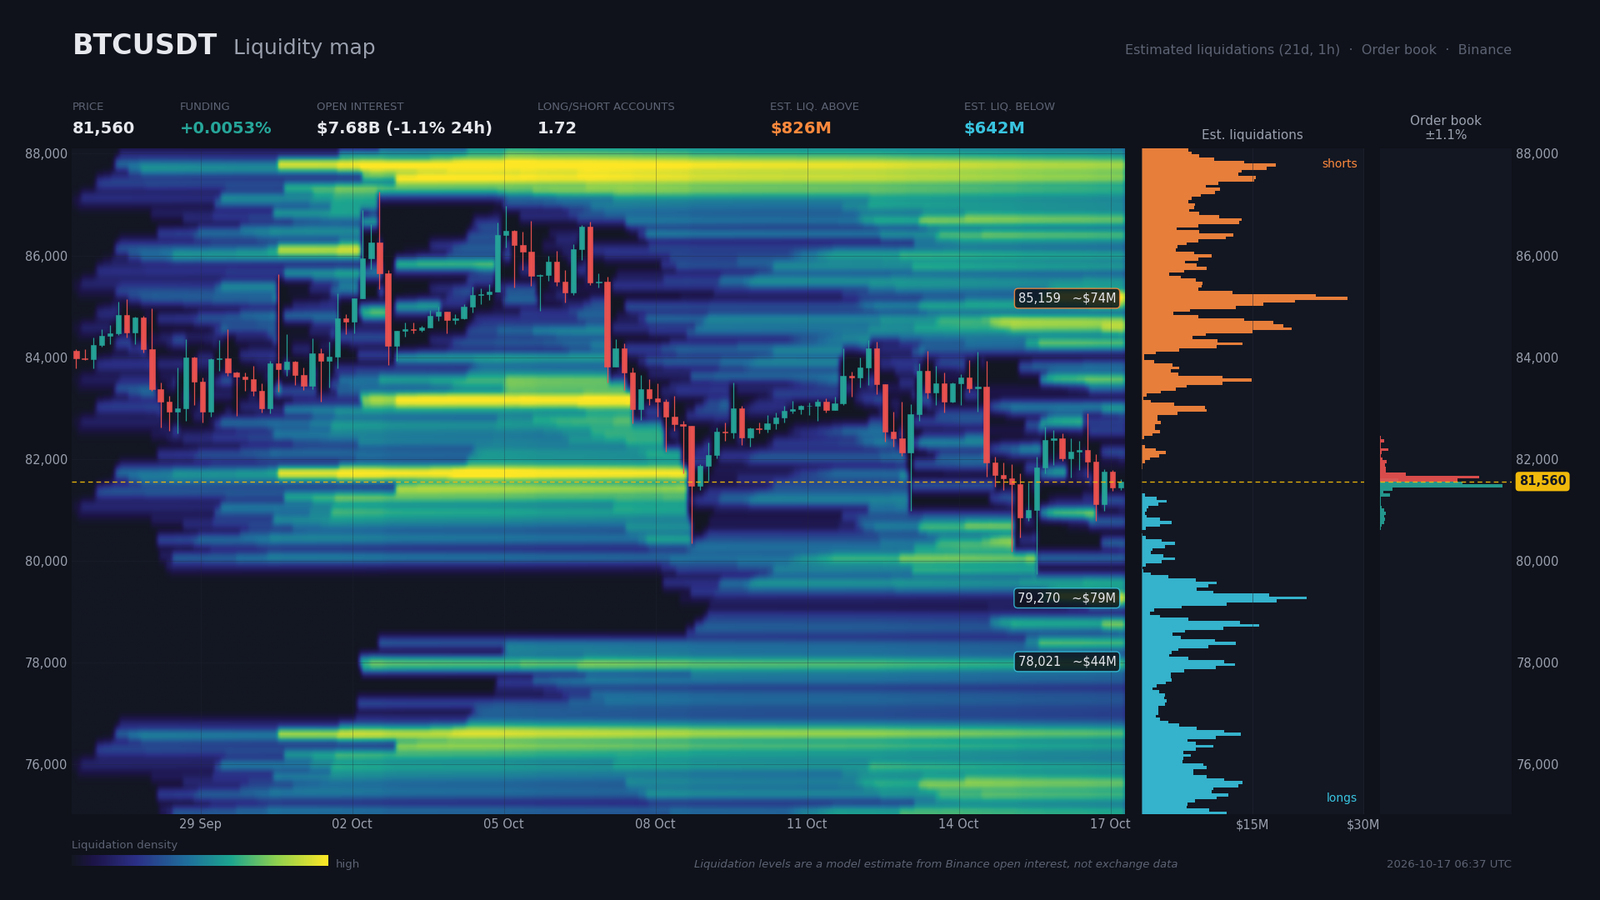
The Binance order book is visible only within 1.06% of price, so the reading is very local. Sell walls sit at $81,590 ($18.7M), $81,650 ($23.8M) and $81,710 ($6.1M); on the buy side, $81,530 ($19.7M), $81,470 ($29.3M) and $81,410 ($2.9M). Within ±2%, bids total $65.9M against $58.0M of asks, a 6.4% imbalance in favor of buyers that is modest and has no reach beyond the visible zone.
The estimated liquidation zones, produced by a model and not measured, show $826M of shorts above the price against $642M of longs below. Above, the pockets sit between $84,650 and $84,770 ($40M), $85,130 and $85,250 ($74M) and $87,630 and $87,810 ($56M). Below, they sit between $79,120 and $79,360 ($79M), $78,700 and $78,820 ($41M) and $77,870 and $78,050 ($44M). The closest and densest pocket is that of longs, near $79,300. Moderate funding and the long/short ratios point to a net long positioning without excess.
The consequence is twofold. A sweep of longs toward $79,300 is a plausible magnet, a classic liquidity sweep that would clear the pocket before any recovery. Conversely, a squeeze toward $84,700–$85,200 would first require a break of $82,700, which would reduce shorts and push the price higher mechanically.
Calendar: Catalysts to Watch
The calendar is dense in the coming days, with China’s GDP leading the way. The events below are those most likely to pull price out of its compression. Figures in parentheses show consensus, then prior.
- Monday, October 19, 04:00 (Zurich) — China GDP q/q (consensus 1.1%, prior 0.9%), industrial output (5.4%; 5.2%) and retail sales (0.5%; 0.4%): the first test of Chinese demand, capable of reshaping risk appetite.
- Tuesday, October 20, 14:30 (Zurich) — US housing starts (1.3%; −2.6%) and building permits (1.4; 1.403): a rate-sensitive housing gauge.
- Wednesday, October 21, 08:00 (Zurich) — UK inflation (3.4%; 3.1%): a direct read on the path of rates.
- Friday, October 23, 01:30 (Zurich) — Japan inflation (2.1%; 1.9%), to watch for global tightening expectations.
- Tuesday and Wednesday, October 27-28 (Zurich) — Fed policy meeting (time not specified by the source): the major catalyst, whose outcome will shape the path of long-term yields.
Three Scenarios for the Coming Weeks
The analysis retains three paths, whose probabilities total 100%. The first, the most likely, extends the rejection below the ceiling; the second bets on a sweep of longs before a recovery; the third assumes a bullish invalidation of the wedge.
Scenario A — Rejection Below $82,700 and Slide Toward $79,700 (probability 45%)
The trigger is a rejection between $81,750 and $82,300, followed by an H4 close below $80,980. The path first targets $79,730, then the long pocket at $79,270, and finally the daily double-top objective at $77,680. The dated catalysts are China’s GDP on October 19, then the FOMC on October 27-28. The R:R toward $79,730 is about 2.1. Execution zone: sell the rebound between $81,700 and $81,800, below the $81,710 sell wall and the M15 resistance at $81,773. Invalidation: an H4 close above $82,700, with a stop roughly $950 from entry, more than the H4 ATR (about $876).
Scenario B — Long Sweep Then Recovery (probability 30%)
The trigger is a wick below $80,780 toward $79,270–$79,730, without a daily close below the $79,530 SuperTrend level. The expected path returns above $81,500, then tests $82,300–$82,700, within the window for resolving the H4 wedge before October 26. Execution zone: reactive buy between $79,300 and $79,750. Invalidation: an H4 close below $78,800, at least one H4 ATR below the entry zone.
Scenario C — Bullish Invalidation (probability 25%)
The trigger is an H4 close above $82,700, then above $83,085, the upper bound of the wedge. Objectives come in sequence at $84,340 (double-bottom neckline, unconfirmed hypothesis), $85,160 (estimated short pocket) and $87,300; the $88,015 double-bottom objective is valid only if the pattern is confirmed. A Chinese surprise or a easing of rates could serve as a trigger. Execution zone: buy on a retest of $82,300–$82,700 turned support. Invalidation: a return below $81,700 on an H4 close, a stop at least $900 below entry.
Synthesis and Conclusion
The current phase is a distribution consolidation below $87,300, marked by volatility compression and very thin volume over the weekend. Strive’s treasury buying and Deutsche Bank’s planned custody support underlying demand, but the MSCI risk of November 30 and the high-rate regime cap upside potential. ETF flows and on-chain data are unavailable, so they can neither confirm nor refute the thesis. The bias is bearish in the short term, with low conviction and a confluence score of 3 out of 5.
The dominant technical strategy is to sell rebounds toward $81,700–$82,300 as long as the $82,500 neckline is not reclaimed on an H4 close. The protection level sits at $82,700, with reduced position size ahead of the wedge apex and the Fed meeting. Critical levels remain $82,300–$82,700 for the ceiling, $81,300–$81,750 for the pivot and daily SMA50, $80,350–$81,000 for the intraday range, $79,270–$79,730 for H4 support and the long pocket, and $77,680 for the daily double-top objective.
Sources
- Hot Inflation Data Puts Bitcoin Under Pressure, but « Difficult » Isn’t « Bearish » — Bitcoin Magazine, October 16, 2026
- Yields continue to rattle investors. These sectors are most at risk if rates stay elevated — CNBC, October 16, 2026
- The bond market shrugged off two inflation shocks. Why stock investors should pay attention. — MarketWatch, October 16, 2026
- Nowhere to hide: Tech selloff hits software and chip stocks alike — MarketWatch, October 16, 2026
- Why did CoreWeave stock get crushed this week? — CNBC, October 16, 2026
- Fed’s Warsh gives no hint on October policy decision — Reuters, October 16, 2026
- Bitcoin Treasury Giant Strategy Faces Index Removal Under Finalized MSCI Rules — Decrypt, October 16, 2026
- Strive’s bitcoin buying spree earns 27% price target hike from TD Cowen — The Block, October 16, 2026
- Deutsche Bank To Debut Bitcoin Custody Within Weeks: Report — Bitcoin Magazine, October 16, 2026
- Poetic Justice: Scammer Lost $5M in Bitcoin After Being Targeted by Ledger Thieves — Bitcoin Magazine, October 16, 2026
- Will the Crypto Market Repeat 10-10? Here’s What the Data Says — Yahoo! Finance, October 7, 2026
Disclaimer: This article is for educational and informational purposes only. It does not constitute investment advice, a recommendation to buy or sell, or an invitation to trade any financial asset. Cryptocurrency markets are extremely volatile; any investment decision should be based on your own research (DYOR) and, where appropriate, the advice of a licensed financial adviser.

