


Bitcoin is trading in a stress zone, and Solana is paying the price. Solana sits at $105.33 on October 16, 2026, after tapping $100.50 the day before. The pullback from the September 27 high of $124.99 now stands at -15.7%, inside a post-impulse distribution phase that has dragged on for three weeks. Price trades below the 50-day moving average ($109.37) but holds above the 200-day SMA ($87.37), which prevents calling it an institutional downtrend just yet. The overall bias stays bearish on the daily frame, neutral on lower timeframes, with medium conviction and a 2-out-of-5 confluence score.
The market remains lever- and macro-driven. Crypto liquidations peaked at $948M over 24 hours on October 15, of which 90.6% on the long side according to Decrypt, a brutal flush of long positions that confirms the ongoing purge. The same outlet reports “outsized drawdowns” for altcoins: Ethereum -5.5%, XRP -5.1%, Solana -3.8%, against -3.1% for Bitcoin. Open interest stands at $961.7M, up +0.55% over 24 hours and +2.22% over seven days, leverage rebuilding moderately after the purge. Funding rate prints 0.0002%, annualized 0.2%, neutral, without a directional imbalance.
The macro shock originates in US inflation. On Wednesday October 14, core m/m CPI printed 0.3% versus 0.2% consensus, and on Thursday October 15 core m/m PPI surprised at +0.7% versus 0.3% consensus (Decrypt, October 15). Core m/m retail sales at +0.9% versus 0.5% completed the picture. Fed Chair Kevin Warsh spoke on Friday October 16 in Bangkok, reaffirming the commitment to price stability without prejudging the October 27-28 decision (Reuters, Oct. 16; MarketWatch, Oct. 16). The ECB (Lagarde, Oct. 14) and the BoE (Bailey, Oct. 16) also intervened, without a clear directional signal.
The Solana ecosystem has not lacked positive catalysts this week, though they have not offset the macro pressure. Ledger unveiled the Atom, a secure Android touchscreen device, in partnership with Solana Mobile (Decrypt, Oct. 15). The ‘Dacity Coin’ memecoin, a Solana copycat launched on Pump.fun, surged 2,900% after the brand’s fleeting appearance in the GTA 6 trailer (Decrypt, Oct. 16). DeFi Development raised the dividend on its CHAD preferred share to 14% to accelerate its SOL purchases (The Block, Oct. 15). The Solana Foundation postponed the Accelerate Shanghai event after registrations quadrupled the venue cap (Cointelegraph, Oct. 16). The technical read that follows sits in this tug-of-war between a vibrant ecosystem narrative and persistent macro pressure.
Multi-Timeframe Technical Analysis
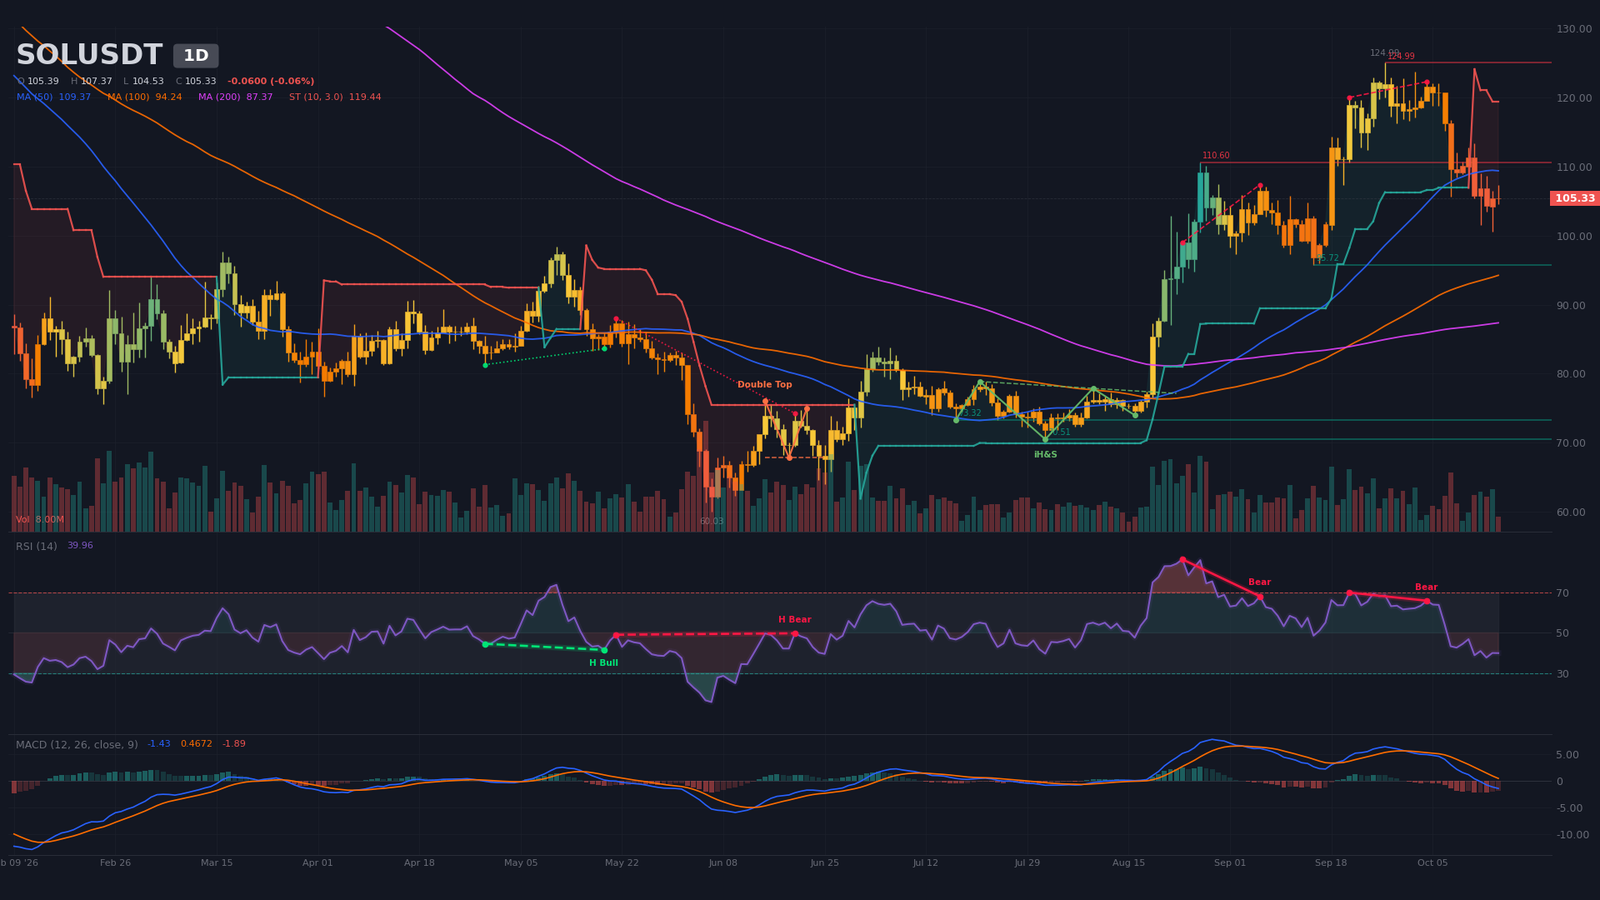
Daily Timeframe (1D): Post-Impulse Distribution Confirmed
Solana topped at $124.99 on September 27, 2026 before launching a distribution that continues to drag on. Over the last twenty sessions, price has retraced -13.2%, successively breaking the 20-SMA ($114.05) and the 50-SMA ($109.37), to settle in the $105-110 zone. The 50/200 SMA pair remains bullish since September 2, 44 candles ago, which rules out an institutional downtrend call, but price trades below both references.
MACD completed a bearish cross on October 1 (fifteen candles), its line stays below the signal and below zero, negative momentum well established. RSI at 40 prints a neutral-weak bias. The September 21 high ($119.99, RSI 70) and the October 4 high ($122.27, RSI 66) carve out a confirmed regular bearish divergence, the second such signal. The daily SuperTrend is bearish at $119.44 and price stays trapped below that level since October 8. Today’s volume prints 48% of the twenty average. Detected patterns have already played out their targets; no extension pattern is forming on this TF.
Intermediate Dynamics (4H): Nascent Technical Rebound
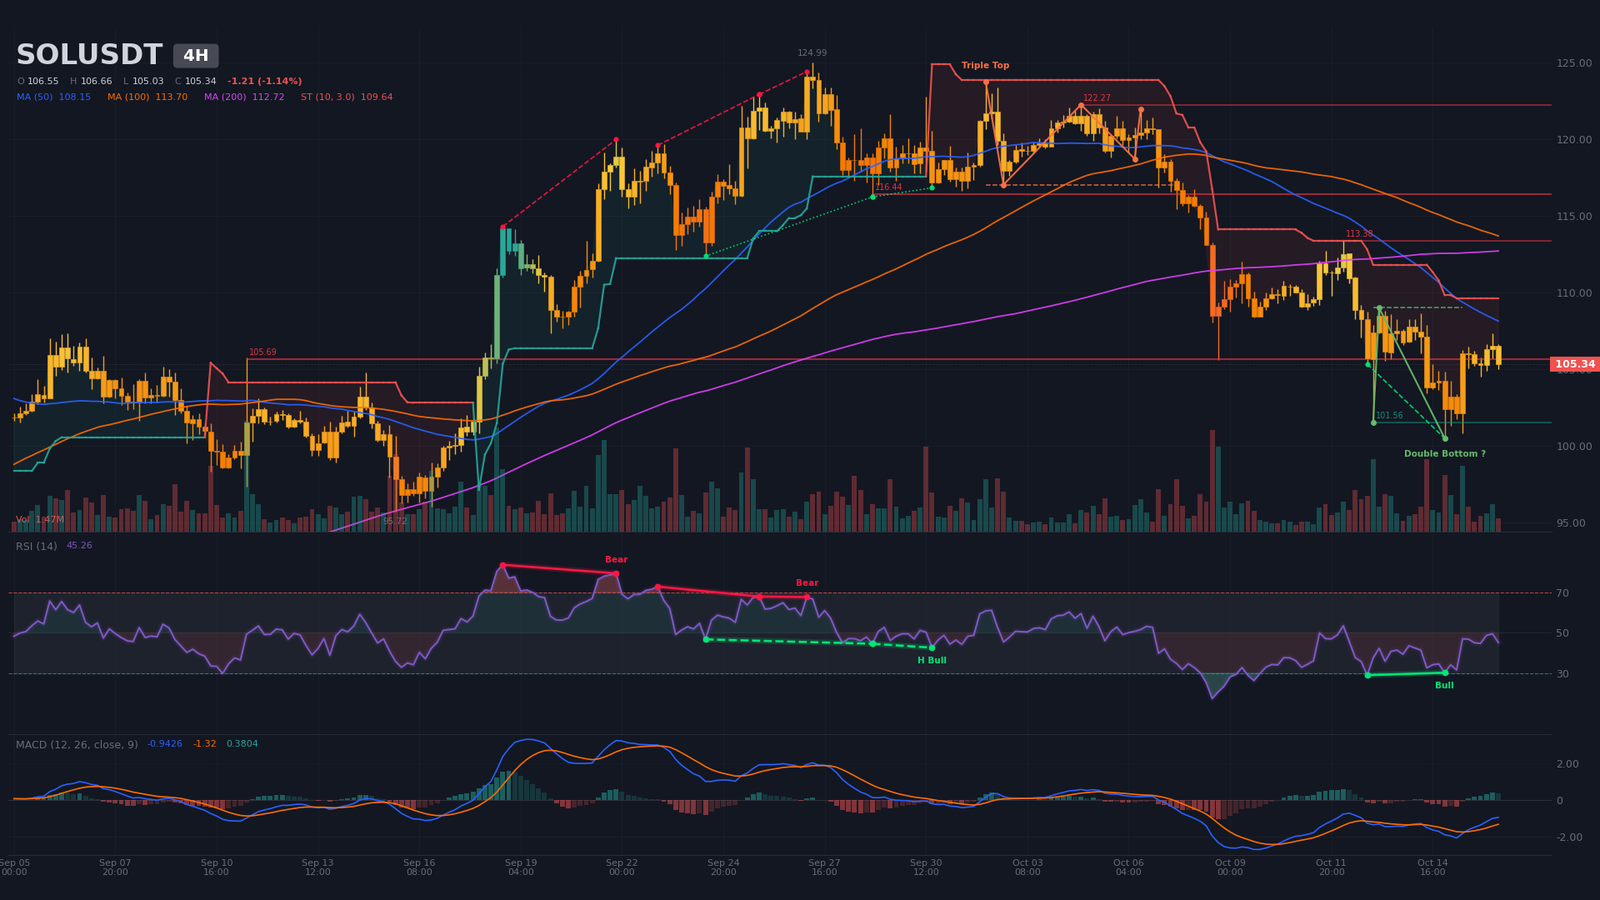
The 4h shows the first signs of seller exhaustion. The MACD line crossed back above the signal on October 15 (five candles), the histogram flipped positive while staying below zero. A regular bullish RSI divergence formed between the October 12 low ($105.35, RSI 29) and the October 15 low ($100.51, RSI 30), a signal of downside exhaustion. Price stays nevertheless below the 20-SMA ($105.55), 50-SMA ($108.15) and 200-SMA ($112.72); the 50/200 cross turned bearish on October 14 (fifteen candles), a negative signal for the medium term. The 4h SuperTrend is bearish at $109.64.
On this TF, the detector flags an unconfirmed bullish double bottom, neckline 109.01, target 116.98, which, if validated, opens a call toward the 116-117 zone. Conversely, a confirmed bearish triple top still weighs (neckline 117.05, target 111.43, nearly hit). Volume at 48% of the average conveys no conviction. The 4h read therefore calls for caution: the seller exhaustion signals are real, but the medium term remains negatively oriented.
Intraday Structure (15m): Bearish Compression
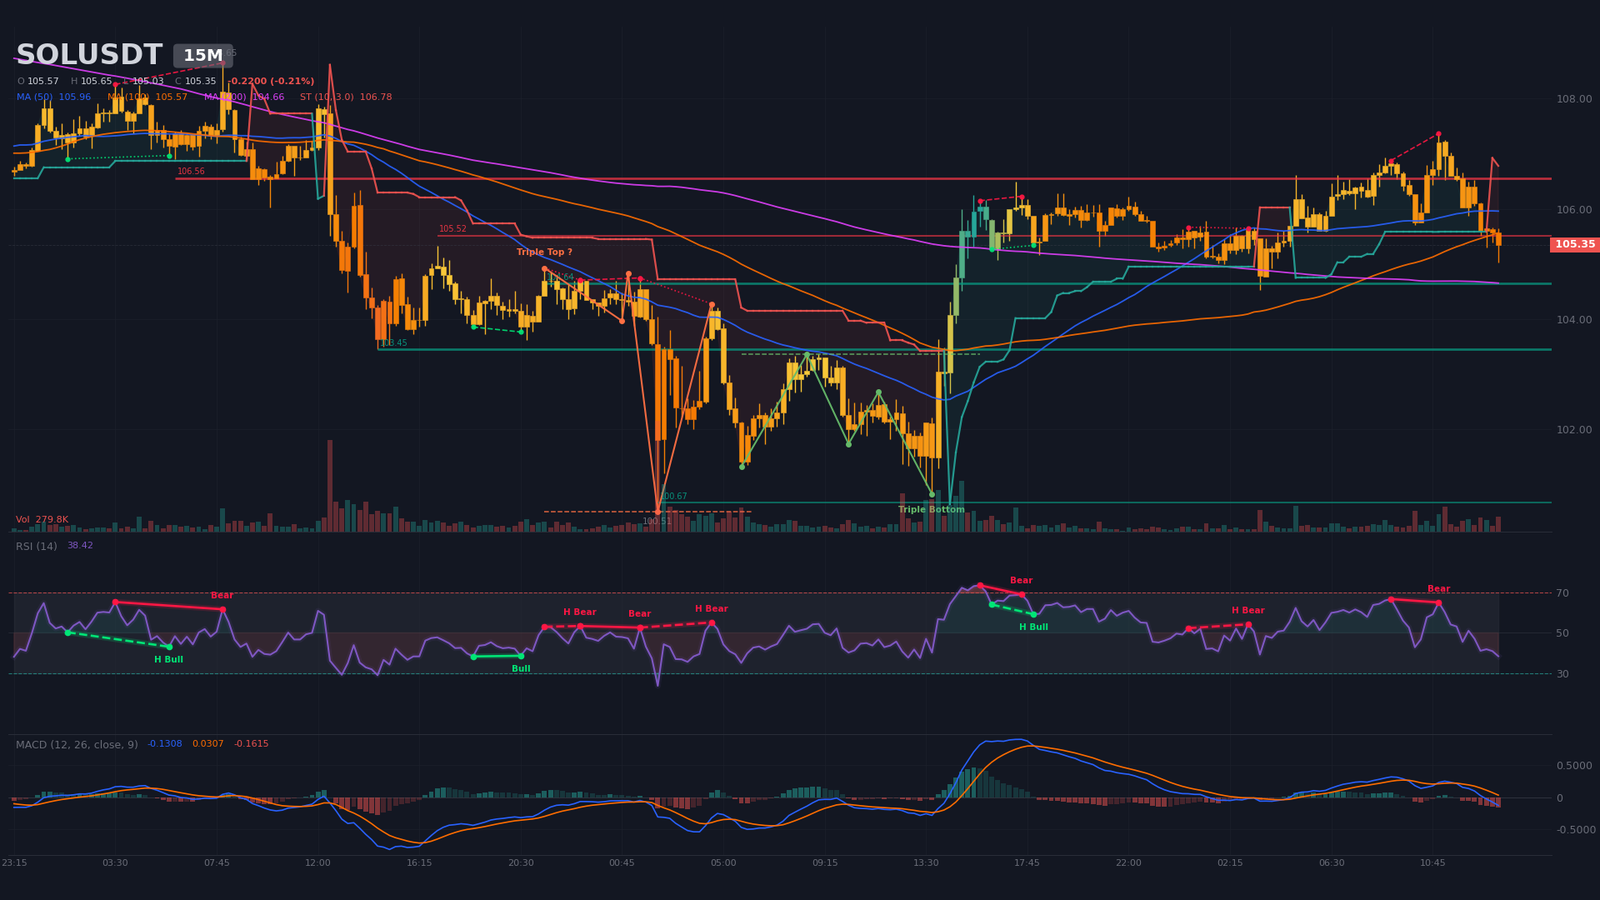
On the 15-minute, the October 16 session retraces the intraday high of $107.37 before falling back to $105.35. MACD crossed below its signal line during the morning (seven candles), histogram negative. RSI at 38 prints a non-excessive seller momentum. A regular bearish RSI divergence formed between 106.88 (RSI 66.7) and 107.37 (RSI 65.1), confirmed buyer exhaustion on the intraday bounce. The 15m SuperTrend is bearish at $106.78.
Volume reaches 146% of the twenty average on the last candle, the volume increase accompanies the drop, a negative signal. The intraday range upper bound sits at $107.37, the lower bound is $105.03-105.30. The confirmed bullish triple bottom (neckline 103.36, target 105.42 hit) structures the floor. The current compression between $105.30 and $107.37 marks indecision; direction will depend on the daily bearish bias.
Multi-Timeframe Synthesis
The convergence across timeframes stays fragile: the daily structure dictates caution, the 4h starts flagging a turn, and the 15m shows compression awaiting the break.
| Timeframe | Dominant Trend | RSI (14) | MACD | Chart Pattern |
|---|---|---|---|---|
| Daily (1D) | Bearish (distribution) | ~40 | Bearish cross 10/01, below zero | Inverse H&S confirmed (closed) |
| 4 hours (4H) | Neutral (support test) | ~45 | Bullish cross 10/15, below zero | Bullish double bottom (unconfirmed) |
| 15 minutes | Neutral-bearish | ~38 | Bearish cross 10/16, below zero | Bullish triple bottom (closed) |
Mapping of Technical Levels and Pivots
The methodology blends daily and 4h classic pivots, September-October major swings, daily 20/50/200 SMAs, SuperTrend and estimated liquidation zones. The short-term central pivot sits in the $105.30-106.50 zone, which gathers the 4h 20-SMA ($105.55) and the daily R1 pivot ($107.74). The levels below serve as a reading grid until the October 27-28 Fed decision.
| Level | Price (USD) | Category | Technical Basis |
|---|---|---|---|
| R3 | 124.00 – 125.70 | Major resistance | Swing high $124.99 (09/27) + estimated short liquidation peak at $125.57 ($19M) |
| R2 | 116.00 – 117.00 | Major resistance | 4H triple top neckline ($117.05) + swing high $116.25 (09/29) |
| R1 | 109.00 – 110.60 | Immediate resistance | Daily 50-SMA $109.37 + chartimg resistance $110.60 + 4H SuperTrend $109.64 |
| P | 105.30 – 106.50 | Central pivot | Current price $105.33 + 4H 20-SMA $105.55 + Daily R1 pivot $107.74 |
| S1 | 100.50 – 101.76 | Immediate support | Intraday low $100.51 (10/15) + Daily S1 pivot $101.76 + 4H chartimg support $101.56 |
| S2 | 95.70 – 96.13 | Major support | Daily swing low $95.72 (09/15) + estimated long liquidation pocket $95.82 ($9M) |
| S3 | 87.00 – 87.40 | Major support | Daily 200-SMA $87.37 + chartimg support $73.32 / $70.51 (deep, 1 contact) |
Order Book and Liquidity Heatmap
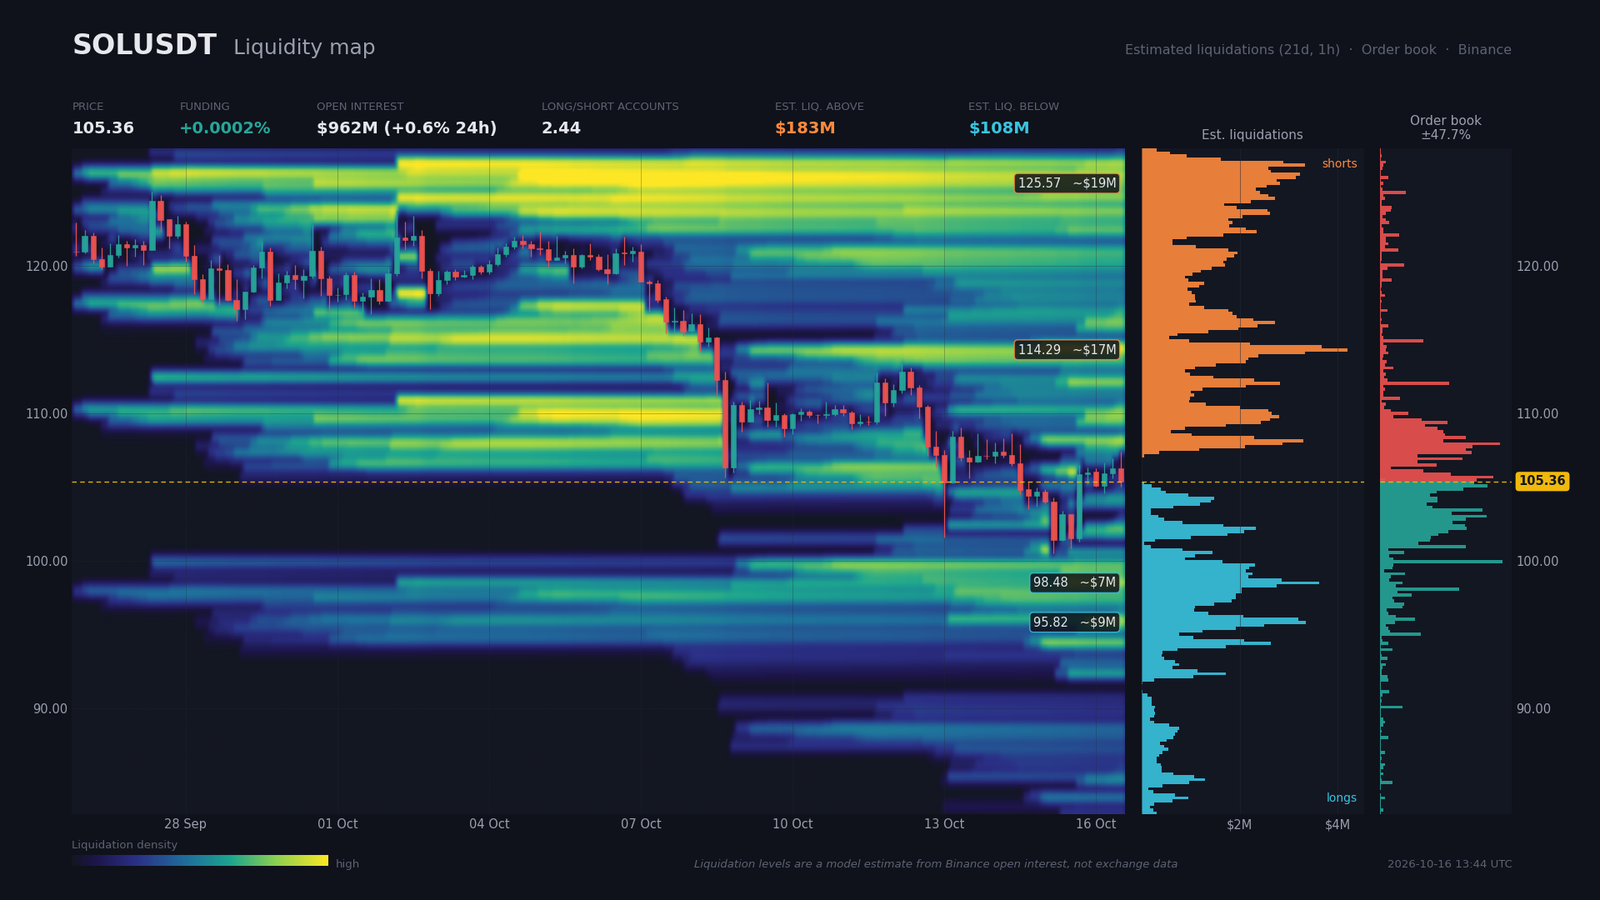
The Binance order book shows a buy/sell imbalance of +5.1% on the bid side ($46.8M vs $42.2M asks), a slight premium to the buy side. Buy walls cluster at $105.05 ($6.95M), $103.41 ($6.63M), $103.00 ($6.88M) and $99.92 ($7.90M). Sell walls line up at $105.46 ($6.24M), $105.67 ($7.34M), $107.72 ($5.99M) and $107.93 ($7.74M). This setup confirms a tight fight between buyers and sellers in the $105-107 zone.
On the derivatives side, funding rate prints 0.0002% (annualized 0.2%), neutral funding without directional imbalance. Open interest stands at $961.7M, up +0.55% over 24 hours and +2.22% over seven days, leverage rebuilding moderately after the purge. The global long/short ratio prints 2.44 (longs dominant), with a taker buy/sell at 0.98, slightly seller over 24 hours. CryptoTicker (Oct. 14) already noted a -12.1% drop in OKX OI between October 7 and 14. The current structure stays asymmetric: too many longs, not enough bullish catalyst.
The estimated model liquidation pockets draw a downside magnet under price. Above, three short clusters total $183M, including a main one at $124.24-125.68 ($19M at the $125.57 peak) and an intermediate one at $113.77-114.80 ($17M). Below, three long clusters total $108M, the densest at $95.71-96.13 ($9M at the $95.82 peak). The unbalanced ratio ($183M vs $108M) favors a bullish squeeze toward $125, but the long flush at $95-96 stays a risk if macro pressure persists.
Calendar: Catalysts to Watch
Ten days of macro catalysts loom, dominated by the October 27-28 Fed decision. In the meantime, several high-impact releases will set the pace of the next session and could push Solana out of the $100-110 zone.
- Monday October 19, 04:00 (Zurich) — China GDP, industrial production and retail sales YoY (consensus 4.4 / 5.4 / 0.5; previous 4.7 / 5.0 / 0.5). Stakes: read on the Chinese engine after the record October 14 exports (+36.3% YoY vs +25.5% consensus).
- Tuesday October 20, 14:30 (Zurich) — US building permits and housing starts (consensus 1.4M and 1.3M; previous 1.4M and 1.31M). Leading housing indicator, US cyclical signal.
- Wednesday October 21, 08:00 (Zurich) — UK core CPI YoY (consensus 2.7% vs 2.6% previous). Signal for the BoE after Bailey’s October 16 intervention.
- Thursday October 22, 14:30 (Zurich) — US jobless claims (consensus 200k; previous 215k). Labor market, barometer of a Fed that is biding its time.
- Friday October 23, 01:30 (Zurich) — Japan CPI YoY (consensus 2.1% vs 1.9% previous). Test for the BoJ and potential dollar impact.
- Tuesday 27 – Wednesday 28 October (Zurich) — Fed rate decision (consensus no change at 4.25-4.50%). Key catalyst of the quarter, window highlight.
Three Scenarios for the Coming Weeks
Three paths emerge ahead of the October 27-28 Fed decision, with a moderate neutral-bullish lean short-term and a non-negligible bearish vulnerability if data confirm their hawkish tone. Probabilities are calibrated on the current risk/reward and the liquidation mapping.
Scenario A — Pivot Bounce (probability 50%)
Catalyst: macro stabilization after the double CPI/PPI surprise, return of positive Solana ETF flows. Trigger: 4h close above $107.74 (daily R1) then break of $108.15 (4h 50-SMA). Path: return toward $110.6 then $112.7 (4h 200-SMA) before the 4h double bottom target at $116.98 in extension. Execution zone: $105.30-106.50. Invalidation: daily close below $100.51. Stop: $99.30 (1.2 × ATR14 daily = $6.08). R:R ≈ 2.3.
Scenario B — 100-110 Range (probability 30%)
Flows stay balanced, funding stays near zero, price oscillates between the $100.5 support and the $110.6 resistance ahead of the October 27-28 Fed decision. Trigger: no break of $100 nor $110 over five consecutive dailies. Execution zone: accumulation toward $100.5-101.7. Invalidation: break of either side. Stop: outside the range ±1 × ATR14 4h. Yield is then built via short swings rather than directional position.
Scenario C — Bearish Breakdown (probability 20%)
Catalyst: hawkish Fed surprise or Chinese disappointment on October 19. Trigger: 4h close below $100.51, sweeping the longs at $95-96. Path: $95.7 then $91.5 (-2 × ATR14 daily extension) before the daily 200-SMA at $87.4. Execution zone: return to $100-101. Invalidation: daily close above $110.6. Stop: $112 (1.4 × ATR14 daily). R:R ≈ 3.5.
Synthesis and Conclusion
Solana stays in a post-impulse distribution phase: the September rally, from ~$60 to $125, ended with two confirmed RSI bearish divergences on the daily, and price lost the 20 and 50 SMA supports. The flow of positive news (Ledger x Solana Mobile, GTA 6, DeFi Development) does not offset the macro pressure (hot CPI/PPI, elevated long/short ratio) and the $948M liquidations on October 15. The compressed open interest and the neutral funding sketch a leverage rebuild, but direction stays to be determined by the ten-day catalysts.
The dominant technical strategy stays neutral with a tactical bullish bias above $107.74 (daily R1), stop below $100.51 (October 15 low); bearish bias below $100. Critical levels to monitor: $100.51 (S1 daily), $107.74 (R1), $110.60 (chartimg resistance + daily 50-SMA), $116-117 (triple top neckline) and $124.99 (swing high 09/27). Risk/reward currently tilts in favor of Scenario A over two weeks, but the bearish sweep risk toward $95.82 stays the main threat if the Fed surprises hawkish on October 27.
Sources
- Fed’s Warsh gives no hint on October policy decision — Reuters, October 16, 2026
- Capital B posts wider H1 net loss of $78 million on bitcoin impairment charge — The Block, October 16, 2026
- Morgan Stanley’s Amy Oldenburg: The Digital Gold Investment Case for Bitcoin — Bitcoin Magazine, October 16, 2026
- Solana’s Liu says Shanghai event postponed over registration surge — Cointelegraph, October 16, 2026
- GTA 6 Trailer Features Meme Coin—And Solana Copycat Soars 2,900% — Decrypt, October 16, 2026
- Ledger Announces Atom Touchscreen Android Device — Decrypt, October 15, 2026
- DeFi Development boosts CHAD dividend to 14% amid push to grow Solana holdings — The Block, October 15, 2026
- Ethereum, Altcoins See ‘Outsized Drawdowns’ Due to Macro Pressures — Decrypt, October 15, 2026
- Bitcoin Whipsaws as Crypto Liquidations Near $1 Billion — Decrypt, October 15, 2026
- Solana price $103.82: will the $100 level hold? — CryptoTicker.io, October 14, 2026
- Insane Trading Wins and Losses, Major ZEC Turbulence, and More: Bits Recap October 16 — CryptoPotato, October 16, 2026
- Morning Minute: Google Clears a Major Quantum Hurdle, Bitcoin Still Safe — Decrypt, October 16, 2026
Disclaimer: This article is for educational and informational purposes only. It does not constitute investment advice, a recommendation to buy or sell, or an invitation to trade any financial asset. Cryptocurrency markets are extremely volatile; any investment decision should be based on your own research (DYOR) and, where appropriate, the advice of a licensed financial adviser.

