


Bitcoin is trading around $82,126 on the daily candle as of October 16, after an intraday low at $79,732 printed on October 15 in the wake of a hotter-than-expected US inflation print. The period high stands at $87,385 from September 21, the period low at $57,758 over the rolling window; cumulative change on the last twenty daily candles reaches -2.7%. The tape is compressing inside a post-correction range, neither outright bearish nor bullish, waiting for the Federal Reserve rate decision on October 27-28 as the macro catalyst. Short-term moving averages are tightening around price, a signature of fading energy before the next directional leg.
The dominant catalyst of the week remains the double inflation surprise of October 14-15. Headline CPI YoY printed 3.7% versus 3.6% consensus (prior 3.4%), and core PPI m/m printed 1.3% versus 0.5% expected — its largest gain in four years per Bitcoin Magazine (October 15). The shock drove BTCUSDT below $80,000 for the first time in a month and triggered $948M of crypto liquidations within 24 hours, 90.6% of them on the long side (Decrypt, October 15). Price has since retraced the entire move in the October 16 session.
On the macro and flows side, Fed Chair Kevin Warsh stated in Bangkok on October 16 that he was not prejudging the October 27-28 decision, describing “synchronous monetary tightening” without “free riders” (CNBC, October 16). CME FedWatch was pricing 72.3% odds of a hold in October and a market majority expecting a +25 bp hike in December. US spot Bitcoin ETFs booked $996M of net inflows last week, including $906M into IBIT (BlackRock), pushing year-to-date flows back into positive territory after several weeks of outflows (Bitcoin Magazine). Cumulative assets under management remain near $58B. Chainalysis, cited by Bitcoin Magazine on October 15, reported the United States became a net importer of Bitcoin in 2026 for the first time since 2022 — a structural absorption signal. On October 16, MSCI finalized “non-operating companies” rules that could exclude Strategy (MSTR), Metaplanet and SharpLink from its indices (The Block), a reputational risk for the treasury Bitcoin cohort. Russia’s central bank confirmed on October 12 a P2P Bitcoin ban from July 1, 2027 (Decrypt), and Australia released a draft bill transposing the OECD crypto tax framework (Cointelegraph).
The combination of a confirmed daily double top, a compressing H4 triangle and a still-bullish daily SuperTrend at $79,527 frames an ambiguous setup. The confluence score stands at 3/5, signaling medium-conviction bias. The analysis below attempts to identify the dominant trigger and the most probable trajectory over the next ten trading days.
Multi-Timeframe Technical Analysis
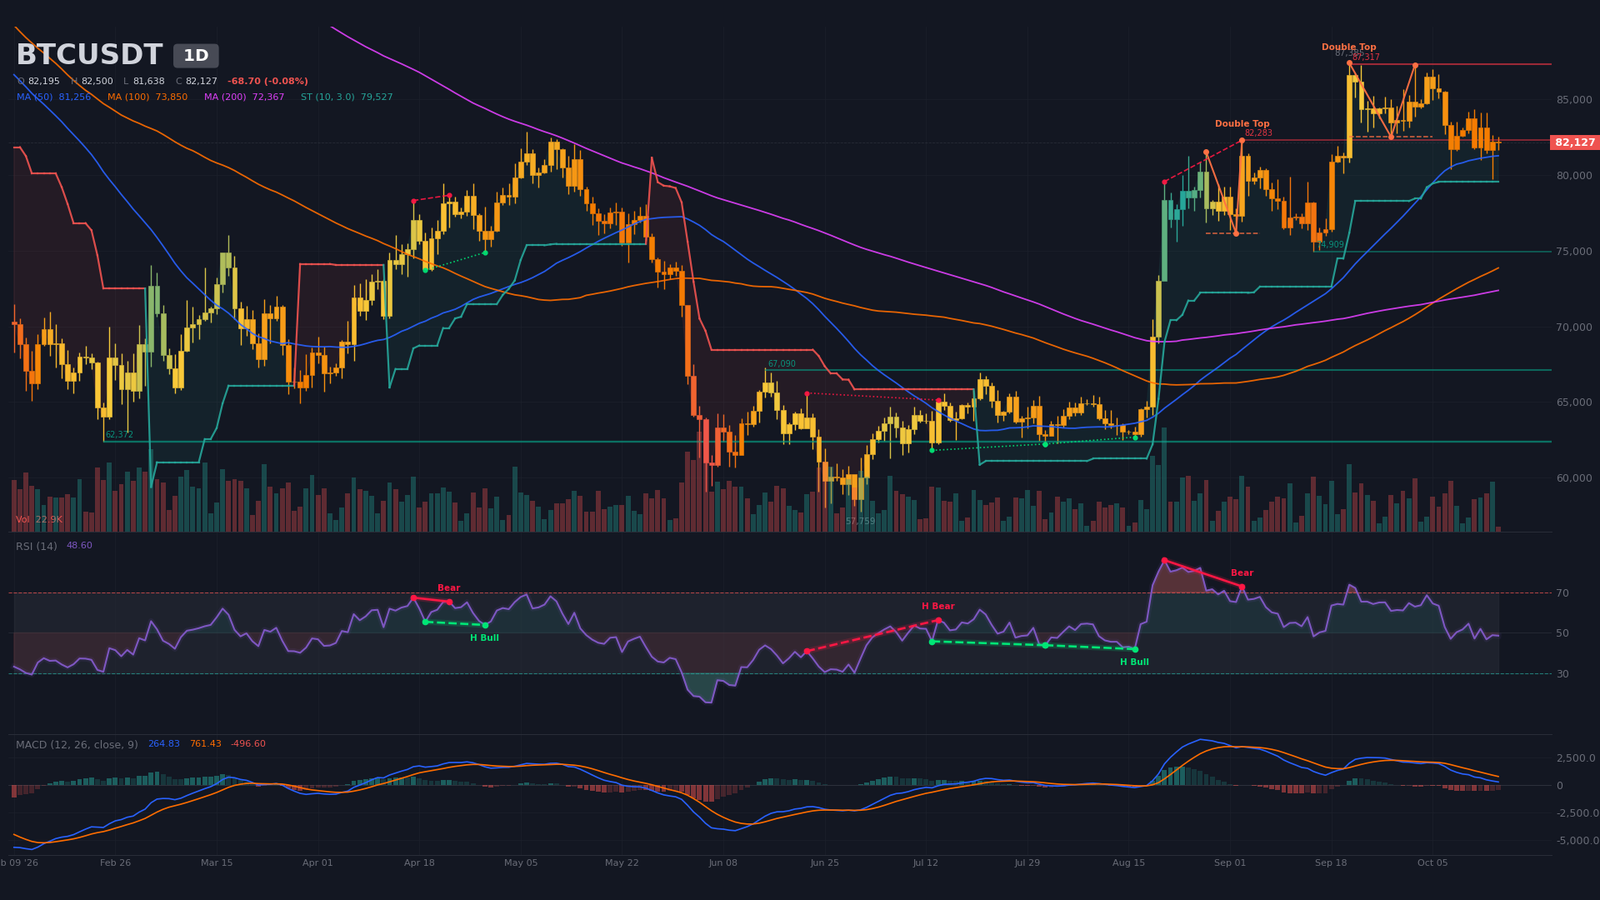
Daily Timeframe (1D): Confirmed Double Top, Silent Distribution
On the daily, BTCUSDT closes at $82,126 below the 20-day SMA at $83,598, above the 50-day SMA at $81,256 and well above the 200-day SMA at $72,367. The bullish 50/200 SMA crossover, dated September 8, still preserves the higher-timeframe bullish structure after 38 candles. The 14-period RSI prints around 49, neutral, following a 47-50-52-55-47-47-49 sequence over eight candles — the signature of an energy that is fading without rolling over. The MACD line at 264.8 sits below its signal at 761.4; the negative histogram at -496.6 has contracted since the bearish crossover on September 29. Daily volume stands at 22,920, equal to 18% of the 20-period average, characteristic of a wait-and-see phase.
The chart pattern detector validated a confirmed bearish double top with a neckline at $82,500, theoretical target at $77,683, and last pivot on October 2. An older pattern, neckline at $76,152 and target at $70,412, has already been satisfied by price history. A bearish RSI divergence was also flagged between August 21 (RSI 86, price $79,556) and September 3 (RSI 73, price $82,283) — a leading signal that effectively preceded the current decline. The daily SuperTrend remains bullish at $79,527; as long as the daily close holds above, the trend filter invalidates the purely bearish read of the double top.
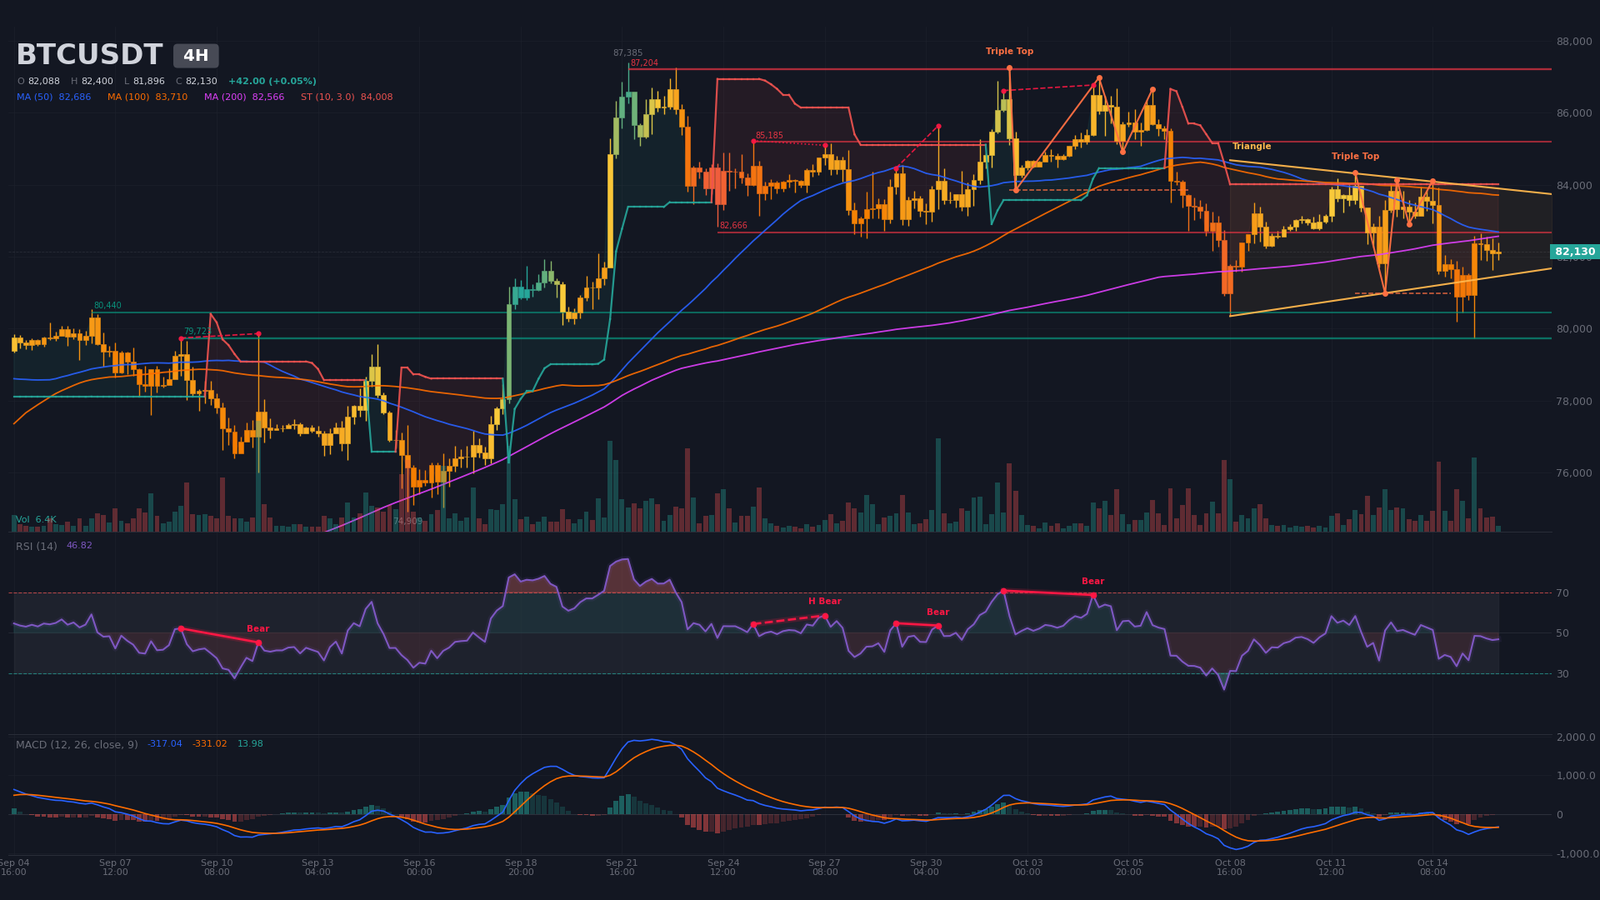
Intermediate Dynamics (4H): Symmetrical Triangle Compression
On the 4-hour, price at $82,130 is trading below all three SMAs (20 at $82,517, 50 at $82,686, 200 at $82,566) — an extremely tight squeeze, with most averages converging within ±$200 of each other. RSI at 47 stays neutral. MACD just produced a bullish crossover earlier today (October 16), with a positive histogram at +13.98 still below the zero line (-317 versus signal -331). The detected symmetrical triangle displays an upper boundary at $84,087, a lower boundary at $81,182 and an apex calibrated to October 25 at 20:04 — i.e. ahead of the Fed decision.
The detector also confirmed a bearish triple top with a neckline at $80,985, target at $77,773, last pivot October 14. The H4 SuperTrend flips bearish at $84,008. The triangle (short term) plus triple top (structure) combo compresses price inside a bearish reversal pattern, making any bullish triangle breakout unlikely without an external catalyst. As long as price holds between $81,182 and $84,087, structure is neutral; a downside break pulls the triple top back into play (target $77,773), an upside break runs straight into the bearish SuperTrend.
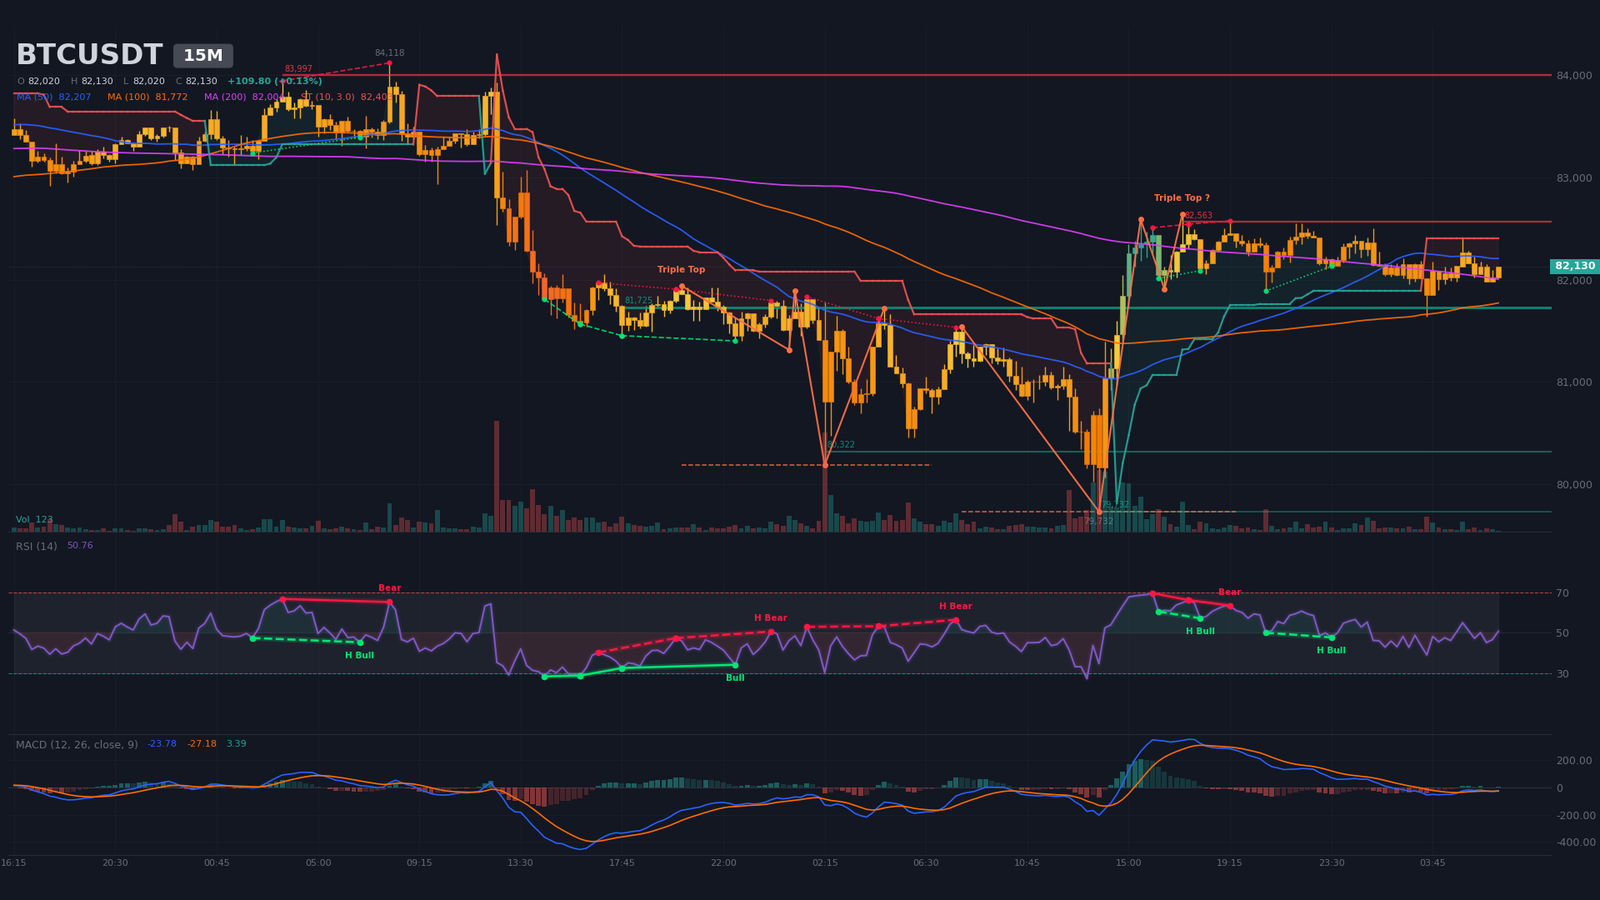
Intraday Structure (15m): $81,725 – $82,563 Range
On the 15-minute, price has stabilized inside a tight range after the overnight rebound. Support at $81,725 has been tested six times since October 14 (first touch October 14 at 17:45), making it the hard floor of microstructure. Resistance at $82,563 has been tested three times (first touch October 15 at 17:15). RSI is neutral at 51, MACD also crossed bullish this morning on October 16 with a positive histogram of +3.39 below zero — exactly mirroring the H4 print, pointing to a short-term technical rebound inside the range.
The M15 SuperTrend is bearish at $82,403. The detector flagged an unconfirmed triple top with a neckline at $79,732, target $77,209 — a pattern that remains hypothetical until a close below $79,732 is printed. The $81,996-82,049 zone concentrates bid walls up to $21.9M; the $82,210-82,263 zone concentrates ask walls up to $24.3M. The intraday read is a range tape with a bearish jaw (SuperTrend below price); a sweep of either edge is expected over the next 24 to 48 hours.
Multi-Timeframe Synthesis
| Timeframe | Dominant trend | RSI (14) | MACD | Chart pattern |
|---|---|---|---|---|
| Daily (1D) | Higher-TF bullish, near-term distribution | ~49 (neutral) | Bearish cross stabilizing (17 candles) | Confirmed double top (target $77,683) |
| 4 hours (4H) | Bearish compression | ~47 (neutral) | Fresh bullish cross (below zero) | Symmetrical triangle (apex October 25) |
| 15 minutes | Range $81,725 – $82,563 | ~51 (neutral) | Fresh bullish cross (below zero) | Unconfirmed triple top |
Technical Levels and Pivot Map
The method combines classical H4 pivots ($82,075), measured extensions from the swing high at $87,385 (September 21) and the swing low at $79,732 (October 15), overlay of estimated liquidation zones and H4 triangle edges. The short-term central pivot sits at $82,000-82,080, at the confluence of the 20/50/200 H4 SMAs and the M15 200 SMA — the zone that polarizes price until a macro verdict is reached.
| Level | Price (USD) | Category | Technical basis |
|---|---|---|---|
| R3 | $87,100 – $87,400 | Major resistance 3 | Swing high $87,385 from September 21; H4 resistance $87,204 (3 touches); short liquidation pocket $87,482-87,536 ($40.8M estimated) |
| R2 | $85,100 – $85,300 | Major resistance 2 | Short liquidation pocket $85,181-85,288 ($58.6M estimated, peak); projected H4 triangle upper boundary |
| R1 | $82,280 – $82,560 | Immediate resistance | Daily resistance $82,283 (1 touch); M15 resistance $82,563 (3 touches); ask wall $82,210 ($24.3M) |
| P | $82,000 – $82,080 | Central pivot | H4 pivot $82,075; 20/50/200 H4 SMAs converged; M15 200 SMA |
| S1 | $81,650 – $81,730 | Immediate support | M15 support $81,725 (6 touches, very solid); H4 20 SMA $82,517 acts as lower pivot |
| S2 | $80,300 – $80,500 | Major support 2 | H4 support $80,440 (2 touches); M15 support $80,322 (2 touches) |
| S3 | $79,650 – $79,750 | Major support 3 | October 15 low $79,732; H4 support $79,723 (3 touches); triangle structure low |
Order Book and Liquidity Heatmap
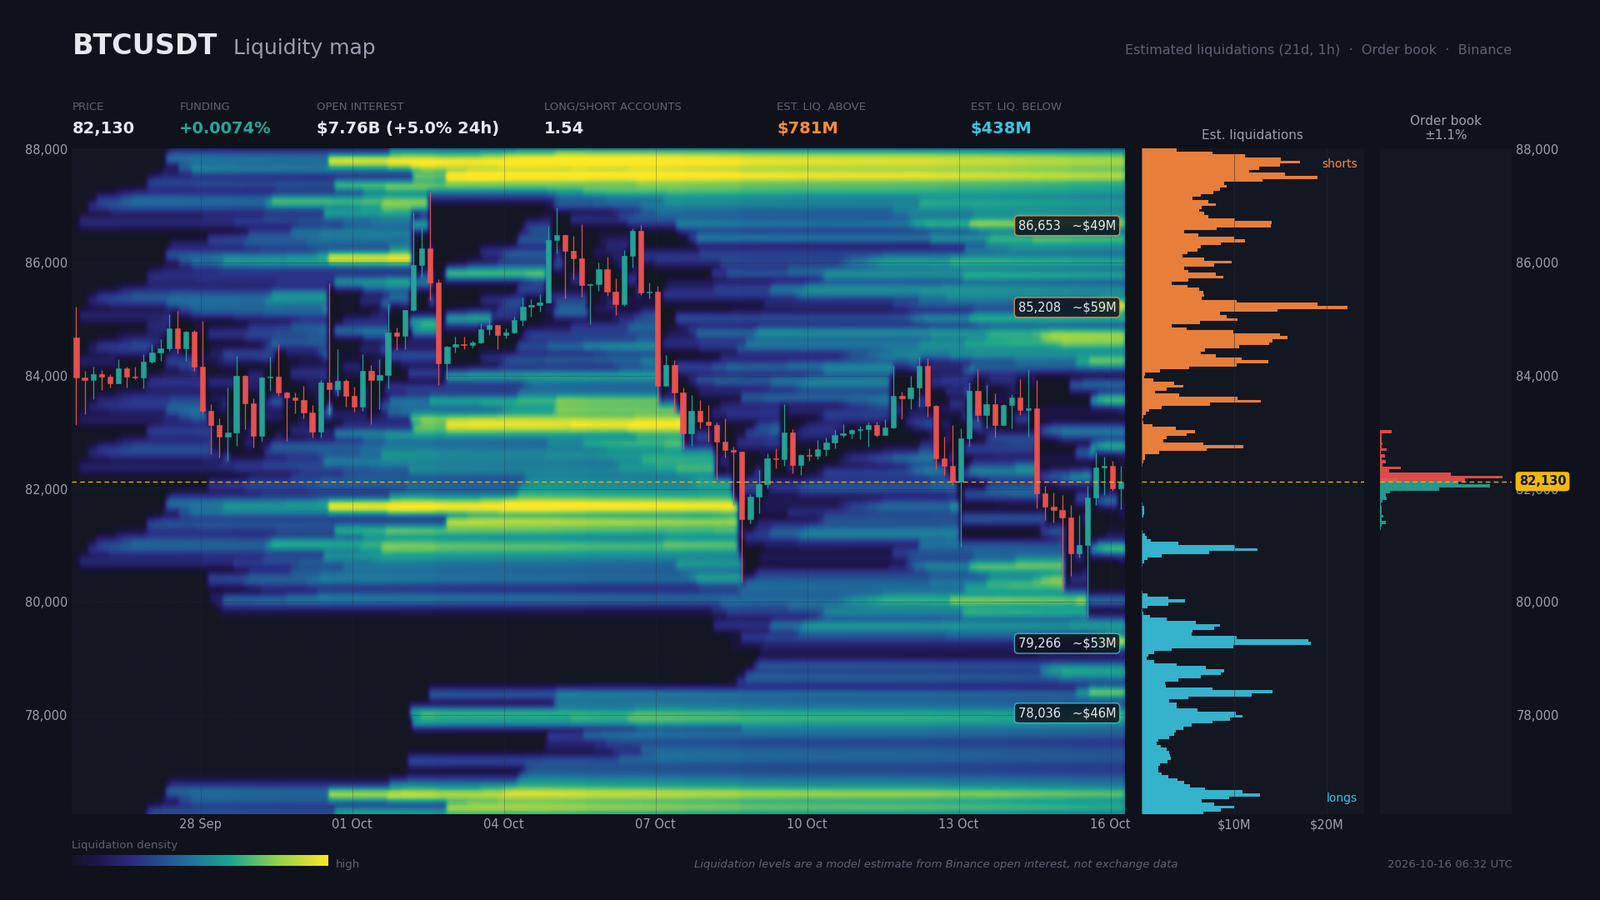
The Binance order book within ±2% shows a -6.2% imbalance ($60.9M of bids vs $68.9M of asks), a modest sell-side bias, with depth covering only 1.05% around price. Bid walls cluster at $82,049 ($21.9M) and $82,103 ($15.6M); ask walls at $82,210 ($24.3M) and $82,156 ($16.9M). Beyond that band, only the estimated liquidation map provides a read on available liquidity.
Open interest stands at $7.76B, up +4.98% over 24 hours and +1.62% over seven days: the market is actively repositioning after the inflation shock. Funding is neutral at 0.0074% (8.1% annualized), indicating neither side is paying an excessive directional premium. The global long/short ratio sits at 1.543, hence ~60% long accounts; the top trader ratio at 1.422 — a persistent long bias, structurally vulnerable in a downside scenario. Estimated liquidation zones above price cumulate to $781M, with the densest pocket at $85,180-85,288 ($58.6M, +3.75%), followed by $86,625-86,786 ($48.8M) and $87,482-87,536 ($40.8M). Below price, the tally reaches $438M, with the densest pocket at $79,239-79,346 ($52.9M, -3.49%), then $77,848-78,062 ($46.2M) and $78,329-78,436 ($40.6M).
The asymmetry favors an upside move through leverage effects (shorts more loaded above), but the daily imbalance remains bearish. Consequence: a liquidity sweep is likely. A push toward $85,200 would trigger roughly $107M of short liquidations; a return to $79,300 would trigger roughly $99M of long liquidations. Squeeze risk is slightly higher to the upside, which keeps the current range tactically loaded. All quoted pockets reflect a model estimate rather than confirmed positions.
Calendar: Catalysts to Watch
The current technical compression — the H4 triangle with its apex falling on October 25 — finds its resolution either via the US macro catalyst stream (jobless claims on Thursday, then the Fed decision on October 27-28) or via the triangle expiry itself. These two windows telescope and form the actual date of reckoning for the next sessions.
- Monday October 20, 04:00 (Zurich) — China GDP YoY: consensus 4.4%, prior 4.3%: Asian demand barometer ahead of the Fed.
- Tuesday October 21, 14:30 (Zurich) — US Housing Starts: prior 1,275k: mortgage credit proxy and indirect read on the rate path.
- Thursday October 23, 14:30 (Zurich) — US Initial Jobless Claims: prior 199k: first directional test after the hot PPI, able to invalidate or reinforce the scenario.
- Thursday October 23, 08:00 (Zurich) — UK Core Inflation YoY: prior 2.6%: leading indicator of the global inflation climate before the Fed.
- Saturday October 25, ~20:00 (Zurich) — H4 symmetrical triangle apex: pure geometric deadline, technical breakout window independent of macro.
- Tuesday-Wednesday October 27-28 — Fed rate decision: CME FedWatch 72.3% hold, majority expecting +25 bp in December: dominant catalyst of the month.
Three Scenarios for the Coming Weeks
The window ahead concentrates three types of catalysts — H4 triangle technical breakout, US labor data, and the Fed decision — any one of which can dictate direction on its own. The probabilities below, calibrated on the chart configuration and flows bias, sum to 100%.
Scenario A — Range Breakdown (probability 45%)
Trigger: hawkish surprise in the October 23 claims print, more restrictive Warsh tone, or a closing break of M15 support at $81,725. Trajectory: loss of the hard floor at $81,725 (six touches), test of H4 support at $80,440, then extension toward $79,723 (October 15 low and H4 support with three touches). Intermediate target $80,400-80,500; final target $78,600-79,700, aligned with the H4 triple top target ($77,773) and the estimated liquidation pocket at $79,239-79,346. Execution zone: confirmed M15 break below $81,700. Invalidation: H4 close above $82,100. Stop: $82,100 + 1×ATR H4 (~$980) = ~$83,080. R:R ≈ 1.8.
Scenario B — Range Persistence Then Bullish Resolution (probability 35%)
Trigger: fade of the hot PPI shock, stabilization of real rates, sustained return of US spot ETF inflows (>$500M/week). Trajectory: hold between $81,725 and $82,563 for 24-48 hours, bullish break of M15 resistance at $82,563, then breach of the H4 SuperTrend at $84,008. Successive targets at $83,300-83,600 (R1), $84,000-84,430 (daily R2 and H4 SuperTrend), $85,100-85,300 (densest short liquidation pocket). Execution zone: M15 break above $82,600 with H4 close > $82,700. Invalidation: H4 close below $81,700. Stop: $81,700 – 1×ATR H4 ≈ $80,720. R:R ≈ 1.7.
Scenario C — Bearish Expansion Toward the Daily Neckline (probability 20%)
Trigger: hawkish Fed decision on October 27-28, or downside break of the H4 triangle before the October 25 apex. Trajectory: break of the triangle lower boundary at $81,182, acceleration toward $80,000, then toward $77,683, the theoretical target of the daily double top. Execution zone: confirmed H4 break below $81,000. Invalidation: H4 recovery above $81,700. Stop: $81,700 + $980 ≈ $82,680. R:R ≈ 2.5, but lower probability given the still-bullish daily SuperTrend at $79,527.
Synthesis and Conclusion
Bitcoin trades in a compression phase where bearish reversal patterns (daily double top, H4 triple top) coexist with a still-bullish daily SuperTrend at $79,527 and ETF flows back in positive territory. The H4 triangle apex on October 25 and the Fed decision on October 27-28 carve a window of concentrated volatility: the market is searching for a trigger; the hot PPI on October 15 delivered it from below, the rebound that followed has yet to deliver a strength signal. The confluence score stands at 3/5, signaling medium conviction.
The dominant strategy remains selling rallies toward $82,280-82,560 (immediate resistance, daily resistance and ask walls confluence), with invalidation above $84,100 (H4 SuperTrend). Buying is reasonably contemplated only on a confirmed sweep below $79,700 followed by a reversal, or on an M15 breakout above $82,600 with H4 confirmation. Protection levels: short invalidation at $84,100, long invalidation below $79,700.
Sources
- Bitcoin slips under $80K after US PPI gains most in four years — Cointelegraph, October 15, 2026
- Russia Will Soon Ban Peer-to-Peer Bitcoin Trading, Central Bank Confirms — Decrypt, October 15, 2026
- Bitcoin’s Volatility Has Fallen Within S&P 500 Ranks, Study Shows — Bitcoin Magazine, October 15, 2026
- Fed’s Warsh withholds rate signal, praises recent global tightening — CNBC, October 16, 2026
- MSCI finalizes index rules that put Strategy, crypto treasury firms at risk — The Block, October 15, 2026
- Australia releases draft bill to adopt OECD crypto tax reporting framework — Cointelegraph, October 16, 2026
- US Hoovers up Bitcoin While the World Runs on Its Digital Dollars — Bitcoin Magazine, October 15, 2026
- Bitcoin Briefly Slides Below $80,000 On More Hot Inflation Data — Bitcoin Magazine, October 15, 2026
- Bitcoin Whipsaws as Crypto Liquidations Near $1 Billion — Decrypt, October 15, 2026
- Spot Bitcoin ETFs Cross $1B Last Week In Inflows — Bitcoin Magazine, date not specified
- Crypto Futures Liquidations Surge as Bitcoin Breaks Below $82,000 — E8 Markets, October 13, 2026
- India’s rupee forecast to weaken toward 100-per-dollar — CNBC, October 16, 2026
- CleanSpark and BitFuFu see bitcoin production slip in September — The Block, October 15, 2026
- IMF Global Financial Stability Report, October 2026 — elibrary.imf.org
- Adviser and Regulated Fund Custody Rules; Crypto Custody Rules — SEC.gov, October 1, 2026
- Economic calendar — TradingEconomics via crypto.fr, data from October 14 to 23, 2026 — aggregate economic calendar integrated into the brief
Disclaimer: This article is for educational and informational purposes only. It does not constitute investment advice, a recommendation to buy or sell, or an invitation to trade any financial asset. Cryptocurrency markets are extremely volatile; any investment decision should be based on your own research (DYOR) and, where appropriate, the advice of a licensed financial adviser.

