


Bitcoin trades at $83,870 this October 13, 2026, up 2.5% on the still-open daily candle but still 4% below the period high of $87,385 set on September 21. Price remains 45% above the year’s earlier low of $57,759, confirming that the broader uptrend is intact — only the summer-autumn consolidation phase needs to be arbitrated. The current regime is a compression under resistance, following last weekend’s liquidation cascade that dragged spot below $82,000 in the Sunday-to-Monday overnight session.
The dominant event of the week is the October 12 forced-liquidation wave. According to CoinGlass cited by The Block, $771M in positions were wiped in 24 hours, of which $685.6M — or 89% of the total — were longs. That imbalance alone explains the brutality of the move below $82,000 and the sharp rebound that followed: the market first cleared the most exposed directional long positioning, then rebuilt an intraday technical floor. Derivatives remain under tension: open interest stands at $7.835B, down 3.54% over seven days — a classic post-cascade deleveraging — while annualized funding at 9.1% continues to pay shorts, a sign that seller caution still dominates the carry trade.
The macroeconomic backdrop reinforces the bearish tilt. US Treasury yields have pushed to levels not seen since 2002: 5.35% on the 10-year and 5.724% on the 30-year, per Investing.com (October 7). The IMF piled on October 13, warning of a “disorderly” surge in sovereign yields amid worsening debt and inflation risks (CNBC, 10/13). On recent data, the FOMC minutes from the September 15-16 meeting, published October 7, confirmed a hawkish tone with expectations of a 25 basis-point hike by year-end. The preliminary University of Michigan consumer sentiment index, released Friday October 9 at 16:00, came in at 46.3, missing the 47.6 consensus and the 48.1 print, signaling a US consumption slowdown.
Institutional flows complete this mixed picture. The Block (10/12) reported $681M in net outflows from US spot Bitcoin ETFs last week — the worst stretch since late June, per SoSoValue. Conversely, an OG whale moving $378M in BTC after six years of dormancy, flagged by The Block on October 13, illustrates long-term holder profit-taking. On the structural side, Standard Chartered announced it will custody Ripple’s RLUSD stablecoin in Dubai, Morgan Stanley targets tokenized equity support in Q1 2027, and the Moscow Exchange is preparing to launch BTC trading in December: all medium-term bullish supports that carry no weight in the short term. This configuration calls for a rigorous, timeframe-by-timeframe technical read to separate intraday noise from underlying structure.
“BTC defends its post-liquidation rebound against an intact daily double top — Wednesday’s 10/14 US CPI will decide between the bearish $77,700 target and a retest of the $87,300 magnet.”
Key phrase from the desk note, 10/13/2026
Multi-Timeframe Technical Analysis
Daily Timeframe (1D): Confirmed Double Top Under Resistance
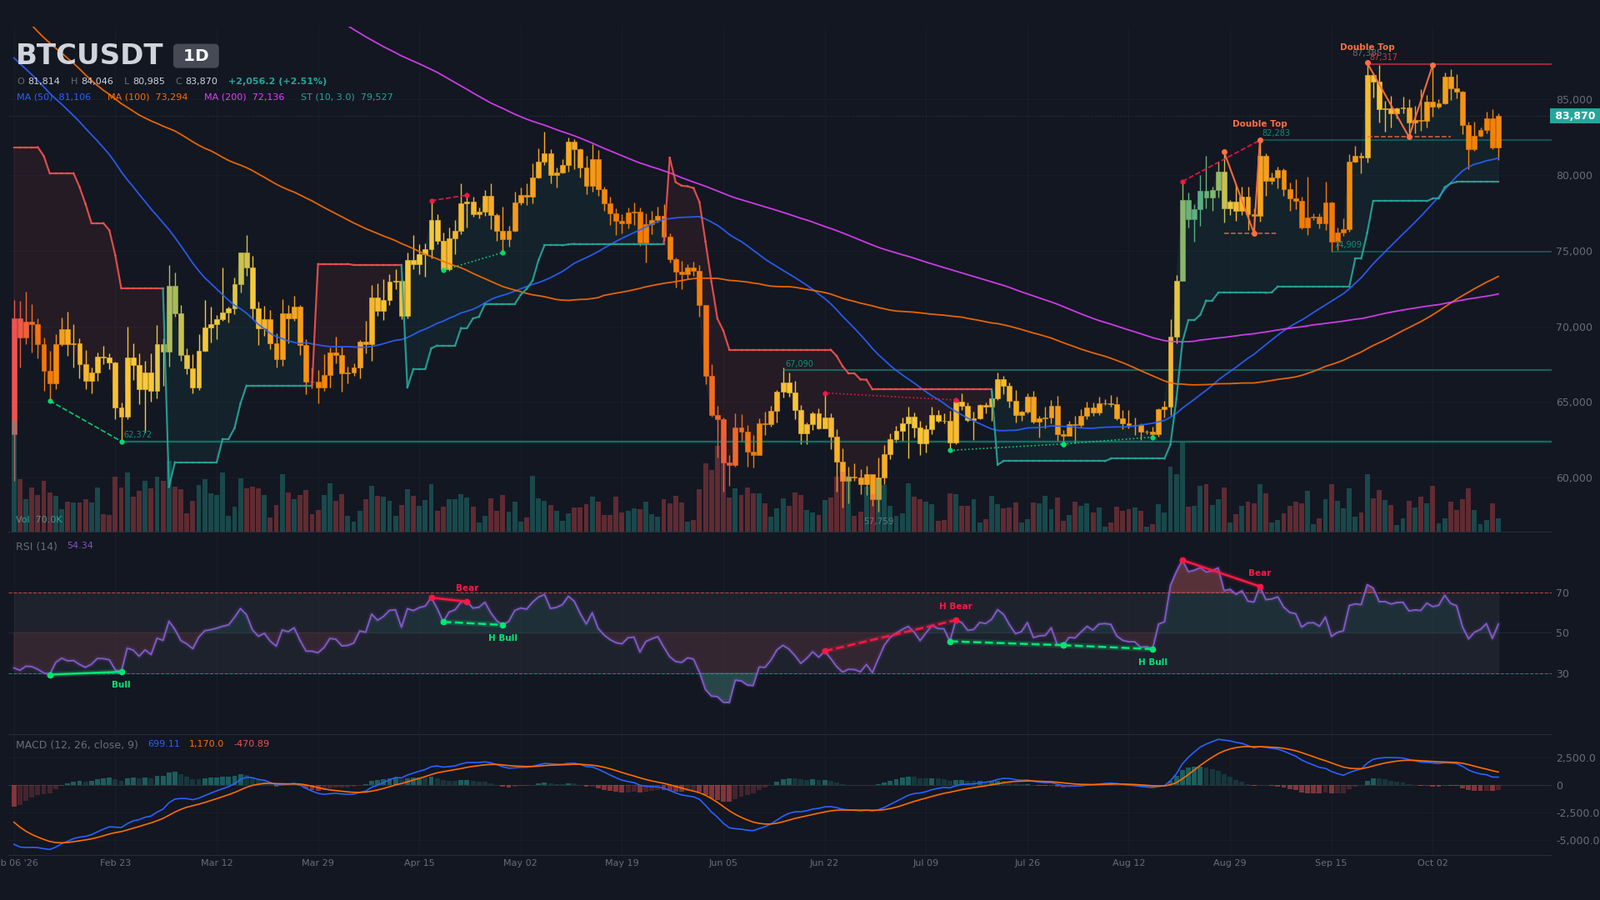
Price prints at $83,870, below the 20-day simple moving average (SMA20) at $83,979 but above the SMA50 at $81,106 and well above the SMA200 at $72,136. The 50/200 golden cross, formed on September 8 — 35 daily candles ago — remains the structural long-term bullish foundation and is not under threat. Volatility is elevated, with a daily ATR14 of $2,196 (2.6% of price), a signature of a wide-range regime.
Two confirmed bearish double tops shape the chart. The most recent, with a neckline at $82,500 and last pivot dated October 2, projects an algorithmic target of $77,683. An older double top (neckline $76,152) projects $70,412. The daily SuperTrend, bullish at $79,527, however suggests the bearish breakdown is not yet in play as long as that level holds — a technical argument that prevents unilateral directional bets. RSI14 at 54 is neutral; the successive swing highs of September 21, October 2 and October 5 print progressively lower RSI (73.9 → 63.0 → 64.5), drawing a regular bearish divergence. MACD, though still above zero (line 699, signal 1,170), is in a bearish cross since September 29, with a negative histogram expanding at −470. Volume on the current candle (70,042, 55% of the 20-day average) signals limited buying conviction on the rebound.
Intermediate Dynamics (4H): Confirmed Triple Top and Bearish SuperTrend
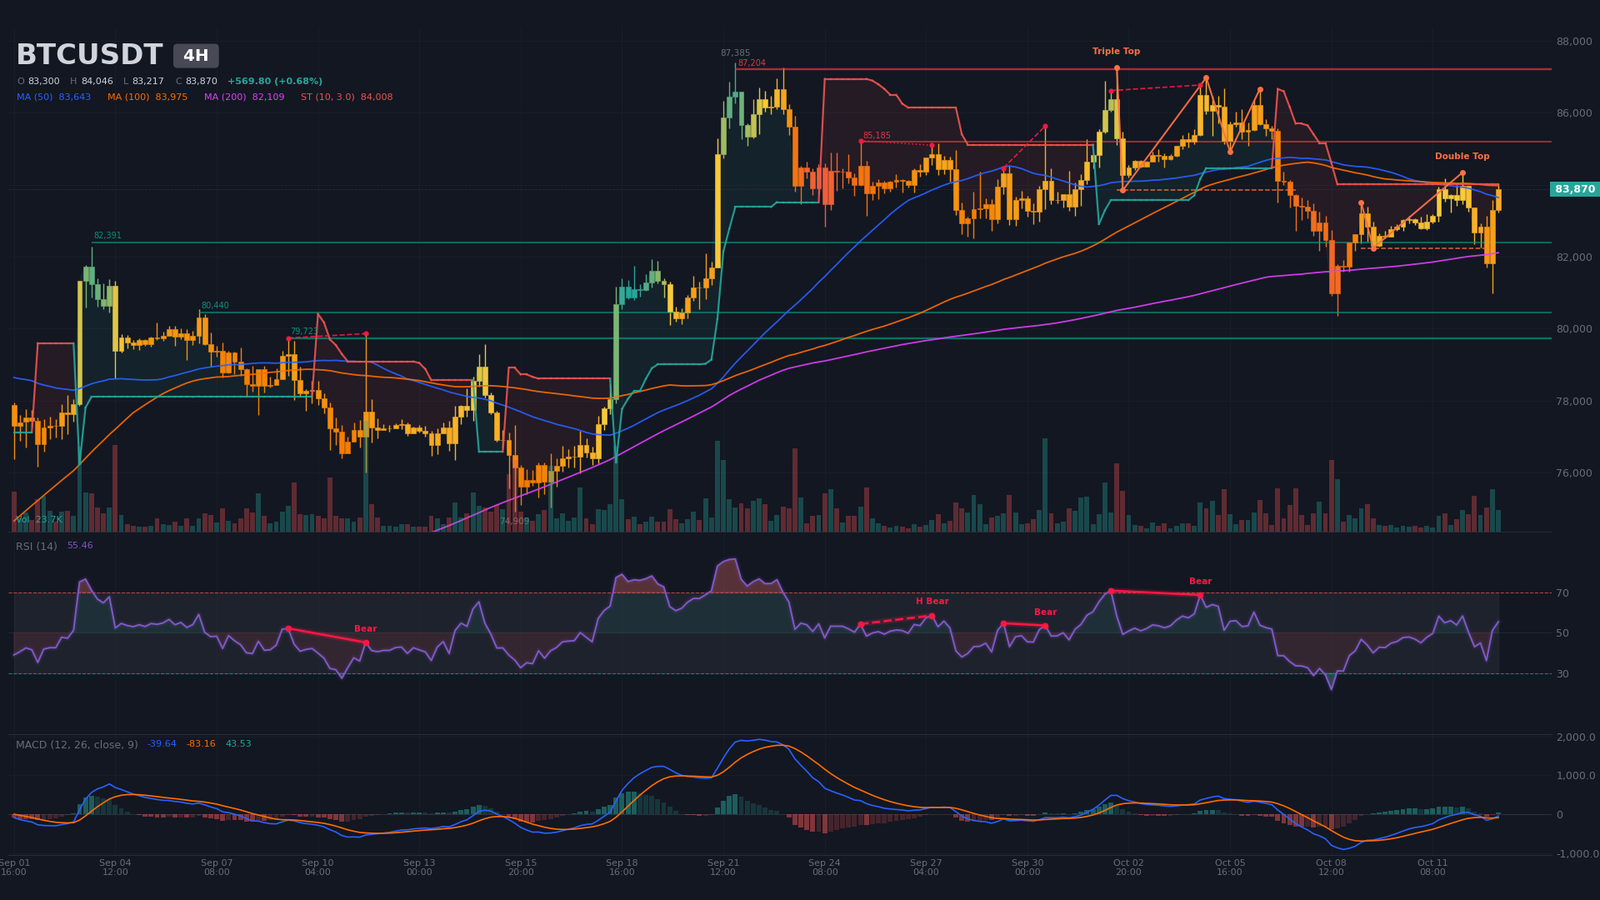
Price trades within a wide 4H range between $80,344 (October 8 low, RSI 31) and $86,684 (October 5-6 highs, RSI 53). The dominant pattern is a confirmed bearish triple top: neckline at $83,842, last pivot October 6, algorithmic target $80,720. A regular bearish divergence was detected between October 2 and 4, with price moving from $86,617 to $86,770 while RSI slipped from 70.9 to 68.8 — a classic buyer-exhaustion signal.
The 4H SuperTrend is bearish at $84,008 — almost exactly the immediate resistance capping the current rebound. Price trades above the SMA20 ($83,131), SMA50 ($83,643) and SMA200 ($82,109), a typical mean-reversion configuration after a selloff, without any true trend reversal. MACD just produced a bullish cross this morning at 04:00 (line −40, signal −83, histogram +44), the first sign of positive momentum but still below zero. Current 4H volume of 23,687, representing 160% of the 20-period average, confirms real participation in the rebound — it is the test of the bearish SuperTrend at $84,008 that will determine the next leg.
Intraday Structure (15m): Ascending Channel Rebound Capped at $84,200
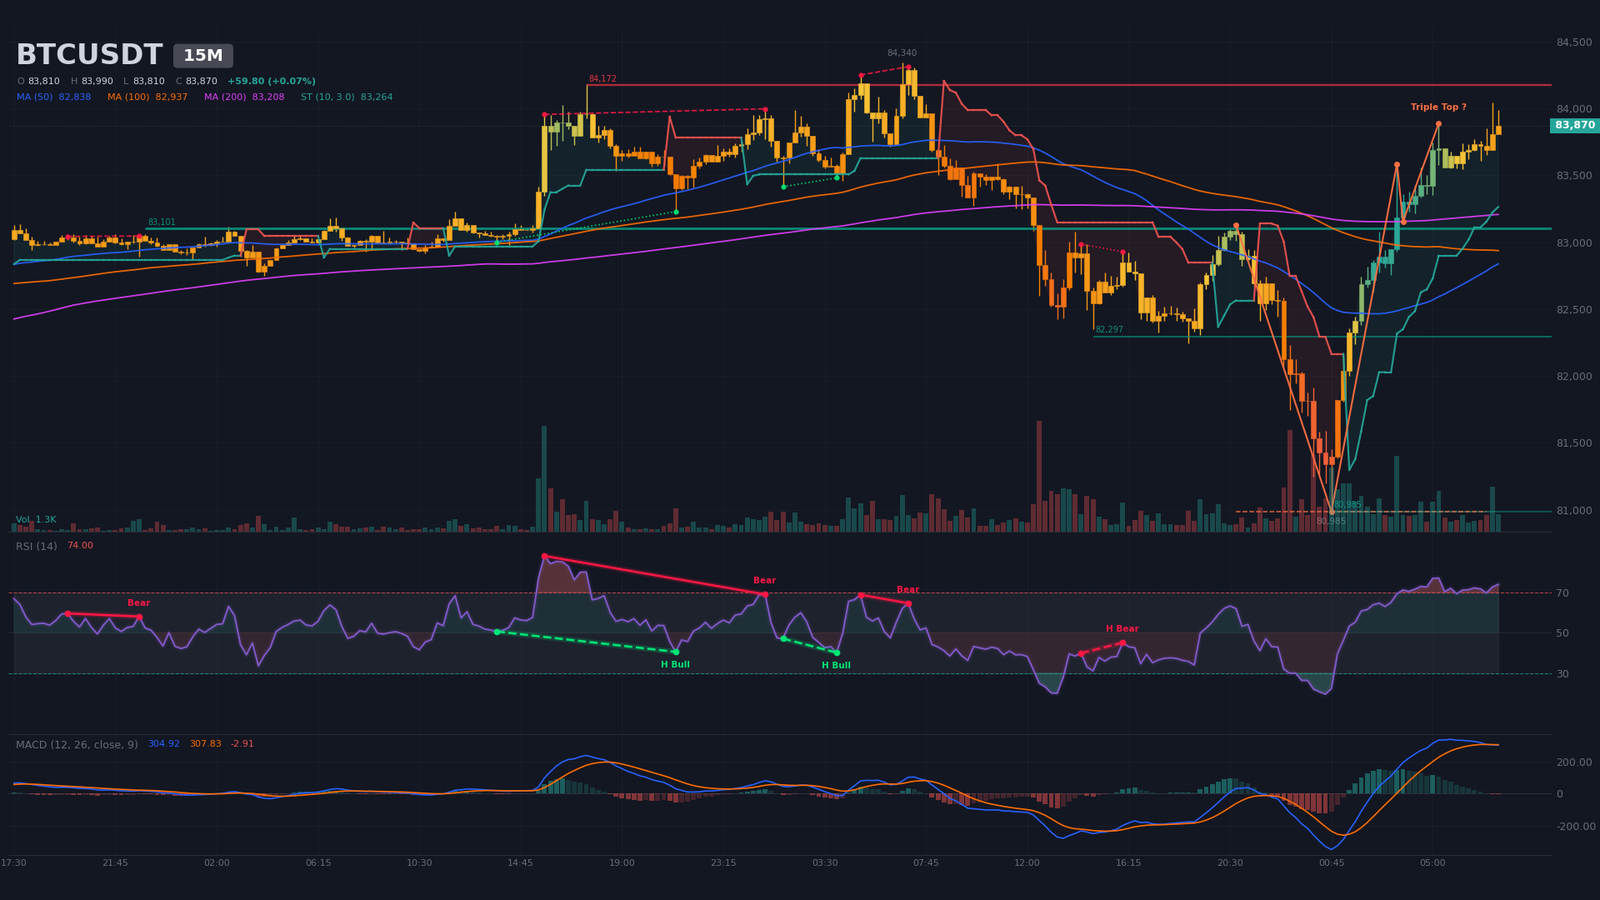
The 15-minute chart draws an ascending channel rebound since the sweep of $80,985 at 00:45, where RSI14 bottomed at 22.4 — capitulation-low territory. Price rebuilt 3% over six hours, only to stall against a $84,000–$84,200 resistance band: the $84,172 resistance is confirmed by three algorithmic touches, doubled by the R1 pivot at $84,008 and the 4H SuperTrend at $84,008. RSI14 at 74 enters overbought territory and MACD just produced a fresh bearish cross at 07:30 (line 305, signal 308, histogram −2.9) — the first signal of move exhaustion.
The key intraday support is $83,101 (ten algorithmic touches, the densest demand concentration on short timeframes), then $82,297 (two touches). A break below $83,101 would invalidate the 15m bullish dynamic and expose the $82,244 low. The upper bound of the intraday range is $84,172; a break to the upside would open $84,487 then $84,800.
Multi-Timeframe Synthesis
| Timeframe | Dominant Trend | RSI (14) | MACD | Chart Pattern |
|---|---|---|---|---|
| Daily (1D) | Bearish (confirmed double top) | 54 (neutral) | Bearish cross 9/29, positive histogram contracting | Double top 82,500 / target 77,683 |
| 4 hours (4H) | Bearish (confirmed triple top) | 55 (neutral) | Fresh bullish cross (10/13 04:00), below zero | Triple top 83,842 / target 80,720 |
| 15 minutes (15m) | Bullish corrective (overbought) | 74 (overbought) | Fresh bearish cross (10/13 07:30) | Unconfirmed triple top 80,985 |
Technical Levels and Pivots Map
The method combines classic pivots, detected swing highs and lows, algorithmic supports and resistances, estimated liquidation pockets, and SuperTrend levels. The short-term central pivot sits at $83,535 (daily R1) — the technical battle of the session is being fought around that level.
| Level | Price (USD) | Category | Technical Foundation |
|---|---|---|---|
| R3 | 87,300 – 87,400 | Major resistance | Daily resistance 87,317 (2 touches) + estimated short liquidation zone 87,481–87,941 ($175M) |
| R2 | 85,100 – 85,300 | Major resistance | 4H resistance 85,185 (2 touches); short liquidation zone 86,614–86,706 ($41M) |
| R1 | 84,000 – 84,200 | Immediate resistance | 4H bearish SuperTrend 84,008; 15m resistance 84,172 (3 touches); sell wall 83,984 ($7M) |
| P | 83,500 – 83,850 | Central pivot | Daily R1 83,535; 4H triple top neckline 83,842; 4H SMA50 83,643 |
| S1 | 82,300 – 82,400 | Immediate support | Daily support 82,283 (1 touch), 4H support 82,391 (2 touches), 4H swing low 10/11 at 82,751 |
| S2 | 80,800 – 81,100 | Major support | Daily S1 80,896; October 8 4H low 80,344 (RSI 31); daily SMA50 81,106 |
| S3 | 79,800 – 80,000 | Major support | Estimated long liquidation zone 79,798–80,073 ($62M combined); September 9 low 80,000 |
Order Book and Liquidity Heatmap
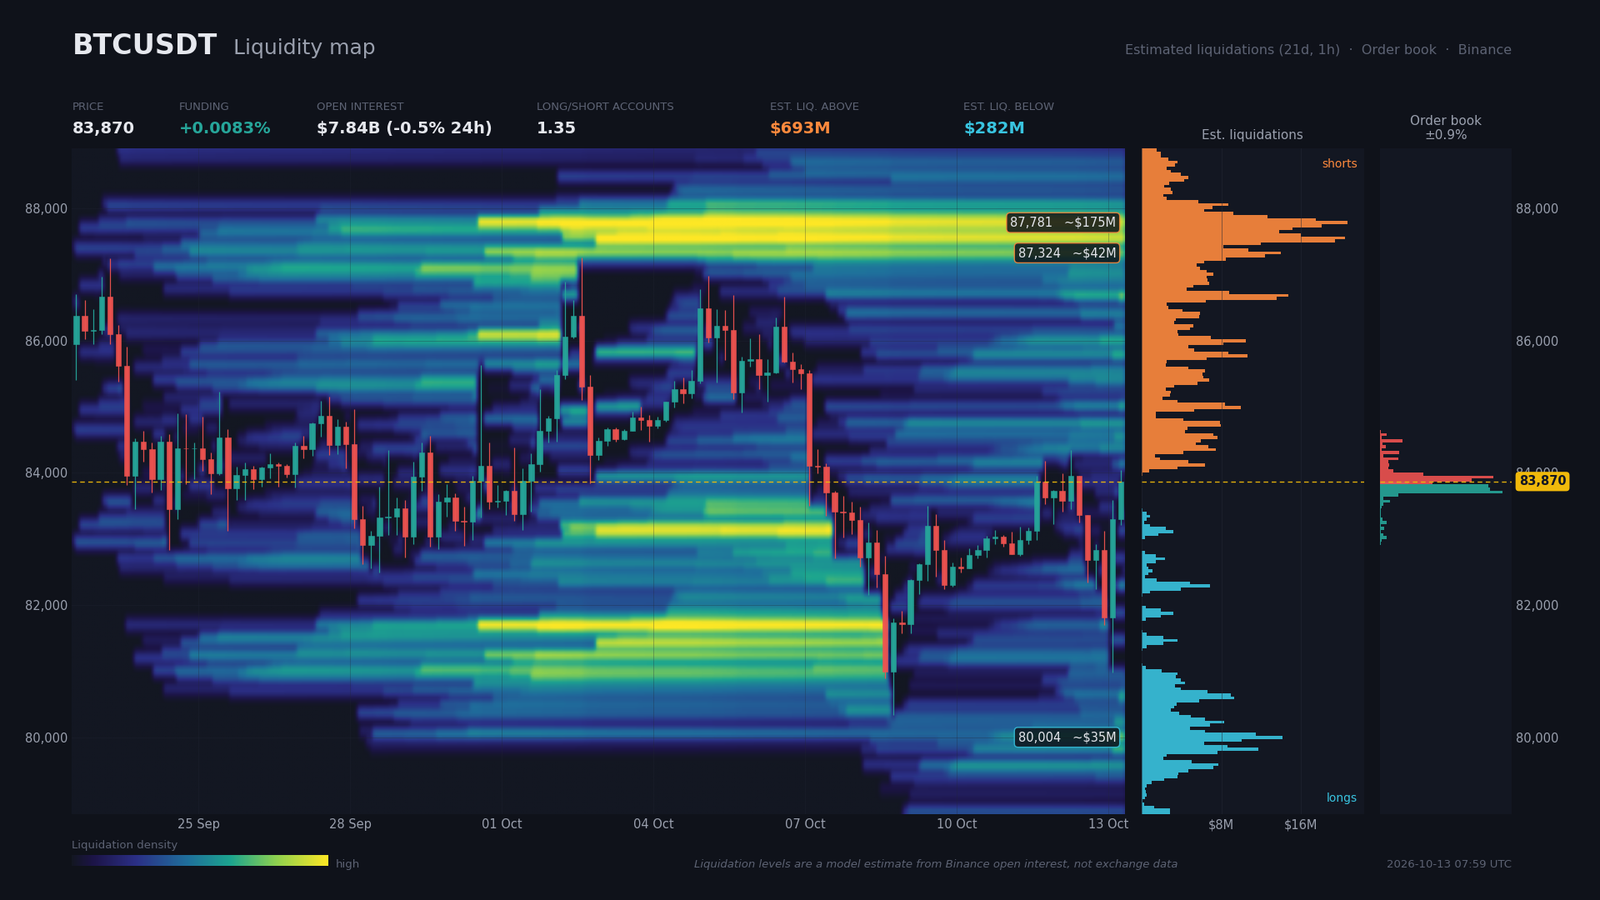
The Binance order book is near-balanced within 2% of price: $69.25M in bids against $67.66M in asks, an imbalance of just +1.2% in favor of buyers. Published coverage is only 0.91% around spot, meaning beyond that liquidity is known only through liquidation estimates. Buy walls concentrate just below price: $19.8M at $83,709 (−0.19%), $17.8M at $83,755 and $17.5M at $83,801. Sell walls are slightly higher: $18.3M at $83,938 (+0.08%), $14.9M at $83,893 and $7.0M at $83,984. The $84,000 resistance is therefore thick — roughly $23M combined between $83,938 and $84,008 — explaining the intraday rebound stall.
Estimated liquidation pockets above price (shorts) total $692.8M and concentrate in three clusters: $87,481–$87,941 ($175M, +4.7% from spot), $87,255–$87,392 ($42M) and $86,614–$86,706 ($41M). Pockets below (longs) total $281.7M: $79,981–$80,073 ($35M, −4.6%), $79,798–$79,844 ($26M) and $79,524–$79,615 ($20M). The asymmetry is clear: shorts above are worth 2.5× the longs below, making a short squeeze more likely than a deep bearish sweep. Open interest at $7.835B is down 0.48% over 24 hours and 3.54% over seven days, a sign that post-liquidation deleveraging continues and reduces the probability of another violent flush near term. The top-trader long/short ratio at 1.58 confirms dominant but not euphoric long positioning. Consequence: the price magnet is asymmetric to the upside, with limited bearish sweep risk.
Calendar: Catalysts to Watch
The week is dominated by the major macro release of the month for risk assets: the US CPI print on Wednesday October 14 at 14:30 (Zurich). A hawkish surprise would revive pressure on long-end yields and risk assets; a dovish surprise would trigger the daily double-top resumption scenario. Here are the high-impact dates over the next ten days.
- Wednesday October 14, 03:30 (Zurich) — China CPI MoM (consensus +0.3%, previous +0.4%): support or pressure on Asian BTC demand.
- Wednesday October 14, 04:10 and 10:30 (Zurich) — Lagarde speech (ECB): tone on the euro, spillover to risk assets.
- Wednesday October 14, 14:30 (Zurich) — US CPI m/m and Core CPI m/m (consensus CPI 336.67, previous 334.131; core +0.2%, previous +0.3%): major catalyst, likely to push BTC out of the $82,000–$84,200 compression.
- Thursday October 15, 14:30 (Zurich) — Core PPI m/m (consensus +0.3%, previous +0.2%) and Retail Sales m/m (consensus +0.3%, previous +1.2%): confirm or correct the CPI signal.
- Tuesday October 13, 16:00 (Zurich) — US Existing Home Sales (consensus 3.96M, previous 3.98M): limited implication for BTC.
- Friday October 9, 16:00 (Zurich) — UoM Consumer Sentiment preliminary (released: 46.3 vs consensus 47.6, previous 48.1): consumption slowdown signal, neutral-to-bearish for BTC.
Three Scenarios for the Coming Weeks
The current compression under $84,200 will likely resolve around Wednesday’s US CPI. Three trajectories emerge, weighted by technical configuration and the probability of a directional catalyst.
Scenario A — Rejection Under Resistance and Rotation to the Double-Top Target (probability 55%)
Catalyst: hawkish 10/14 US CPI or simple technical exhaustion after the rebound. Trigger: 4H rejection below $84,172 with a 4H close below $83,842 (triple-top neckline). Trajectory: break 83,500 → 82,400 → 81,100 (daily SMA50) → $80,720 (4H triple-top target) → $77,683 (daily double-top target, in case of bearish macro catalyst). Execution zone: shorts at 83,800–84,000 with stop at $84,600 (above 1×4H ATR14 of $838). Invalidation: daily close above $85,200 (4H R2). R:R ≈ 2.2 on the $80,720 target.
Scenario B — Wide Range $80,300–$85,200 (probability 30%)
Catalyst: no major surprise at the CPI. Trigger: neither a break of $84,200 nor of $80,300 over two to three daily candles. Trajectory: oscillation around the $83,500 pivot, classic range trading. Execution zone: buys at 80,300–80,900 (S2/S1) with TP at $84,200 (R1), stops below $80,000 (above 1×daily ATR14 of $2,196). Invalidation: daily close above $85,200 or below $80,300. R:R ≈ 1.9.
Scenario C — Upside Break Toward the $87,300 Liquidity Magnet (probability 15%)
Catalyst: soft US CPI (core below 0.2%) or relief on long-end yields. Trigger: daily close above $85,200 then $86,700. Trajectory: 85,200 → 86,700 → $87,300–$87,400 (short liquidation pocket $175M, daily R3). Execution zone: buys at 85,200–85,500, stop below $84,000 (above 1×daily ATR14). Invalidation: return below $84,200 on a daily close. R:R ≈ 1.8 on the $87,300 target.
Summary and Conclusion
Bitcoin sits in a post-liquidation transition phase, where the short-term technical rebound — overbought 15m, contracting daily MACD, constructive intraday structure — runs into a medium-term bearish chart wedge: confirmed daily double top, confirmed 4H triple top, RSI bearish divergence. Outgoing ETF flows and persistent US long-end yield pressure (5.35% on the 10-year, 5.724% on the 30-year) make up the dominant headwind, while structural supports (Morgan Stanley tokenization, Standard Chartered RLUSD, Moscow Exchange) play in the background without weighing on the short term.
The dominant technical strategy is to short rebounds toward $84,000–$84,200 as long as the daily close stays below $85,200, with protection above the bullish daily SuperTrend at $79,527 in case of a squeeze. The priority catalyst is the US CPI on October 14 at 14:30 (Zurich), likely to decide between the bearish $77,700 target and a retest of the $87,300 magnet. Five critical levels remain in focus: $87,300–$87,400 (R3, short magnet $175M), $84,000–$84,200 (immediate R1), $83,500 (central pivot), $80,800–$81,100 (S2, daily SMA50) and $79,800–$80,000 (S3, long liquidation pocket $62M).
Sources
- Bitcoin whale moves $378 million in BTC after six years of dormancy — The Block, 13/10/2026
- Bitcoin slides below $82,000 as crypto liquidations surge past $770 million — The Block, 12/10/2026
- Moscow Exchange to Launch Bitcoin Trading, Testing Underway — Bitcoin Magazine, 12/10/2026
- Bitcoin drops to $84k sees $143 million in liquidations as ETF inflows turn positive — CryptoSlate, 07/10/2026
- Bitcoin Liquidations Reach $696 Million as Leveraged Longs Unwind — Investing.com, 07/10/2026
- IMF warns bond yields could see a ‘disorderly’ spike as debt, inflation risks worsen — CNBC, 13/10/2026
- Minutes of the Federal Open Market Committee, September 15-16, 2026 — federalreserve.gov, 07/10/2026
- Binance VIP head says hedge funds are actively exploring arbitrage opportunities on crypto venues — The Block, 13/10/2026
- Standard Chartered Will Hold Ripple’s Stablecoin in Dubai — Decrypt, 12/10/2026
- Morgan Stanley expects to support tokenized equities in Q1 2027 — The Block, 12/10/2026
- Bitcoin Crypto Spooked? Crypto Fear and Greed Index Drops to Pre-Rally August Lows — Decrypt, 12/10/2026
- CFTC’s new crypto framework could face 2028 election deadline — The Block, 12/10/2026
- SEC proposes crypto custody rules for investment advisers, funds — Yahoo! Finance, 02/10/2026
- Bullish bitcoin (BTC) bets build as open interest jumps by $2.3 billion — CoinDesk, 02/10/2026
Disclaimer: This article is for educational and informational purposes only. It does not constitute investment advice, a recommendation to buy or sell, or an invitation to trade any financial asset. Cryptocurrency markets are extremely volatile; any investment decision should be based on your own research (DYOR) and, where appropriate, the advice of a licensed financial adviser.

