


Bitcoin trades at $83,086 as of October 11, 2026, up 0.17% on the day but down 2.83% over five sessions and 4.03% over twenty candles. Price remains 4.9% below the period high at $87,385.1 set on September 21, 2026, and holds a +43.85% premium over the analytical window low at $57,758.6. The multi-timeframe structure reveals a post-top distribution phase: a confirmed bearish double top on the daily, a confirmed bearish triple top on the H4, and an M15 intraday rebound. The technical bias stays NEUTRAL with a slight bearish tilt, MIDDLE conviction, and a 2/5 confluence score.
The dominant market driver of the week remains the October 8 purge. Bitcoin broke below $81,000 in a sharp drop that triggered nearly $1 billion of liquidations across the crypto complex — $974M according to CoinGlass, reported by Yahoo Finance on October 8, 2026. The breakdown was unambiguous: $896M in long positions, $78M in shorts, with ETH absorbing $311M and BTC $238M. A tanker attack off Qatar that same day sent WTI up 5.5% to $93, fueling risk-off behavior. Bitcoin has since recovered (+1.38% on Friday, October 9 to $82,837 per Decrypt) without erasing the weekly loss.
The macro and regulatory backdrop reinforces institutional caution. Spot Bitcoin ETFs registered approximately $681M of outflows last week, ending three consecutive weeks of inflows (Bitcoin Magazine, October 9, 2026; The Block, October 10, 2026). Ethereum ETFs posted their worst week since January with $542M of outflows, 88% concentrated in BlackRock’s ETHA ($477M) — nine sessions in the red according to Crypto Briefing (October 11, 2026). BTC perpetual open interest sits at $7.7B, down 6.88% over seven days, a signal of gradual leverage unwinding after the purge. On the macro print side, FOMC minutes from October 7 delivered no directional signal, while the preliminary UoM index on October 9 printed 46.3 versus 47.6 consensus, a disappointment that weighs on sentiment. The Federal Reserve remains led by Kevin Warsh (Chair) with John C. Williams as Vice Chair (federalreserve.gov, October 7, 2026). The U.S. Treasury separately announced its intent to seize $1B in crypto linked to Iran (Bitcoin Magazine and Cointelegraph, October 9, 2026). The SEC proposed on October 1 a modernized framework for crypto custody, expanding asset-manager options without shifting ETF demand (Investing.com). In France, the Finance Committee adopted on October 10 a crypto-to-stablecoin swap tax under MiCA and extended the exit tax to crypto assets above €800,000 per household, effective January 1, 2027 (Decrypt).
This configuration — bearish chart patterns, ETF outflows, unwound leverage, and an uncertain CPI horizon — neutralizes the short-term technical signal. Until the $80,345 / $84,200 range resolves, the technical read below sits in a fragile equilibrium where the next breakout will decide the next 15-20% move, on either side.
Multi-Timeframe Technical Analysis
Daily Timeframe (1D): Post-Top Distribution Confirmed
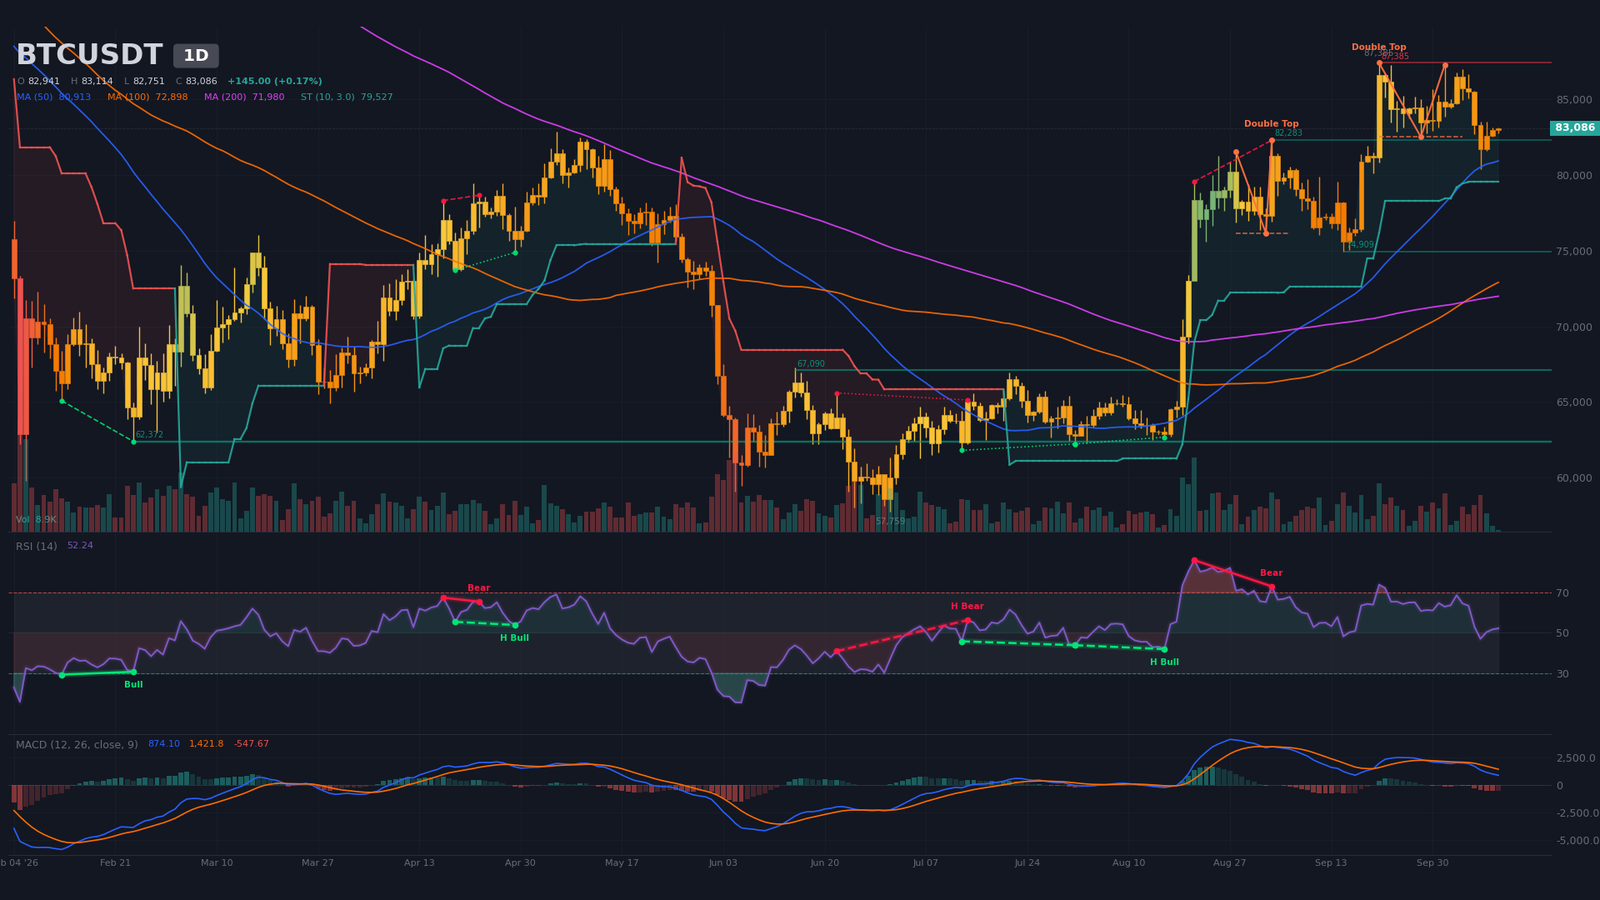
On the daily chart, price at $83,086 trades below the SMA20 ($84,188) but above the SMA50 ($80,913) and SMA200 ($71,980). The SMA50 remains above the SMA200: the golden cross formed on September 8 (33 candles ago) still anchors the medium-term bullish bias, but the loss of the SMA20 signals that short-term buyers have stepped aside. The RSI14 at ~52, in neutral territory, peaked at 68 nine sessions ago before fading — a classic normalization after excess. The historical sequence (63.7 → 68.7 → 64.5 → 63.4 → 52.9 → 47.0 → 50.3 → 51.7 → 52.2) draws a purge then a stabilization; a return above 55 would rekindle buying momentum.
The daily MACD retains a bearish crossover dated September 29 (12 candles ago), with the line below signal and a negative histogram of large amplitude — selling pressure has not yet been absorbed. The current candle’s volume (8,929) represents just 6.4% of the 20-period average (140,093): no conviction, neither buyers nor sellers are committing decisively.
The dominant pattern remains a confirmed bearish double top, formed on the $87,385 high of September 21 and the $87,249 high of October 2, with a neckline at $82,500 and a measured target at $77,683. A second, older pattern (neckline $76,152) targets $70,412 in a cataclysmic scenario. The daily SuperTrend, bullish at $79,527, forms the last rampart before medium-term bias invalidation. The algorithmic regular bearish divergence detected between August 21 ($79,555.5, RSI 86) and September 3 ($82,282.8, RSI 73) continues to haunt the structure: a higher high in price on a lower RSI remains a materialized warning.
Intermediate Dynamics (4H): Compression and Triple Top
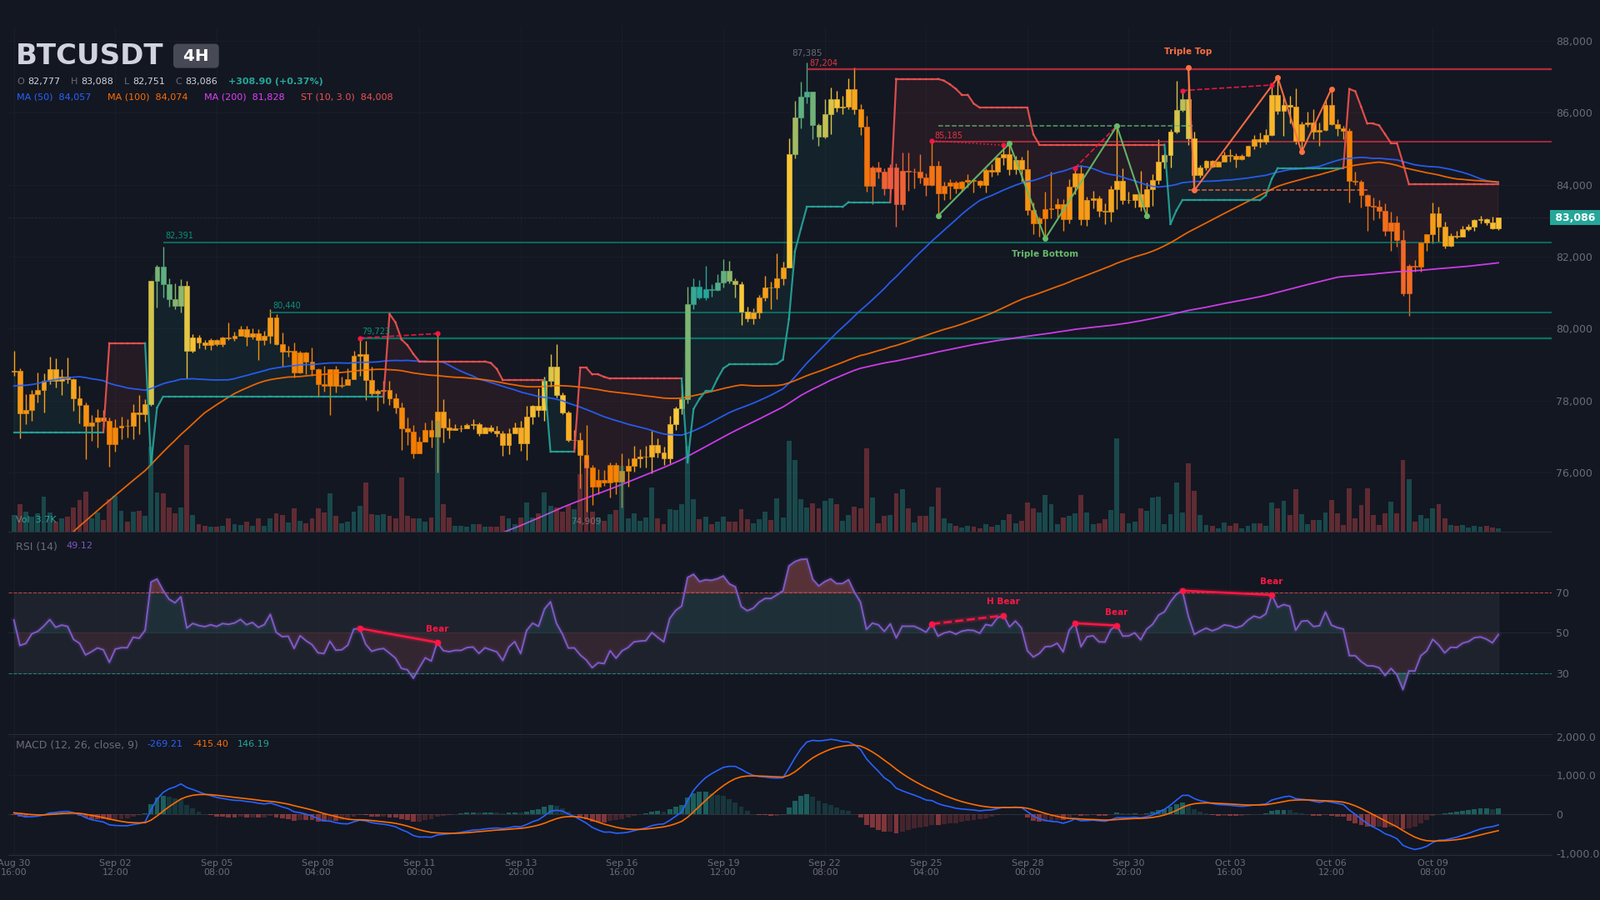
On the H4, price sits in a post-correctional compression structured around $83,000. The SMA20 ($82,575) provides immediate support, but the SMA50 ($84,057) and the SuperTrend ($84,008), now bearish, form a dense resistance zone between $84,000 and $84,200. The SMA200 ($81,828) plays the role of structural floor. The RSI14 at ~49, neutral, just cleared the oversold zone (42.7 eight candles ago) — momentum is bullish but pinned below the 55 activation threshold.
The H4 MACD prints a bullish crossover dated October 9 (10 candles ago) under the zero line, with a positive and expanding histogram. This corrective divergence against falling price provides internal support to the ongoing rebound. The dominant H4 pattern is a confirmed bearish triple top, with neckline at $83,842 and target at $80,720. This setup conflicts openly with a confirmed bullish triple bottom, whose neckline at $85,633 opens a target at $88,343. As long as $83,842 holds as resistance, the bearish pattern remains valid. The algorithm also detected two regular bearish divergences, notably between October 2 and October 4 (price $86,616 → $86,770, RSI 70.9 → 68.8), confirming buyer distrust on rebounds. The recent swing low at $80,345 (October 8, RSI 31.2 — capitulation zone) remains the window floor: mechanically, the longer price stays without breaking $80,345, the less relevant the H4 bearish pattern becomes.
Intraday Structure (15m): Bull Flag in Formation
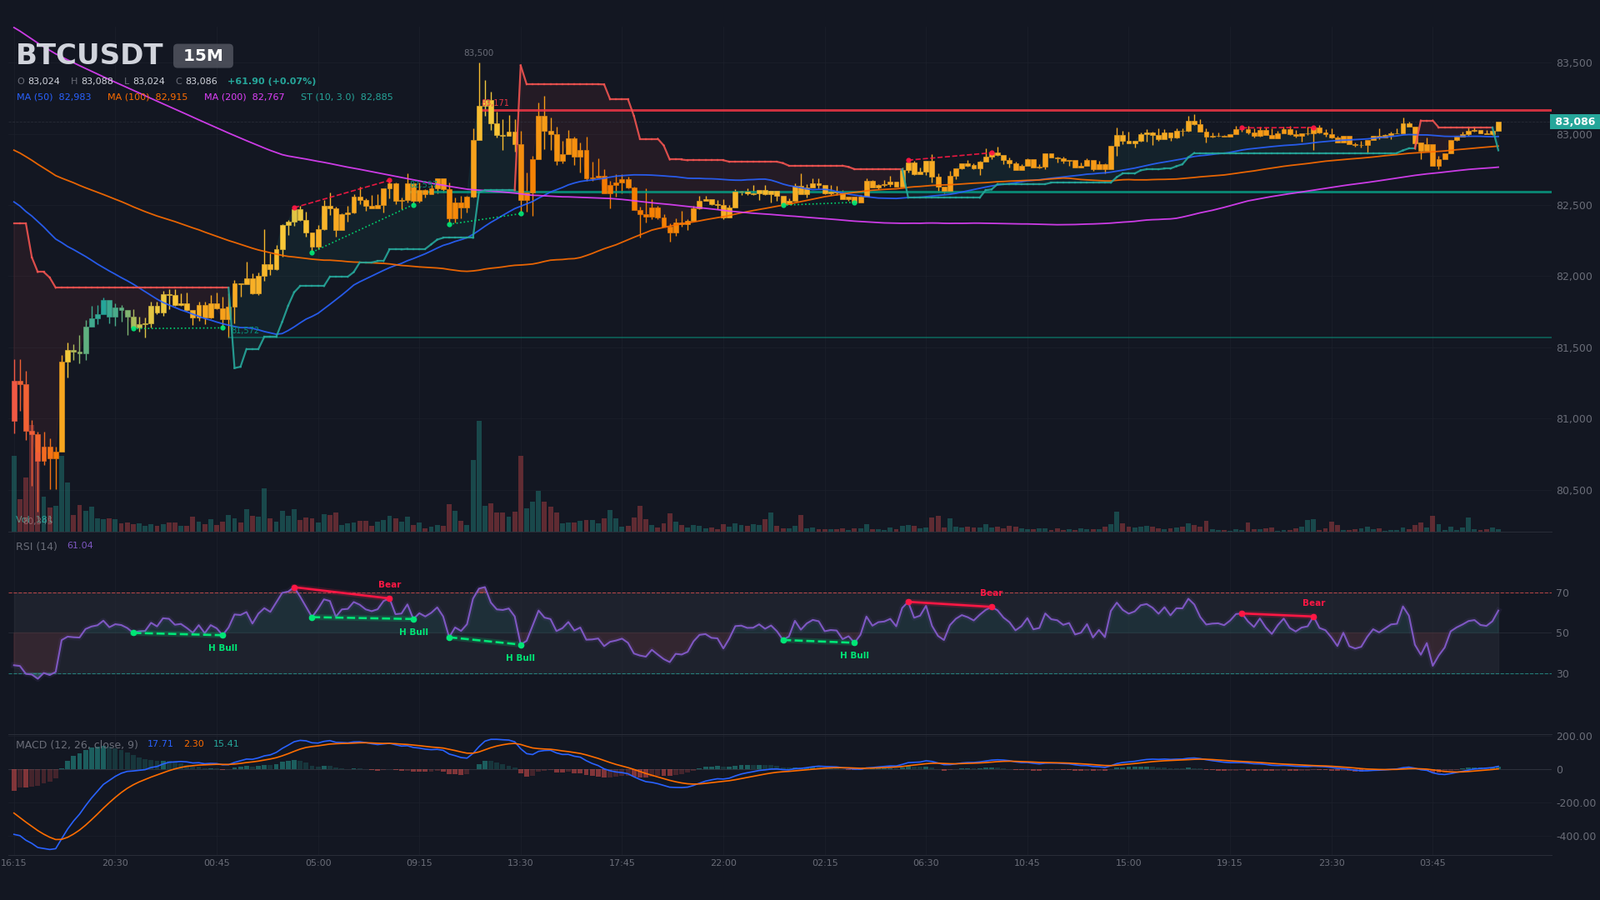
On the 15-minute chart, price has traced an intraday bull flag rebound after the morning low at $82,751 at 04:00 (RSI at 38.8 — intraday oversold). The M15 SuperTrend is bullish at $82,885; the SMA20 ($82,972), SMA50 ($82,982), and SMA200 ($82,767) stack below price. The RSI14 at ~61, neutral-to-bullish, unwound 50.7 → 52.7 → 54.1 → 55.9 → 56.3 → 53.9 → 53.4 → 55.7 → 61.0: consolidation then acceleration. The M15 MACD confirmed a bullish crossover at 05:00 (6 candles ago), with a positive and expanding histogram.
The numerical bounds are precise: immediate support at $82,596.7 (10 touches, -0.59%) and immediate resistance at $83,171.3 (5 touches, +0.10%). A close above $83,171 would open $83,516 then $84,000. The algorithmic regular bearish divergence detected (between 19:45 and 22:45 on October 10, price $83,043 → $83,046 on RSI 59.6 → 58.1) calls for caution, however: hourly highs no longer print rising RSI. Analyst read: a confirmed break of $83,171 would transform the flag into a bullish pole; a failure below $82,596 would confirm the intraday bearish resumption.
Multi-Timeframe Synthesis
| Timeframe | Dominant Trend | RSI (14) | MACD | Chart Pattern |
|---|---|---|---|---|
| Daily (1D) | Bearish (consolidation) | ~52 | Bearish crossover stabilizing | Confirmed bearish double top |
| 4 hours (4H) | Neutral (compression) | ~49 | Bullish crossover below zero | Confirmed bearish triple top |
| 15 minutes | Bullish (flag) | ~61 | Fresh bullish crossover | Bull flag (analyst read) |
The convergence is clear: the structural bias (1D) remains under seller control, the intermediate timeframe (4H) signals a fragile balance between opposing patterns, and the tactical timeframe (15m) confirms a technical rebound but not a directional one. Price only enters a sustained trend at the cost of breaking the $80,345 / $84,200 boundaries.
Technical Levels and Pivot Map
The methodology combines classic daily pivots (base: last complete candle), liquidity concentrations above and below price, detected pattern targets, swing highs and lows, and the SMA50/200 plus daily SuperTrend as structural supports. The short-term central pivot sits in the $83,000 / $83,200 zone.
| Level | Price (USD) | Category | Technical Foundation |
|---|---|---|---|
| R3 | $87,200 – $87,400 | Major resistance | H4 resistance at $87,203.6 (3 touches) + period high $87,385.1 (Sept. 21) + shorts liquidation cluster $87,663 / $87,776 |
| R2 | $85,000 – $85,200 | Major resistance | H4 resistance at $85,185.2 (2 touches) + bullish triple bottom extension ($88,343) |
| R1 | $84,000 – $84,200 | Immediate resistance | H4 SuperTrend ($84,007.7) + daily SMA50 ($84,188.4) |
| P | $83,000 – $83,200 | Central pivot | Daily pivot P ($82,859) + sell wall $83,108.7 / $83,154 |
| S1 | $82,500 – $82,700 | Immediate support | M15 support at $82,596.7 (10 touches) + daily double top neckline $82,500.1 |
| S2 | $80,250 – $80,450 | Major support | Oct. 8 swing low $80,344.8 + H4 support $80,440.4 (2 touches) |
| S3 | $77,500 – $77,800 | Major support | Measured daily double top target $77,682.9 |
Order Book and Liquidity Heatmap
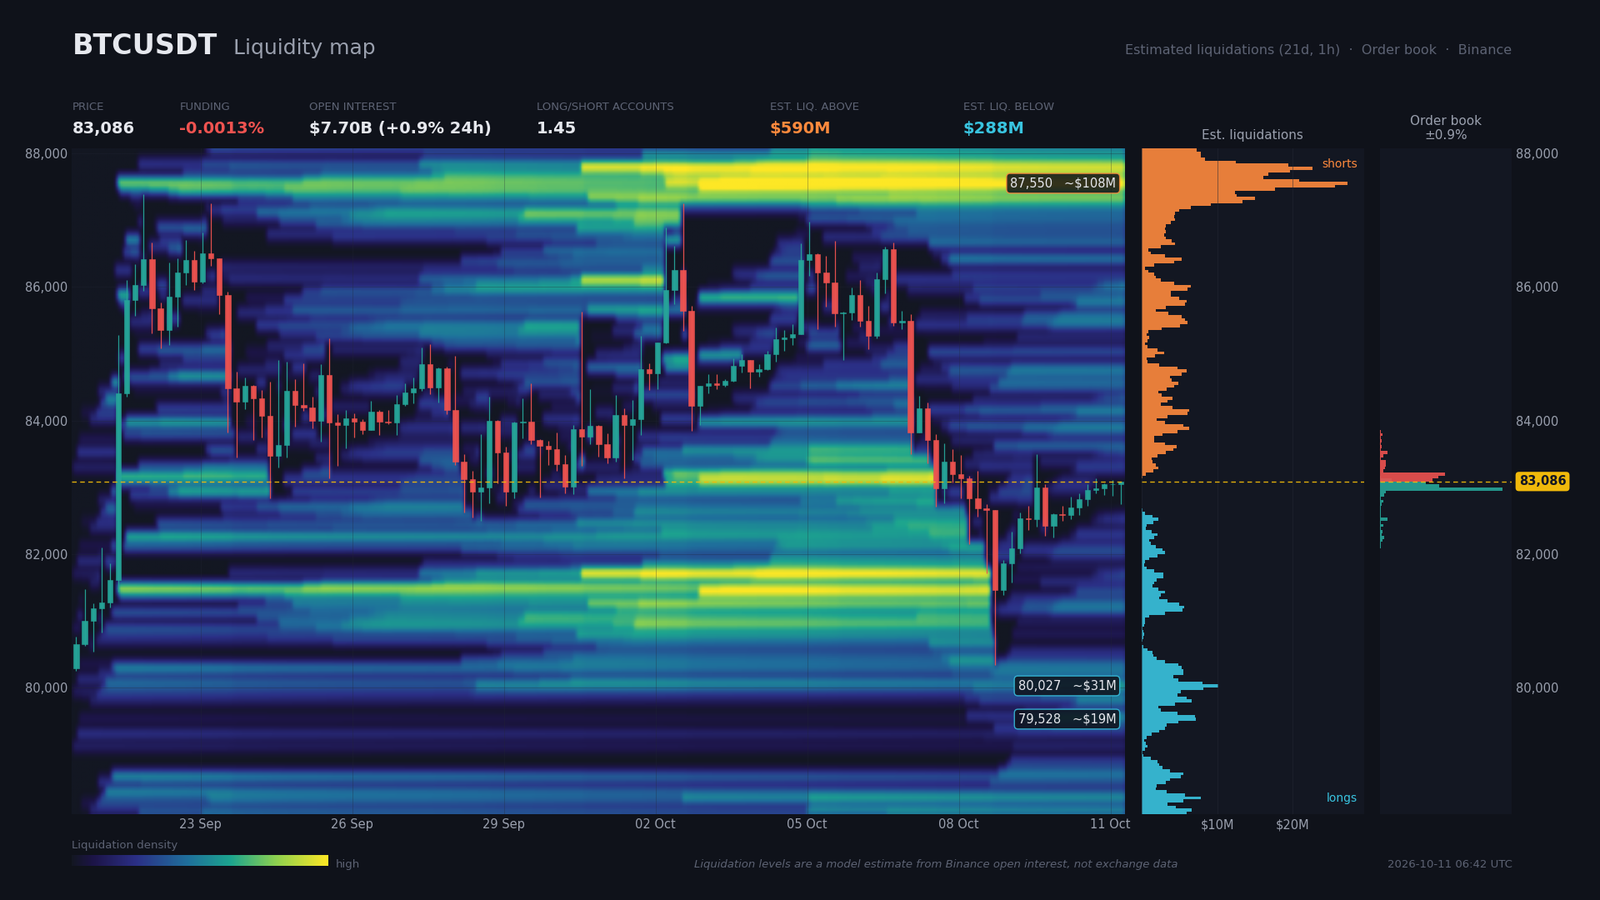
The aggregated Binance order book (0.9% coverage around mid) shows a +13.5% buyer imbalance: $91.6M of bids within ±2% against $69.8M of asks. Buy walls concentrate at $83,063 ($15M), $83,018 ($19M), $82,972 ($40M, the densest), and $82,519 ($2.3M). Sell walls sit higher up: $83,108 ($17M), $83,154 ($19M), $83,199 ($21M), and $83,516 ($2.4M). The imbalance leans buyer, but the $82,972 / $83,018 concentration and the weakness of the wall below $82,600 signal a magnet zone under $83,000: a bearish liquidity sweep before a rebound remains the most probable microstructural hypothesis.
Derivatives confirm this cautious climate. Perpetual funding at -0.0013% (-1.5% annualized) is neutral-to-slightly negative. Open interest at $7.70B rises +0.91% over 24 hours but falls -6.88% over seven days — leverage unwinding still in progress. The long/short ratio remains long-biased: 1.447 on global accounts, 1.525 on top trader accounts (defensive to directional long positioning). The 24h taker buy/sell at 0.894 indicates a slight spot selling pressure over the period.
The estimated liquidation zones (model-based) form the strategic information. Above, $590M of trapped shorts sit between $87,255 and $87,890 (peak at $87,776, +5.65%), with an intermediate band at $87,391 / $87,618: a return to these levels would trigger a violent short squeeze, but the magnet remains more than $4,000 away from spot. Below, $288M of longs sit between $78,100 and $80,095 (peak at $80,027, -3.68%). Sweeping $80,345 would trigger a $311M long cascade — a scenario feared by current buyers. The risk is asymmetric: the downside pocket is narrower; the upside pocket is wider and more profitable.
Calendar: Catalysts to Watch
The macro calendar over the next ten days is dense and dominated by the October 14 U.S. CPI print, the only event capable of breaking price out of the $80,345 / $84,200 range and arbitrating the competing patterns.
- Tuesday, October 13, 16:00 (Zurich) — Existing Home Sales (consensus 3.97; previous -2): indirect read on U.S. credit, moderate risk.
- Wednesday, October 14, 04:10 and 10:30 — ECB Lagarde speeches: possible EUR/USD volatility, limited transmission to BTC absent surprise.
- Wednesday, October 14, 05:00 — CNY Inflation MoM (consensus 1.1; previous 0.4) + trade balance: indirect read on global demand.
- Wednesday, October 14, 14:30 — U.S. CPI m/m (consensus 0.6%) and Core CPI m/m (consensus 2.5; previous 2.4): major catalyst — core ≥ 2.5% would revive the « higher for longer » scenario (risk-negative); a print in line would reassure.
- Thursday, October 15, 14:30 — U.S. Core Retail Sales m/m (consensus 0.3; previous 1.4) and Core PPI m/m (consensus 0.3; previous 0.2): confirmation or invalidation of the CPI signal.
Three Scenarios for the Coming Weeks
The reference horizon runs through the U.S. CPI and the end of the monthly window. Three trajectories stand out, each with identified technical and macroeconomic triggers.
Scenario A — Range Oscillation Between $80,345 and $84,200 (probability 45%)
Catalyst: no surprise in the October 14 CPI (core consensus 2.5% respected) and post-purge stabilization. Trigger: price oscillates between $82,500 (S1) and $84,000 (R1), with no directional breakout. Trajectory: return to $82,750, test of $83,000 then $83,200, microstructural fill of $82,800 / $82,950 in case of sweep. The scenario benefits from leverage unwinding and institutional disinterest while awaiting the next catalyst. Execution zone: accumulation $82,550 – $82,750. Invalidation: H4 close above $84,250 or below $80,250. Stop: 1×H4 ATR ($578) below $81,900. R:R ≥ 2.0.
Scenario B — Bullish Recovery Toward $85,200 / $87,400 (probability 25%)
Catalyst: U.S. core CPI ≤ 2.5% m/m, ETF inflow resumption, taker buy > 1. Trigger: confirmed H4 break of $84,200 (SuperTrend + SMA50); buyer imbalance flips. Trajectory: $84,200 → $85,185 (R2) → $87,200 (R3, $590M shorts liquidations). The short squeeze feeds itself if the level is cleared on a daily close. Execution zone: breakout above $84,250, add on pullback to $83,800. Invalidation: return below $83,200 on a 1D close. Stop: 1×daily ATR ($2,015) below $82,300. R:R ≥ 1.6 toward R3.
Scenario C — Bearish Breakdown Toward $77,700 (probability 30%)
Catalyst: U.S. core CPI > 2.5% m/m, continued ETF outflows, major geopolitical event. Trigger: loss of $80,345 on daily close; break of S2 zone [80,250, 80,450]. Trajectory: $80,345 → $79,722 (H4 S3) → $78,100 (long liquidation pocket $18M) → $77,683 (daily double top target). The long cascade would amplify the decline. Execution zone: sell on failure below $80,800 (re-test of broken support). Invalidation: H4 close above $81,850. Stop: 1×daily ATR ($2,015) above $82,800. R:R ≥ 1.9 toward the $77,683 target.
Synthesis and Conclusion
Bitcoin oscillates in a post-top distribution phase, where bearish chart patterns (daily double top, H4 triple top) and outflowing capital converge, without validating a heavy trend. The September 8 50/200 golden cross still protects the medium-term bias as long as the SMA200 ($71,980) and the SuperTrend ($79,527) hold. The October 8 purge drained leverage (OI -6.88% over 7 days), leaving a disarmed market vulnerable to the next macro catalyst. Price sits within an implicit $80,345 / $84,200 range whose break will decide the next 15-20% move — daily double top target at $77,683 on one side, shorts liquidation pocket at $87,400 on the other.
The bitcoin technical analysis of the week favors selling at resistance and buying at support, with leverage reduction ahead of the October 14 CPI. The major protection level remains a daily close below $80,345, which would constitute the medium-term bearish pivot. The critical levels to watch are: $84,200 (bullish trigger), $82,600 (M15 support), $80,345 (swing floor + liquidation pocket), $87,400 (short squeeze target), and $77,683 (daily double top target).
Sources
- This Sam Altman-Backed Life Insurer Runs Entirely on Bitcoin, and Just Raised $37.5 Million — Decrypt, October 10, 2026
- Ether ETFs extend outflow streak to nine days as Solana funds snap record 14-week inflow run — The Block, October 10, 2026
- Bitcoin Rebounds After Rough Week, But Traders Are Pricing In More Downside — Decrypt, October 9, 2026
- Bitcoin ETFs Shed $729M in Two Days as Investors Reverse Course — Bitcoin Magazine, October 9, 2026
- « We Know Where It is »: Treasury Secretary Threatens To Freeze $1B of Iran’s Crypto — Bitcoin Magazine, October 9, 2026
- US plans to seize $1B in crypto linked to Iran this week: Scott Bessent — Cointelegraph, October 9, 2026
- JPMorgan makes bullish call in fixed income space, suggests it’s a once in a generation opportunity — CNBC, October 10, 2026
- « What you don’t know is greater than anything you do know »: How Ray Dalio would build a portfolio to withstand a popping AI bubble — MarketWatch, October 10, 2026
- Cramer’s week ahead: Earnings kick off as banks and chipmakers face big tests — CNBC, October 10, 2026
- Bitcoin Drops Below $81K, Triggering Nearly $1B Crypto Liquidation Wave: Crypto Stocks Fall With AI Infrastructure Plays — Yahoo Finance, October 8, 2026
- Ethereum ETFs see largest weekly net outflow since January — Crypto Briefing, October 11, 2026
- SEC Targets Crypto Custody Rules in Major Regulatory Shift — Investing.com, October 1, 2026
- French Committee Backs Stablecoin Swap Tax and Crypto Exit Tax, Then Rejects the Budget — Decrypt, October 10, 2026
- Sam Altman-backed Bitcoin life insurer, Meanwhile, raises more funds — Cointelegraph, October 10, 2026
- Blockchain.com Seeks Approval for US Prediction Markets and Crypto Derivatives — Decrypt, October 9, 2026
- Board of Governors of the Federal Reserve System — federalreserve.gov, October 7, 2026
Disclaimer: This article is for educational and informational purposes only. It does not constitute investment advice, a recommendation to buy or sell, or an invitation to trade any financial asset. Cryptocurrency markets are extremely volatile; any investment decision should be based on your own research (DYOR) and, where appropriate, the advice of a licensed financial adviser.

