


Bitcoin trades at $82,510 on October 9, 2026, up 0.98% on the day but down 4.59% over the past five sessions after peaking at $87,385 on September 21. The bounce from the October 8 low of $80,345 has stalled into the $82,640 sell wall. The dominant structure remains bearish: a daily double top and an H4 triple top are confirmed, layered on top of the heaviest spot-ETF outflow since June 25 and a fresh push to 24-year highs in US Treasury yields.
The defining catalyst of the week is the record $487M exit from US spot Bitcoin ETFs on October 7, the largest one-day bleed since June 25, with IBIT (BlackRock) accounting for -$207.7M and FBTC (Fidelity) -$105.1M (Farside Investors). The withdrawal erased roughly 81% of the prior week’s cumulative inflows and accompanied the break below $81,000 flagged by Bitcoin Magazine (October 8, 2026). On the derivatives side, open interest stands at $7.64B, down 3.98% over 24 hours and 10.68% over seven days (AMBCrypto/Coinbase-Deribit integration, October 7, 2026), with a global long/short ratio of 1.816 — long positioning remains elevated but is being unwound. Perpetual funding is moderate at 0.0068% (7.4% annualized), confirming no excess leverage.
The macro backdrop is heavy. US 10- and 30-year yields touched 24-year highs, fueled by AI infrastructure spending and the US-Iran conflict, with Brent crude up roughly 38% since the war began (CNBC, October 8, 2026). Treasury adviser David Zervos described real yields as “really, really high” while arguing they can fall in the near term (CNBC, October 8, 2026). The October 2 NFP report underwhelmed at just 29k jobs vs 90k consensus, unemployment at 4.2% vs 4.1% expected, and average hourly earnings at 0.1% m/m vs 0.3%. The FOMC minutes released October 7 retained a hawkish tilt per wire reports.
Regulatory signals remain mixed. Thailand is finalizing its framework for Bitcoin and Ether ETFs on the Bangkok Stock Exchange, effective October 16 (Cointelegraph, October 9, 2026), Securitize launched 1:1-backed tokenized stocks (Apple, Nvidia, Strategy) on Solana (The Block, October 8, 2026), and Coinbase opened access to Deribit derivatives for US users (Cointelegraph, October 7, 2026). On the other side, Greece is preparing a 15% capital-gains tax on crypto (Bitcoin Magazine, October 8, 2026) and Cantor Fitzgerald is facing a Senate probe over its Tether ties (Cointelegraph, October 9, 2026). The net effect contradicts the short-term bearish technical signal but validates medium-term caution: ETF pressure and rising real yields sustain the consolidation, while the regulatory pipeline keeps a structural demand floor in place. That tension sets the frame for the multi-timeframe technical analysis that follows, in which every horizon must be read through the lens of the October 14 US CPI print.
Multi-Timeframe Technical Analysis
Daily Timeframe (1D): Confirmed Double Top, Selling Pressure Building
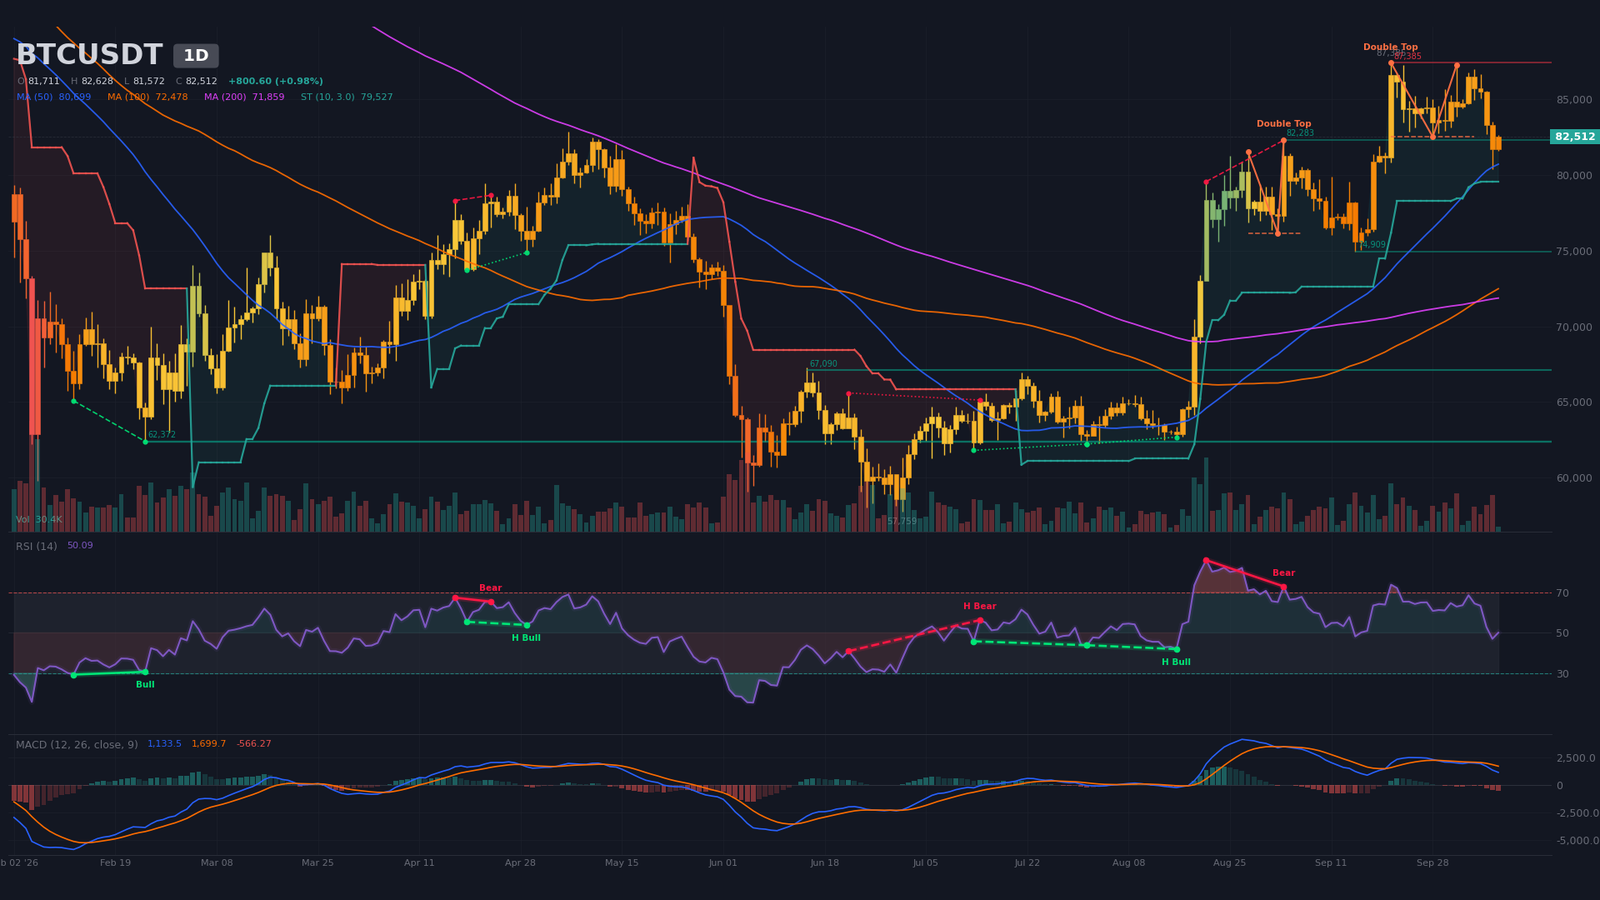
The daily chart prints a confirmed bearish double top, with a neckline at $82,500.1 anchored to the September 28 candle (RSI 60.86) and an algorithmic target at $77,683. Price trades below the SMA20 ($84,270) but above the SMA50 ($80,699) and SMA200 ($71,859). The SMA50/SMA200 golden cross dated September 8, 2026 remains the structural backbone of the long-term trend, but it is now being challenged by a MACD bearish crossover dated September 29 (ten candles ago) with a widening negative histogram: selling pressure is intensifying.
The 14-period RSI sits neutral at 50.09, but a regular bearish divergence is flagged between August 21 (price $79,555, RSI 86) and September 3 (price $82,283, RSI 72.99) — the precursor signal to the double top. Current candle volume is at 21.5% of the 20-period average, a clear sign of no conviction behind the bounce. The daily SuperTrend remains bullish at $79,527, only -3.6% below spot, the single clearly bullish element on this horizon. As long as the daily SMA50 holds at $80,699, the consolidation is corrective; a break would open the path to the $77,683 target and convert the pattern into a confirmed downtrend.
Intermediate Dynamics (4H): Bearish Triple Top and Falling Wedge Compression
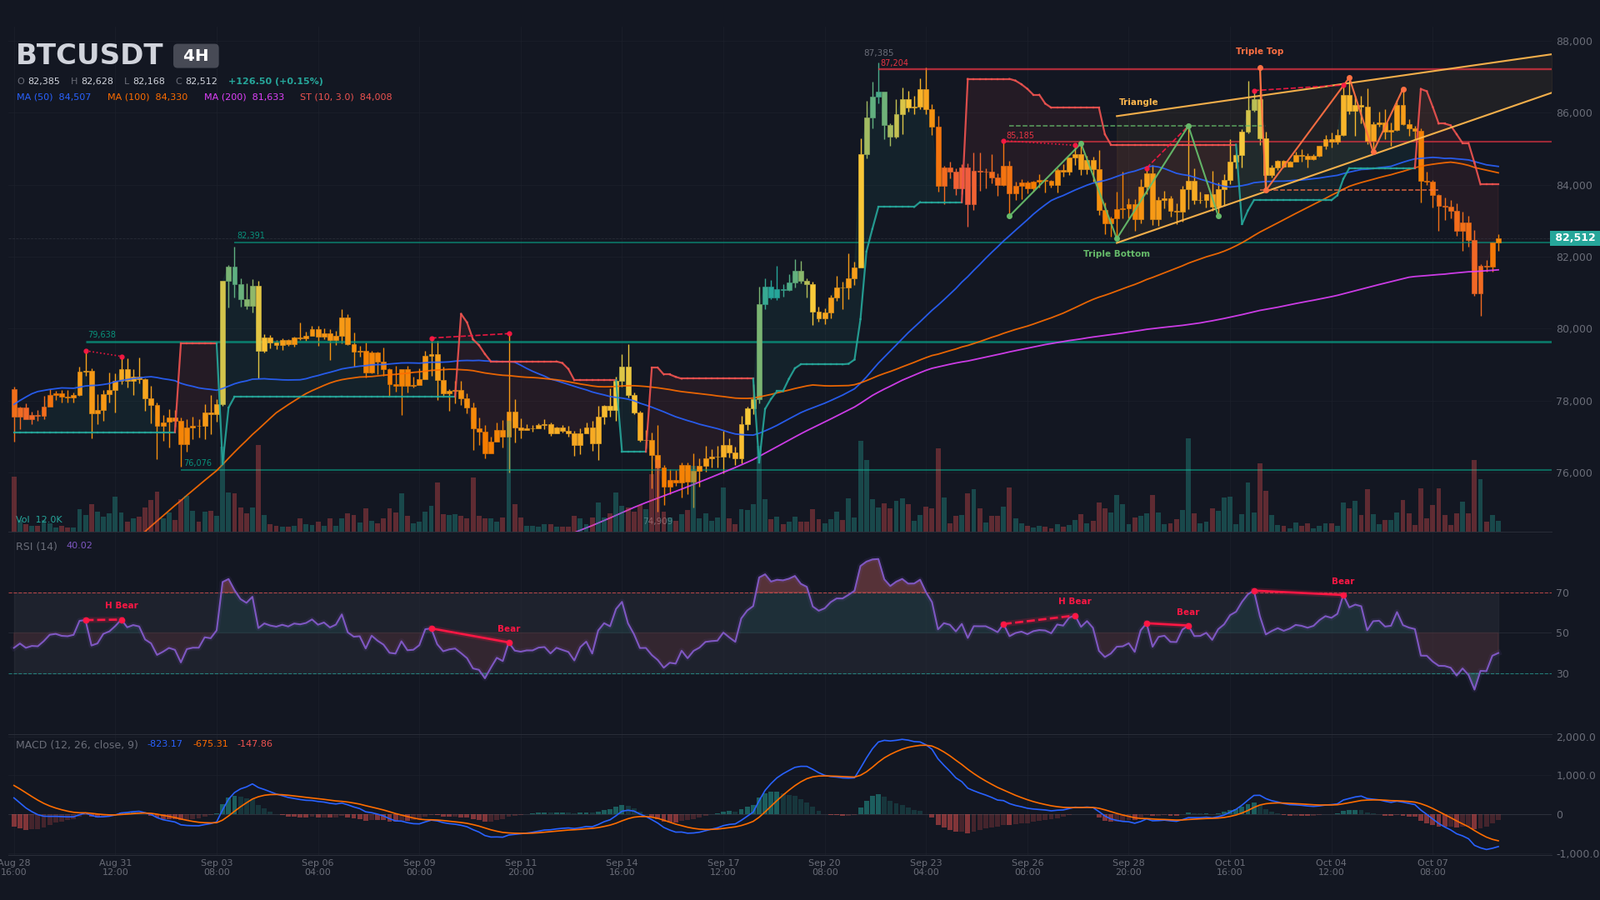
On the 4-hour chart, the dominant pattern is a confirmed bearish triple top, with a neckline at $83,841.9 and a target of $80,720 that is nearly reached. A descending wedge complements the structure between $85,128 and $87,037, with an apex estimated for October 15, 2026 at 22:59 — the same day as the US PPI release. Price sits below the SMA20 ($83,671) and SMA50 ($84,507), above the SMA200 ($81,633). The 4H MACD is below zero with a bearish crossover dated October 6, 2026 (19 candles), histogram in expansion to the downside.
The RSI14 at 40.02 and the prior sequence (21.89, 29.12, 28.86, 32.73) show a fading bounce. Two regular bearish RSI divergences are detected: October 2-4 (price $86,616→$86,770, RSI 70.93→68.76) and September 29-30 ($84,465→$85,633, RSI 54.77→53.64). The 4H SuperTrend has flipped bearish at $84,007. The triple top dominates and puts the focus on a break of $80,720, which would validate the target and expose the H4 SMA200 at $81,633 before the long-liquidation pool at $79,970-$80,120.
Intraday Structure (15m): Technical Bounce Inside a Resolved Triangle
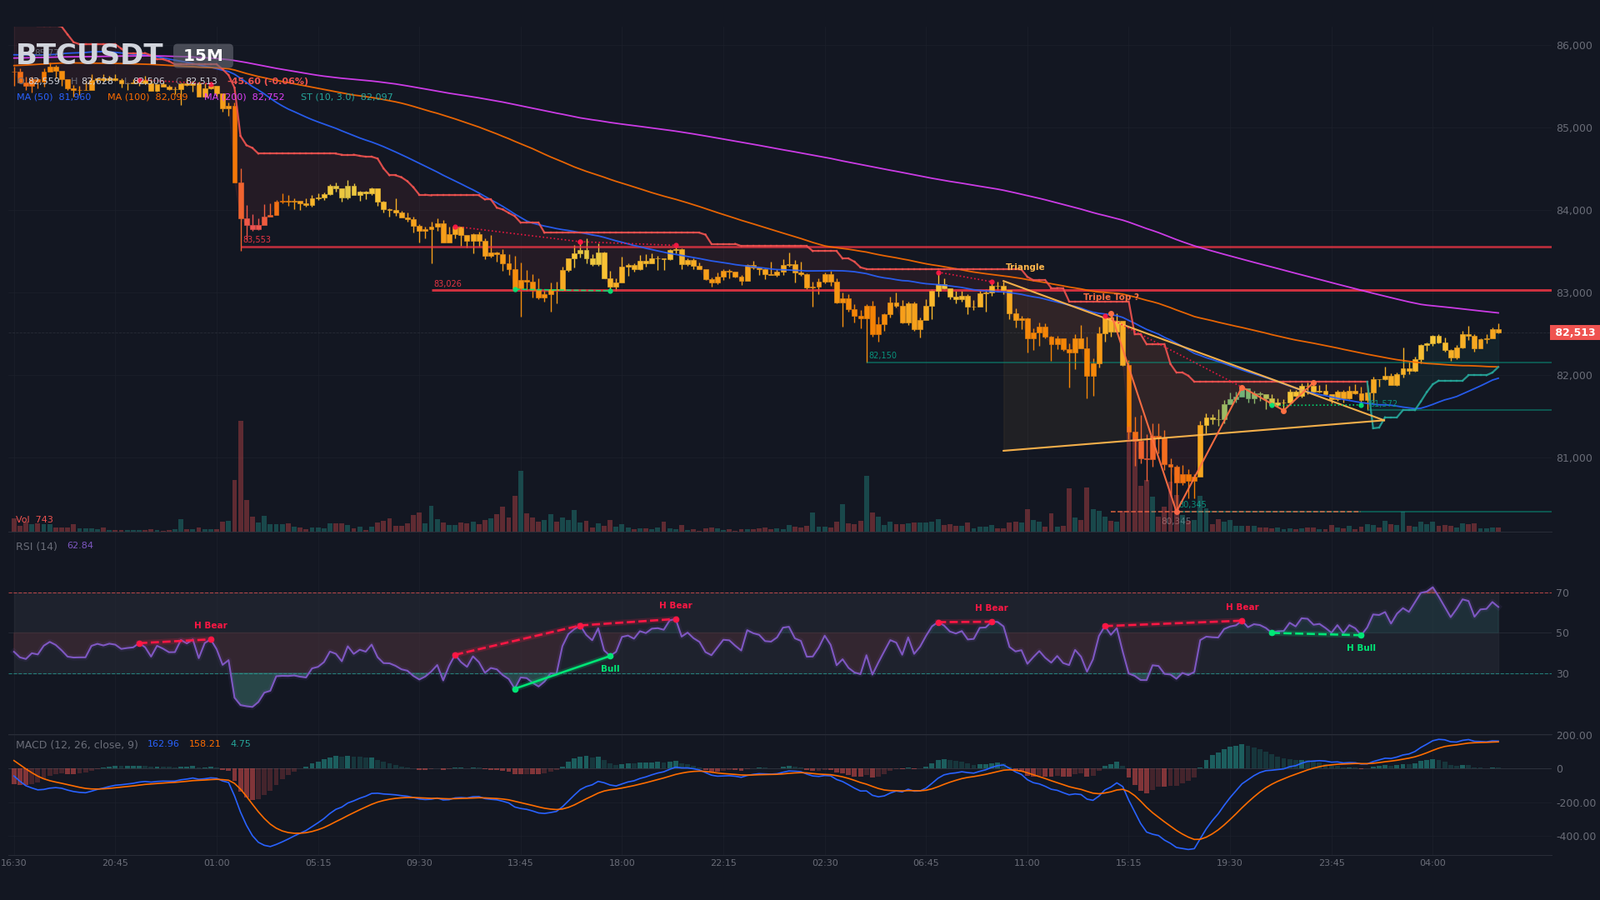
The 15-minute chart shows a post-trough technical bounce: price at $82,513 rebounded from the period low of $80,345 set on October 8 at 17:15. An unconfirmed triple top (neckline $80,345, target $78,519) remains hypothetical absent a clean break. A symmetrical triangle was detected between $81,435 and $81,526, but its apex at October 9 01:45 has already passed: the compression resolved to the upside.
The RSI14 is back above 60 at 62.84 with a bullish MACD (crossover October 9 01:30, 21 candles), histogram positive. The M15 SuperTrend is bullish at $82,097. The intraday levels are: support $82,097 (M15 SuperTrend), immediate resistance $82,640 (sell wall), strong resistance $83,026 (pattern), range $80,345-$83,050. The M15 offers a tactically supportive frame for the bounce, but it cannot escape daily/H4 pressure without an external catalyst — precisely what the October 14 CPI print may deliver.
Multi-Timeframe Synthesis
| Timeframe | Dominant trend | RSI (14) | MACD | Chart pattern |
|---|---|---|---|---|
| Daily (1D) | Bearish (double top) | ~50 | Bearish crossover, histogram expanding | Confirmed double top |
| 4 hours (4H) | Bearish (triple top) | ~40 | Below zero, bearish crossover | Triple top + falling wedge |
| 15 minutes | Bullish (bounce) | ~63 | Above zero, bullish crossover | Symmetrical triangle (resolved) |
Mapping of Technical Levels and Pivots
The methodology combines classic daily pivots, H4/Daily swings, SuperTrend readings, chart pattern targets, Binance order book walls, and estimated liquidation zones. The short-term central pivot sits in the $82,100-$82,700 zone, dense with orders and backed by the M15 SuperTrend ($82,097) and the heaviest bid walls. The table below ranks the decisive thresholds from major resistance (R3) down to deep support (S3), each tied to its technical foundation.
| Level | Price (USD) | Category | Technical basis |
|---|---|---|---|
| R3 | 87,250 – 87,800 | Major resistance | Estimated short-liquidation pocket (~$550M) + Sept 21 high ($87,385) |
| R2 | 85,100 – 85,700 | Major resistance | Upper bound of H4 wedge ($87,037) and H4 SMA50 ($84,507) |
| R1 | 83,800 – 84,000 | Immediate resistance | H4 triple top neckline ($83,842) and bearish H4 SuperTrend ($84,008) |
| P | 82,100 – 82,700 | Central pivot | M15 SuperTrend zone ($82,097) + bid walls $82,387-$82,488 ($45.6M) |
| S1 | 80,700 – 81,200 | Immediate support | Daily SMA50 ($80,699) and bullish daily SuperTrend ($79,527) |
| S2 | 79,970 – 80,120 | Major support | Estimated long-liquidation pocket (~$28M) |
| S3 | 77,700 – 78,100 | Major support | Estimated long-liquidation pocket (~$74M) + daily double-top target ($77,683) |
Order Book and Liquidity Heatmap
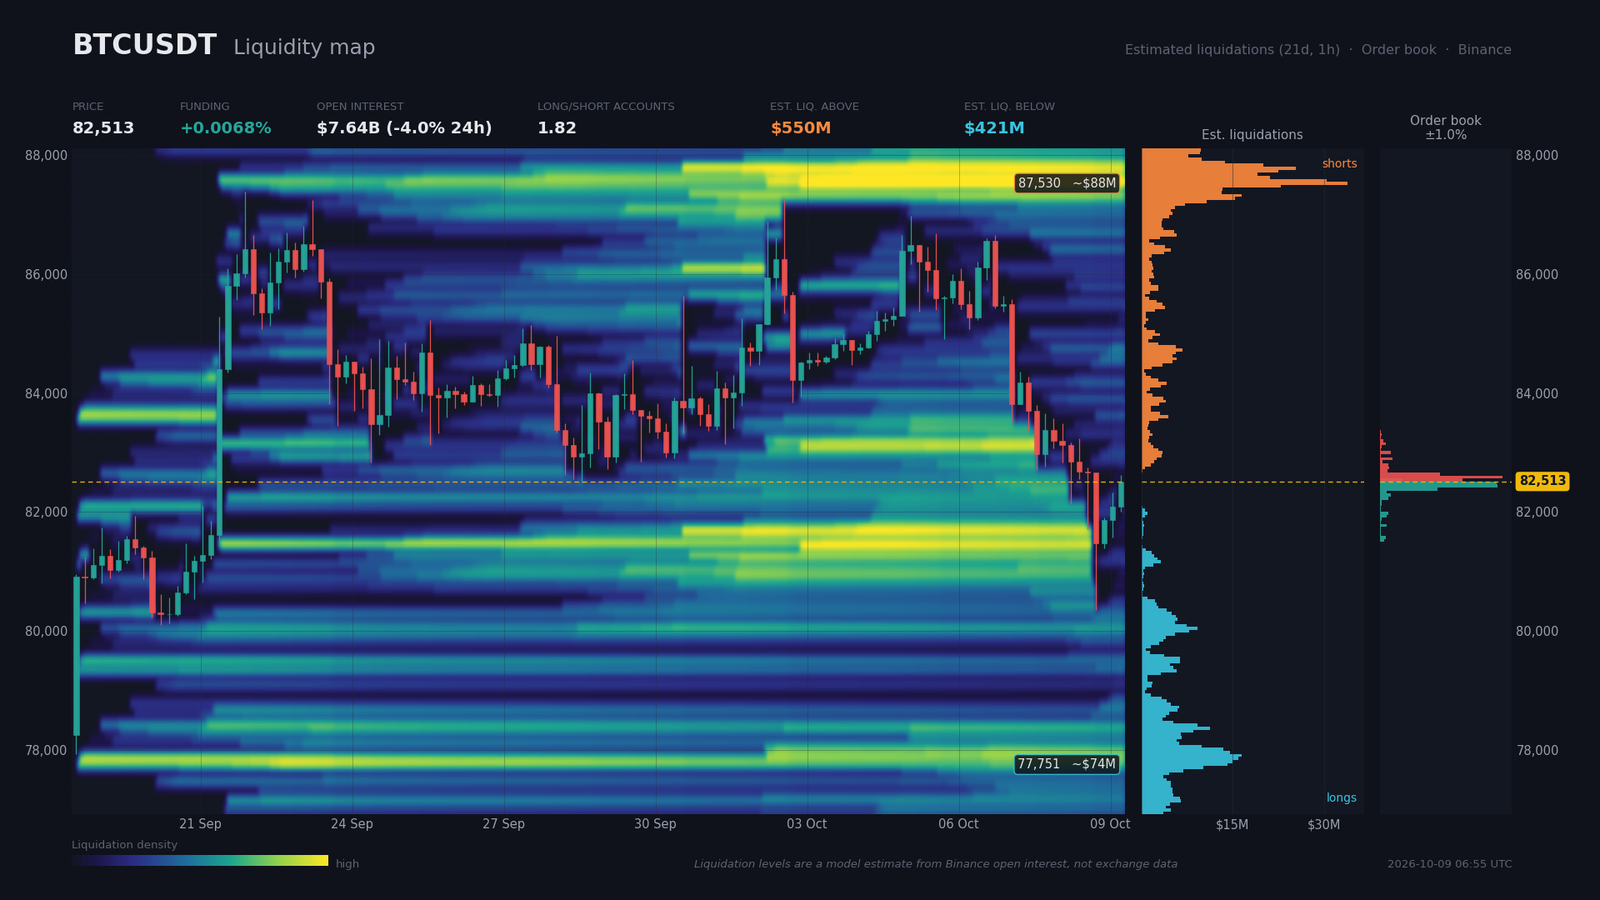
The Binance order book, on a 1% coverage around price (about $830 on each side of spot), shows a 7.1% buy-side imbalance with $73.2M of bids against $63.6M of asks. The densest bid walls sit at $82,436 ($22.8M) and $82,488 ($22.8M); the densest ask walls at $82,589 ($23.8M) and $82,539 ($16.0M). This configuration sketches an immediate floor around $82,400 and a short-term ceiling at $82,640.
The estimated liquidation pockets (open interest model on 1h over 20.8 days, 5x-100x leverage) draw a bearish magnet: $550M of shorts sit above between $87,250 and $87,810 (6.08-6.39% from price), and $421M of longs below — including $74M between $77,725-$78,081 (5.77%) and $28M between $79,966-$80,119 (3.0%). The ratio is asymmetric, favoring a bullish squeeze should price clear $87,300, but the proximity of the long pockets (3% from price) keeps a downside liquidity sweep toward $79,970-$80,120 as the more immediate scenario.
Moderate funding at 0.0068% (7.4% annualized) confirms no excess; the 10.68% drop in open interest over seven days signals progressive de-leveraging that lowers the risk of a cascade. A global long/short ratio of 1.816 vs 1.597 for top traders shows retail more net-long than professionals — a configuration skewed toward a bearish squeeze.
Calendar: Catalysts to Watch
The macro calendar over the next ten days will hinge on US inflation, the only real trigger capable of pulling Bitcoin out of its $80,700-$84,000 structure. The high-impact events to monitor are listed below.
- Fri. Oct. 9, 16:00 (Zurich) — UoM Consumer Sentiment (preliminary): consensus 47.6, previous 48.1. Watched for the inflation signal.
- Wed. Oct. 14, 14:30 (Zurich) — US CPI m/m: previous 0.3%. Major catalyst; a soft print would lift risk, a hot print would push back rate-cut bets.
- Wed. Oct. 14, 14:30 (Zurich) — Core Inflation Rate m/m: previous 0.3%. Fed focal point, extends the CPI signal.
- Thu. Oct. 15, 14:30 (Zurich) — PPI m/m: previous 0.4%. Extends the CPI signal in case of a surprise.
- Thu. Oct. 15, 14:30 (Zurich) — Retail Sales Control Group m/m: previous 1.4%. Gauge of US consumption.
- Wed. Oct. 14, 03:30-05:00 (Zurich) — China inflation, exports, trade balance. Risk of spillover into Asian risk assets.
Three Scenarios for the Coming Weeks
The technical read breaks down into three paths, weighted by the probability that the October 14 CPI breaks the current compression, each with quantified targets and execution zones.
Scenario A — Rejection Below Resistance and Break of $80,700 Toward $77,700 (probability 55%)
Catalyst: Hawkish US CPI on October 14 (>0.3% m/m core). Trigger: H4 break below $80,720 (triple top target). Path: $80,700 → $79,970-$80,120 (long-liquidation pool, $28M) → $78,500 → $77,700-$78,100 (pool $74M + daily double-top target at $77,683). Execution zone: $80,700-$80,800. Invalidation: daily close above $83,850 (H4 neckline). Stop: $83,850 (1×ATR14 daily = $2,195 above), R:R ≈ 1.7.
Scenario B — Range $80,700-$84,000 With Upside Resolution (probability 30%)
Catalyst: US CPI in line or dovish, return of ETF inflows. Trigger: H4 break above $84,008 (SuperTrend) and re-entry of the daily SMA20 ($84,270). Path: $82,500 → $84,000 → $85,100-$85,700 (wedge) → $87,250-$87,800 (short pool $550M). Execution zone: $82,100-$82,500. Invalidation: daily break below $80,345 (October 8 low). Stop: $80,345, R:R ≈ 2.4.
Scenario C — Immediate Bullish Squeeze Toward $87,800 (probability 15%)
Catalyst: Major regulatory news (US ETF approval, CLARITY Act validation) or short squeeze on the $87,250-$87,800 pool. Trigger: H4 break above $85,700 on volume. Path: $84,000 → $85,700 → $87,800. Execution zone: retest $83,000-$83,400. Invalidation: return below $82,100. Stop: $82,000 (1×ATR14 H4 = $850), R:R ≈ 1.8.
Synthesis and Conclusion
Bitcoin remains in a post-peak distribution phase: the daily double top and H4 triple top argue for caution, but the M15 and the short-term order book (buy-side imbalance, walls at $82,400) support a limited technical bounce. The -10.68% drop in open interest over seven days lowers the probability of a liquidation cascade, but the $74M pocket at $77,725-$78,081 remains the bearish magnet until price reclaims $84,000.
The dominant technical strategy is to sell rallies into $84,000-$84,300 with a stop above $84,850 on a daily close, targeting first $80,700-$80,800 then $77,700-$78,100. Alternatively, a long setup can be considered on a validated break above $84,350 toward $85,700 then $87,300. The critical levels to monitor remain $84,008 (H4 SuperTrend), $82,100 (M15 SuperTrend / pivot), $80,700 (daily SMA50), $79,970 (liquidation pocket), and $77,700 (double-top target).
Sources
- Crypto projects apply for Anthropic’s new frontier AI security scanner — Cointelegraph, 9 octobre 2026
- Thailand finalizes rules paving way for Bitcoin, Ether ETFs — Cointelegraph, 9 octobre 2026
- AI Coding Agents Drive Surge in Bitcoin Integration Requests: Breez — Bitcoin Magazine, 8 octobre 2026
- WhiteBIT Integrates Lightning Network for Fast and Cheap Bitcoin Transactions — Bitcoin Magazine, 8 octobre 2026
- Satoshi-Era Bitcoin Worth $8.3 Million Moves After 16 Years — Decrypt, 8 octobre 2026
- Bitcoin ETFs Suffer Worst Loss Since June as Uptober Turns Red — Decrypt, 8 octobre 2026
- Strategy shareholders face dilution drag despite brighter bitcoin forecasts, TD Cowen says — The Block, 8 octobre 2026
- Bitcoin Falls Below $81,000 as Oil Spikes, Fed Talks Tough — Bitcoin Magazine, 8 octobre 2026
- Treasury yields are ‘really, really high,’ but can come down soon — CNBC, 8 octobre 2026
- Dollar gets lift from higher yields — Reuters, 1er octobre 2026
- Tokenization could unleash tens of billions of dollars in trapped capital, Nasdaq CEO says — CNBC, 9 octobre 2026
- Bitcoin ETF Flow (US$m) – Farside Investors — Farside, date non précisée
- Bitcoin ETFs Shed $487M, Every Fund Sees Outflows — Altcoin Buzz, 8 octobre 2026
- SEC Targets Crypto Custody Rules in Major Regulatory Shift — Investing.com, 2 octobre 2026
- How SKY crypto’s 12% price drop raises the risk of further losses — AMBCrypto, 8 octobre 2026
- Bitcoin drops to $84k sees $143 million in liquidations as ETF inflows turn positive — CryptoSlate, 7 octobre 2026
- New data shows Starbucks turnaround is working, but Chipotle takeover report slams shares — CNBC, 8 octobre 2026
- Cantor Fitzgerald faces Senate Democrat’s probe over Tether ties — Cointelegraph, 9 octobre 2026
- Greece Plans Crypto Capital Gains Tax: Report — Bitcoin Magazine, 8 octobre 2026
- China’s P2P stablecoin wallets surge 43x, Korea’s $450B crypto economy: Asia Express — Cointelegraph, 9 octobre 2026
- Securitize launches 1:1-backed tokenized stocks on Solana — The Block, 8 octobre 2026
- Coinbase brings global crypto derivatives liquidity to US with Deribit integration — Cointelegraph, 7 octobre 2026
Disclaimer: This article is for educational and informational purposes only. It does not constitute investment advice, a recommendation to buy or sell, or an invitation to trade any financial asset. Cryptocurrency markets are extremely volatile; any investment decision should be based on your own research (DYOR) and, where appropriate, the advice of a licensed financial adviser.

