


Bitcoin trades at $82,588 on October 8, 2026, off 0.83% on the day and 2.51% over five sessions, having printed a swing high at $87,385 on September 21, 2026. The sell-off from that ceiling has dragged price below the 20-day SMA at $84,249, even though the primary structure remains bullish: spot still holds above the 50-day SMA at $80,526 and the 200-day SMA at $71,805. The current phase is a slow distribution, the kind of tape that probes weak longs before committing to the next leg.
The session’s dominant driver is the derivatives and macro shock. According to Decrypt on October 7, 2026, roughly $969M in crypto positions were liquidated over 24 hours after Brent broke $101 a barrel and the US 10-year yield touched 5.34%, with the 30-year hitting 5.70%, the highest since 2002. Binance perpetual funding slid to -0.0008%, annualized -0.9%, the first negative print since mid-September, while open interest fell 2.18% over 24 hours to $7.96B. Positions are being unwound on the sell side.
On the macro side, the minutes of the September 15-16 FOMC meeting, published by the Federal Reserve on October 7, 2026, confirm that another rate hike is likely before year-end, with 76% implied probability on Kalshi. The October 2 NFP (29K vs 90K consensus, unemployment 4.2%) reinforced the stagflation template. Decrypt reported on October 7, 2026 that the US government moved $103.2M of seized crypto, including 833.6 BTC, to Coinbase Prime-linked addresses — no sale confirmed but the bearish risk premium persists. Conversely, the 2026 Charles Schwab survey (Bitcoin Magazine, October 7, 2026) shows six in ten crypto investors plan to increase their exposure over 12 months, a structural demand signal that partially offsets near-term selling pressure. The SEC also proposed on October 1, 2026 a crypto custody framework (60-day comment period). Institutional plumbing keeps improving (Grayscale Zcash ETF above $1B AUM in 30 days, Coinbase-Deribit bridge).
This combination of a high opportunity cost on risk assets, a structurally long positioning that has become vulnerable, and a dormant government supply dictates a cautious technical read. The Bitcoin technical analysis that follows attempts to determine whether the breakdown of the $85,000-$87,250 range is the start of a deep correction or simply a flush before the next leg higher.
Multi-Timeframe Technical Analysis
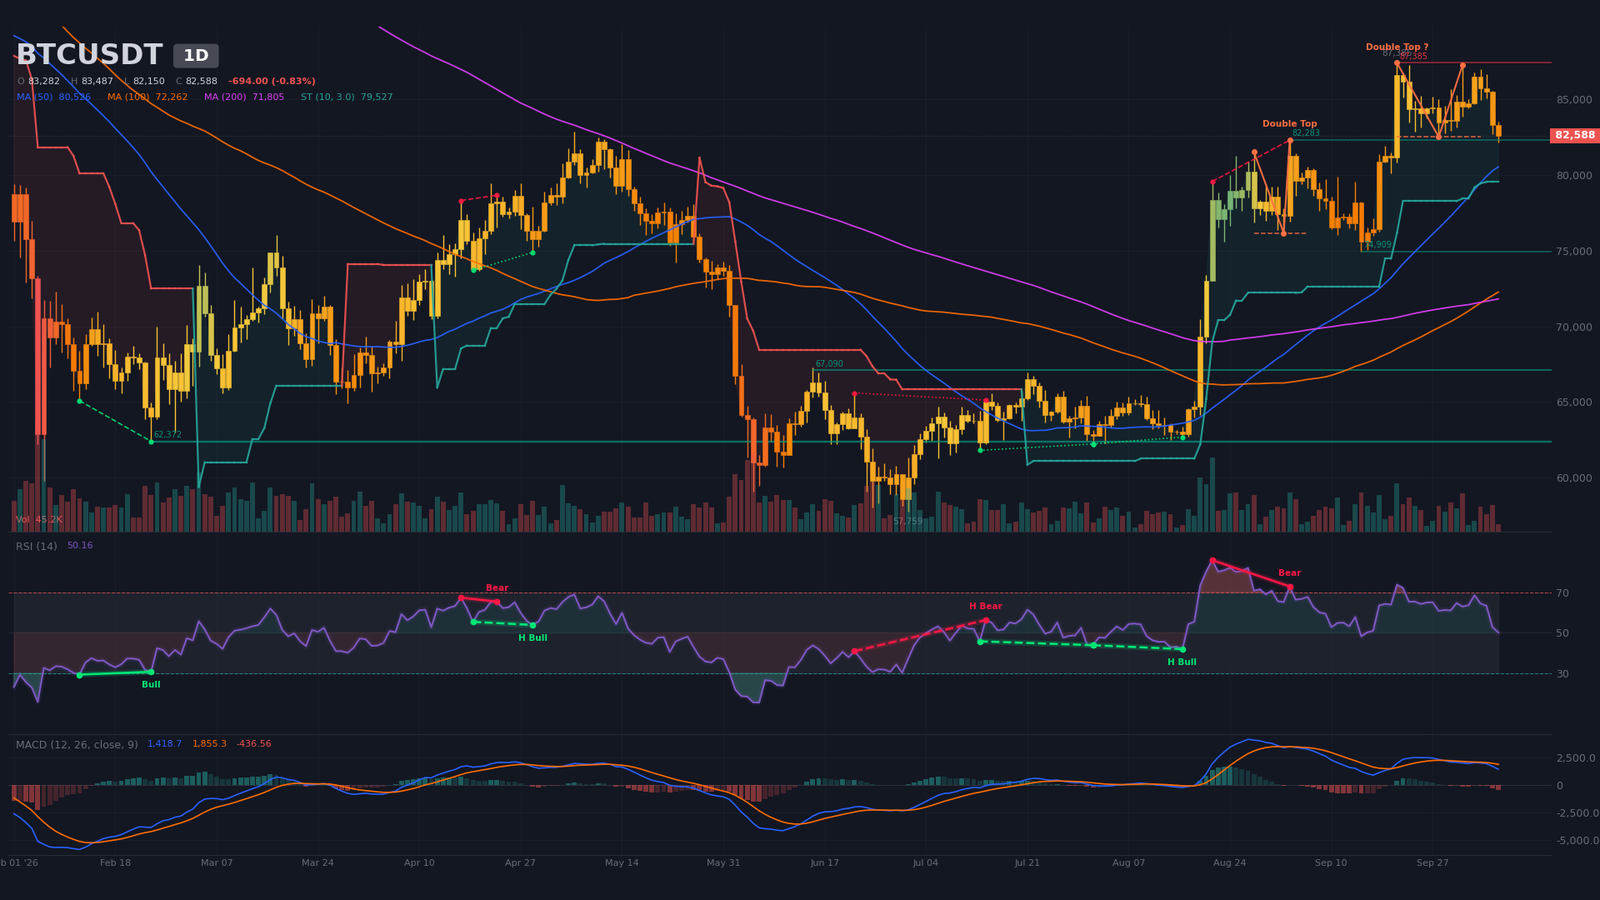
Daily Timeframe (1D): Double Top Forming Under Resistance
The dominant daily structure is an unconfirmed double top, neckline at $82,500, with the last pivot on October 2, 2026 and an algorithmic target at $77,683. Price trades below the 20-day SMA ($84,249) while remaining above the 50-day SMA ($80,526) and the 200-day SMA ($71,805). The bullish 50/200 cross from September 8, 2026 (30 candles ago) remains the structural bedrock of the primary bias. The daily SuperTrend stays bullish at $79,527, suggesting the underlying trend has not been invalidated but that bearish pressure is building.
MACD crossed below its signal on September 29, 2026 (9 candles); the line itself remains above zero and the negative histogram is expanding — a configuration consistent with bullish momentum exhausting without structural breakdown. RSI14 at 50 is neutral; it sat at 64 eight sessions ago, a sequence that flattens out from the highs without printing a bearish divergence on this timeframe. The October 8 candle volume (45,210) runs at only 32% of the 20-period average, a sign of a pullback without excessive selling conviction.
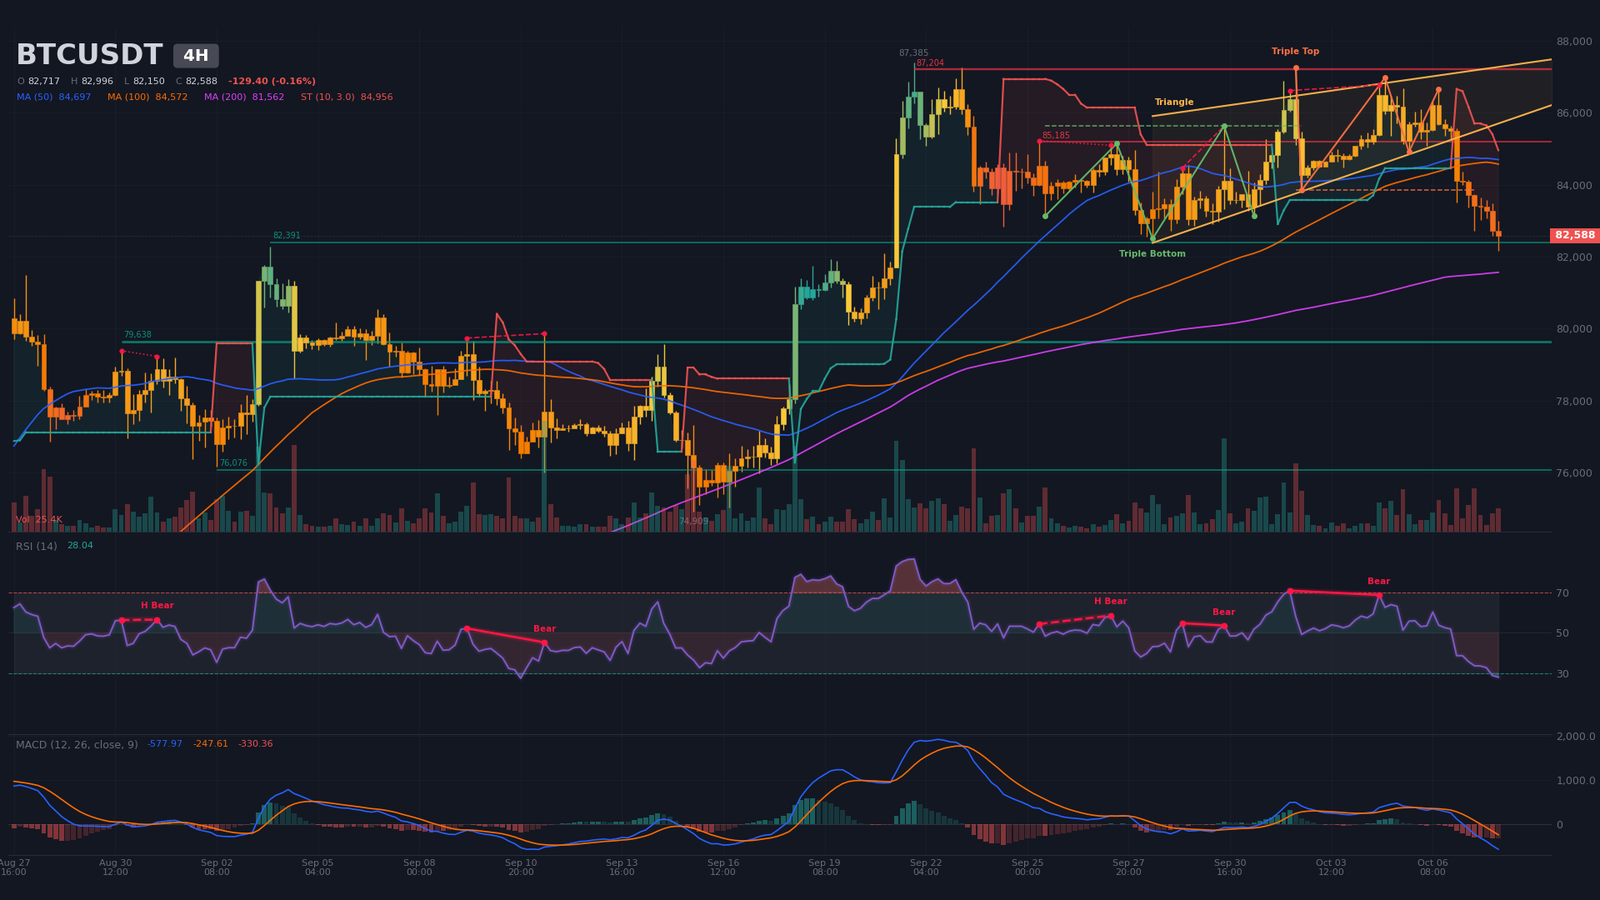
Intermediate Dynamics (4H): Triple Top Confirmed and Oversold
The 4-hour chart confirms a bearish triple top, neckline at $83,842, with an algorithmic target at $80,720. A descending wedge formed between $87,037 (upper bound) and $85,128 (lower bound), apex estimated for October 15, 2026. Price has broken below the 20-period SMA ($84,816) and the 50-period SMA ($84,697), holding only the 200-period SMA at $81,562. The 4H SuperTrend flipped bearish at $84,956, validating the invalidation of the $85,000-$87,250 range.
RSI14 at 28 marks an oversold state; the eight prior readings (32-52) show a linear deterioration without a reversal signal. MACD crossed below zero on October 6, 2026 (13 candles) with an expanding histogram. No bullish divergence is detected on this timeframe. The volume-to-20-period average ratio sits at 106%, confirming selling pressure. The picture validates a short-term bearish reversal; price is currently testing the psychological $82,500 level and the 4H 200-period SMA support at $81,562.
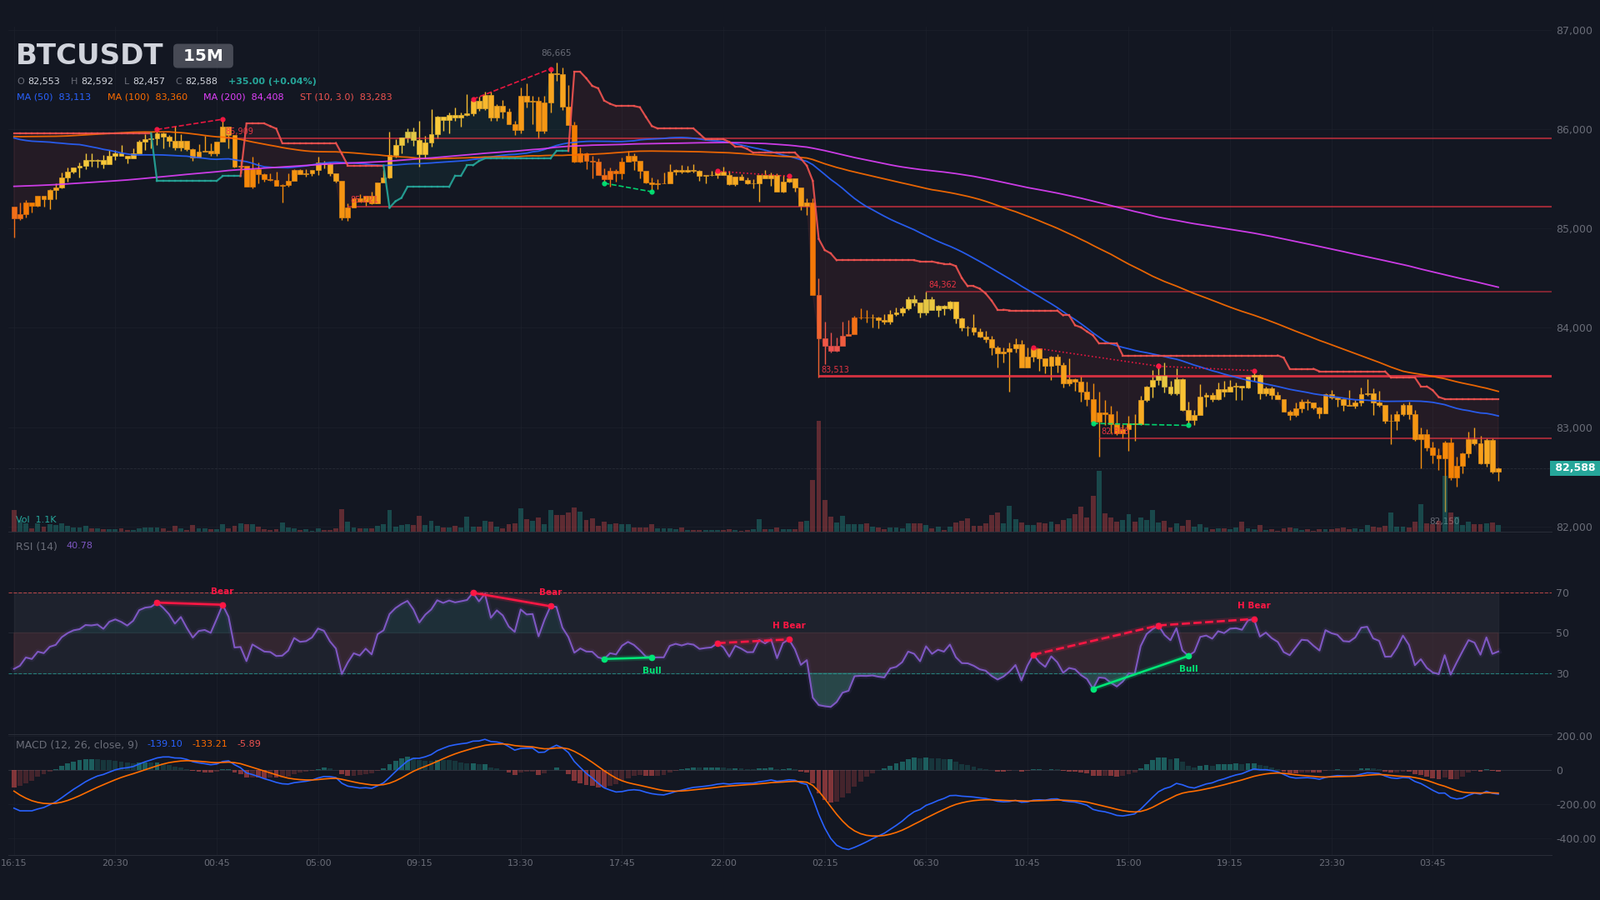
Intraday Structure (15m): Consolidation Below SuperTrend
On the 15-minute chart, price consolidates bearishly below the SuperTrend ($83,283) and below the 50-period SMA ($83,113). RSI14 at 41 is neutral after touching 29 in oversold territory on October 8 at 04:30 — a configuration that implies a hidden bullish divergence (stable price lows, rising RSI). MACD just crossed below its signal (October 8 06:15), with a slightly negative histogram. Volume sits at 54% of the 20-period average, typical of an absorption phase.
Intraday bounds: support $82,400-$82,500 (S1 M15 and 4H pivots) and resistance $82,780-$82,880 (R1 M15, first seller wall at $82,691 for $30.4M). This 15-minute snapshot will be decisive: a confirmed break of $82,880 opens the door to a technical relief bounce toward $83,800, whereas a break of $82,400 would reignite the bearish sweep scenario documented below.
Multi-Timeframe Synthesis
| Timeframe | Dominant trend | RSI (14) | MACD | Chart pattern |
|---|---|---|---|---|
| Daily (1D) | Bullish (distribution) | ~50 | Bearish cross below signal, negative histogram | Double top (hypothesis, unconfirmed) |
| 4 hours (4H) | Bearish (reversal) | ~28 (oversold) | Below zero, expanding histogram | Triple top confirmed |
| 15 minutes | Bearish (consolidation) | ~41 | Fresh bearish cross, contraction | None |
Technical Levels and Pivot Map
The map combines daily, 4H and 15-minute pivots, Binance order book liquidity clusters, algorithmic figure targets and estimated liquidation zones. The short-term central pivot sits at $82,500-$82,900, the convergence between P daily, P 4H, P M15 and the daily double top neckline — this level is therefore the technical barycenter of the moment.
| Level | Price (USD) | Category | Technical basis |
|---|---|---|---|
| R3 | 86,700 – 87,400 | Major resistance | Swing high $87,385 (09/21) + R2 daily $86,702 + 4H wedge upper bound $87,037 |
| R2 | 85,000 – 85,600 | Major resistance | 4H 50-SMA zone $84,697 + 10/5 high $86,976 + estimated shorts cluster $87,500-$87,800 |
| R1 | 83,800 – 84,200 | Immediate resistance | P daily $83,849 + R1 4H $83,275 + former support turned resistance |
| P | 82,500 – 82,900 | Central pivot | P 4H $82,930 + P M15 $82,659 + daily double top neckline $82,500 + current price |
| S1 | 82,000 – 82,300 | Immediate support | Buyer wall $82,000 ($10.1M) + estimated longs pocket $81,620-$81,827 ($89.8M) + S1 daily $82,139 |
| S2 | 80,900 – 81,400 | Major support | S2 daily $80,996 + S1 4H $82,372 broken + longs cluster $81,412-$81,551 ($71.2M) |
| S3 | 79,500 – 80,000 | Major support | Swing low $79,570 (09/14) + S2 4H $82,027 projected zone + daily SuperTrend $79,527 |
Order Book and Liquidity Heatmap
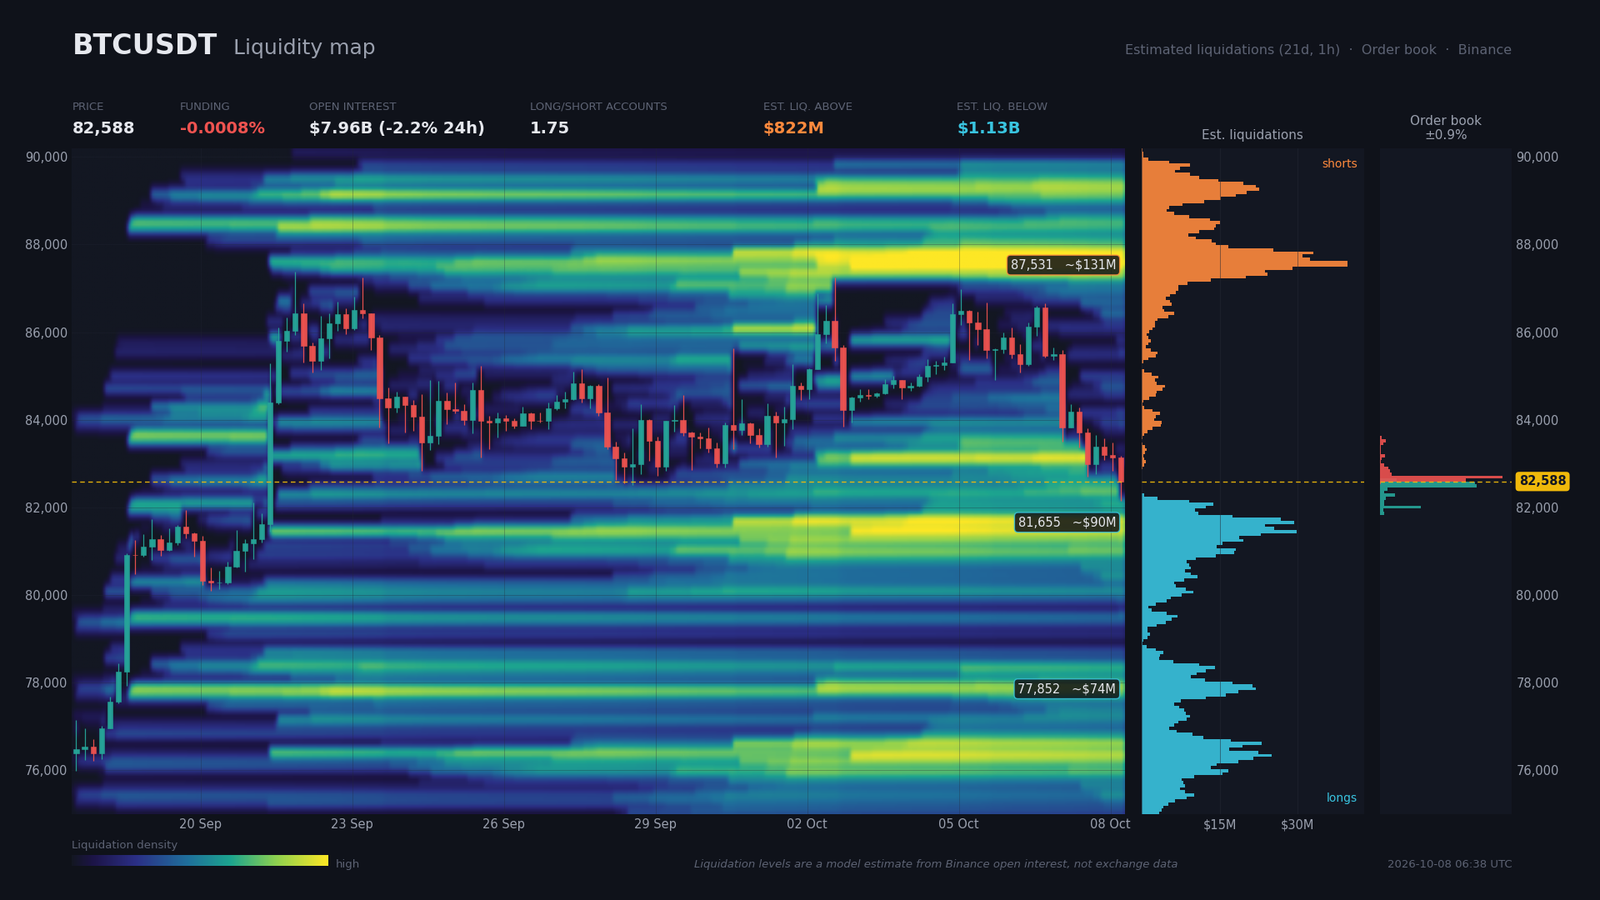
The Binance order book shows 86% coverage with a 6.5% bid-side imbalance ($73.2M bids versus $64.4M asks within ±2%), a slightly bid-heavy but largely insignificant configuration. Notable buyer walls sit at $82,553 ($23.6M) and $82,484 ($24.1M) at -0.04/-0.13% from spot, with an intermediate support at $82,000 ($10.1M). On the sell side, the dominant wall is at $82,691 ($30.4M at +0.13%), followed by $82,622 ($21.3M). The market is corralled within a roughly $700 corridor on either side of spot, typical of an absorption phase before a directional move.
Binance perpetual funding at -0.0008% (annualized -0.9%) and open interest at $7.96B, down 2.18% over 24 hours and 1.51% over seven days, signal a progressive unwind of speculative positions. The global long/short ratio of 1.748 and the top-trader ratio of 1.584 reflect a structurally long positioning that has become vulnerable; the 24h taker buy/sell ratio of 0.911 confirms selling pressure is gaining the upper hand in the short term.
Estimated liquidation zones are sharply asymmetric: $822M above (shorts) versus $1,132M below (longs). The densest pocket below sits at $81,620-$81,827 for $89.8M (-1.13% from spot), followed by $77,818-$78,025 for $74.2M (-5.73%). Above, the $87,497-$87,704 zone concentrates $131M (+5.99%). The risk of a liquidity sweep toward $81,600-$82,000 is elevated before any potential bounce, with the $310M imbalance acting as a bearish gravitational pull.
Calendar: Catalysts to Watch
Four high-impact macro events cluster over the next ten days and can force price out of its current technical structure. The dominant catalyst is the October 14, 2026 US CPI: a hotter print than the prior 0.4% m/m would revive the “Fed hike before year-end” narrative and the 30-year yield, already identified as the catalyst of the current bearish leg; conversely, a downside surprise would trigger a technical bounce off the 4H oversold levels.
- October 8, 2026, 14:30 (Zurich) — US Initial Jobless Claims, consensus 200K (prior 197K): leading labor-market indicator, first test after the weak NFP.
- October 9, 2026, 16:00 (Zurich) — UoM Consumer Sentiment preliminary, consensus 47.6 (prior 48.1): confidence gauge.
- October 14, 2026, 14:30 (Zurich) — US CPI m/m, prior 0.4%: major event likely to set the rate narrative for the November FOMC.
- October 15, 2026, 14:30 (Zurich) — PPI m/m (prior 0.4%) and Retail Sales Control Group m/m (prior 1.4%): confirmation or invalidation of the CPI shock.
Three Scenarios for the Coming Weeks
Three trajectories emerge over the next four weeks. They are anchored in the current technical read, the estimated liquidation zones and the upcoming macro catalysts. Probabilities total 100%.
Scenario A — Bearish Sweep Toward $80,900-$81,400 (probability 60%)
The primary catalyst is the absence of a bounce on the October 14 CPI or a hot surprise, which would push the opportunity cost on risk assets higher. The technical trigger is a 4H close below $82,000, validating the triple top and aligning with S1 daily. The projected trajectory: $82,000 → $81,500 ($89.8M liquidation pocket) → $81,000-$81,400 (S2 daily cluster at $80,996). Execution zone: $82,000-$82,100. Invalidation: daily close above $83,850 (P daily). Target $81,000: R:R ≈ 1.4. Extended target $79,500-$80,000: R:R ≈ 2.4 if the move extends.
Scenario B — $81,500-$84,500 Range With Technical Squeeze (probability 25%)
The primary catalyst is stabilization of the US 30-year yield and the absence of fresh bearish catalysts after the CPI. The technical trigger is price holding above $82,000 on 4H close and a technical bounce from the flushed zone. Projected trajectory: range with resistance at $84,000 (P daily, R1 4H) and support at $81,500-$82,000 (S1 daily, $82,000 buyer wall). Execution zone: buy toward $81,500-$82,000. Invalidation: range break with volume. Target: take profit toward $84,000-$84,500.
Scenario C — Relief Bounce Toward $85,000-$85,600 (probability 15%)
The primary catalyst is an October 14 US CPI lower than consensus, likely to trigger a dovish pivot and calm the 30-year yield. The technical trigger is confirmation of an M15 bullish divergence and a break of $82,880 (R1 M15, $82,691 seller wall). Projected trajectory: $82,700 → $83,850 (P daily) → $85,000-$85,600 (4H 50-SMA, R2 daily). Execution zone: $82,500-$82,700 on dips. Invalidation: failure below $83,850 on 4H close. Stop: $81,800 (1×ATR14 4H). Target $85,500: R:R ≈ 3.1.
Synthesis and Conclusion
Bitcoin is breaking down from its $85,000-$87,250 range in a context of macroeconomic stress (oil, US yields, weak NFP) and fading daily bullish momentum. The confirmed 4H triple top and the hidden intraday bullish divergence argue for an extension toward the liquidation pocket below $81,600, especially as the bearish liquidity model imbalance ($1,132M below versus $822M above) acts as a gravitational pull. The bearish sweep probability dominates at 60%, followed by the wait-and-see range at 25%.
The primary structure remains bullish: the 50/200 daily cross from September 8, 2026, a bullish daily SuperTrend and price above the 200-day SMA. The current decline is therefore a corrective move, not a trend reversal — the key argument underpinning Scenario C. The dominant strategy is to sell rallies toward $83,800-$84,200 (P daily, R1 4H) with invalidation above $84,700 (4H 50-SMA), targeting $81,500-$82,000 then $80,900-$81,400. On the buy side, only engage in the $81,500-$82,000 zone with 4H confirmation and a stop below $80,800 (≈1×ATR14 4H). Critical levels to watch: $84,000 (R1/P daily), $82,500 (double top neckline), $82,000 (buyer wall), $80,995 (S2 daily), $79,527 (daily SuperTrend).
Sources
- Bitcoin Dips Below $83K as Oil Shock Rattles Markets — Decrypt, 07/10/2026
- US Government Moves $103 Million in Seized Bitcoin and BNB — Decrypt, 07/10/2026
- US Investors Want to up Their Crypto Holdings — Bitcoin Magazine, 07/10/2026
- SEC Proposal Would Address How Investment Advisers and Funds Can Custody Crypto Assets — sec.gov, 01/10/2026
- SEC proposes crypto custody rules allowing self-custody and state trust companies — Crypto Briefing, 01/10/2026
- Minutes of the Federal Open Market Committee, September 15-16, 2026 — federalreserve.gov, 07/10/2026
- Thursday’s big stock stories — CNBC, 08/10/2026
- Grayscale says crypto ETF market is entering new phase as Zcash ETF tops $1 billion — The Block, 07/10/2026
- Leverage Went to Futures, Not Options — BIT Weekly, 05/10/2026
- Coinbase brings global crypto derivatives liquidity to US with Deribit integration — Cointelegraph, 07/10/2026
- Bitcoin Falls Under $83,000 on Oil Spike, Rising US Borrowing Costs — Bitcoin Magazine, 07/10/2026
Disclaimer: This article is for educational and informational purposes only. It does not constitute investment advice, a recommendation to buy or sell, or an invitation to trade any financial asset. Cryptocurrency markets are extremely volatile; any investment decision should be based on your own research (DYOR) and, where appropriate, the advice of a licensed financial adviser.

