


Bitcoin trades at $85,799.9 on October 5, 2026, down 0.79% on the current daily candle, after another failed attempt at $86,976 overnight. The major cryptocurrency wraps a week in which attempts to break above the $87,200-$87,400 resistance band have systematically ended in rejections. Over the last 20 daily candles, the cumulative range remains significant: high at $89,316.8 in early August, low at $57,758.6, and the recent structural trough at $74,909.4 on September 15, 2026. The 20-candle variation stands at +13.49%, a sign that the primary trend remains constructive despite fading momentum. The market is now stalling for the second time in a week against a horizontally detected resistance, and the verdict from the FOMC minutes on October 7 at 20:00 (Zurich) will set the next directional regime.
The dominant driver of the session is the derivatives market. According to CoinDesk (October 2), BTC open interest expanded by $2.3B (+4.3%) between September 30 and October 2, with perpetual funding rates climbing from ~3% to ~10%, signaling more expensive long positioning. The snapshot shows OIUSD at $8.42B (+1.79% 24h, +5.92% 7d) and the top-trader long/short ratio at 1.856, confirming buyer pressure concentrated on the most informed counterparties. Glassnode, cited by Crypto Briefing (October 5), points out that the main short liquidation cluster sits just above the current zone, near $90,000. Spot Bitcoin ETF flows remain positive on the other side: $241M net inflows for the week ending October 2 (third straight week), with $134.4M over the first two sessions of October per Decrypt (October 4) and a monthly cumulative of $2.7B in September per The Block (October 2). September 30 still saw an isolated $148.7M outflow.
On the macro side, the main catalyst was the shock NFP print of 29K on October 2 (consensus 90K, previous 133K), with the unemployment rate at 4.2%, which pushed the implied probability of an October Fed pause to 78% per CNBC (October 3) and triggered the initial rebound in long-duration assets. Against that, US 10-year yields have stayed above 5%, the highest level in over 20 years, remaining a structural headwind (CNBC, October 4 and 5; MarketWatch, October 4). The week’s data confirmed a disinflationary but sluggish picture: core PCE m/m at 3.4% vs 3.7% on September 30, ISM Manufacturing at 52.7 vs 55 on October 1, and JOLTS the day before at 7,079 vs 7,230 on September 29. In the eurozone, the flash inflation print of 3.8% vs 3.6% (October 2) puts the ECB under pressure. On the regulatory front, the SEC’s October 1 custody framework proposal (Investing.com, Cointribune) authorizing advisers and funds to use certain state trust companies and qualified self-custody opens a new institutional channel, still to be confirmed.
This combination of positive ETF flows, rebuilt open interest, and macro risk concentrated on the FOMC minutes sets a technical framework where the daily trend remains intact but momentum is fading. The multi-timeframe analysis below details this tension between the underlying bullish structure and short-term buyer fatigue, drawing on the daily, 4-hour, and 15-minute timeframes.
Multi-Timeframe Technical Analysis
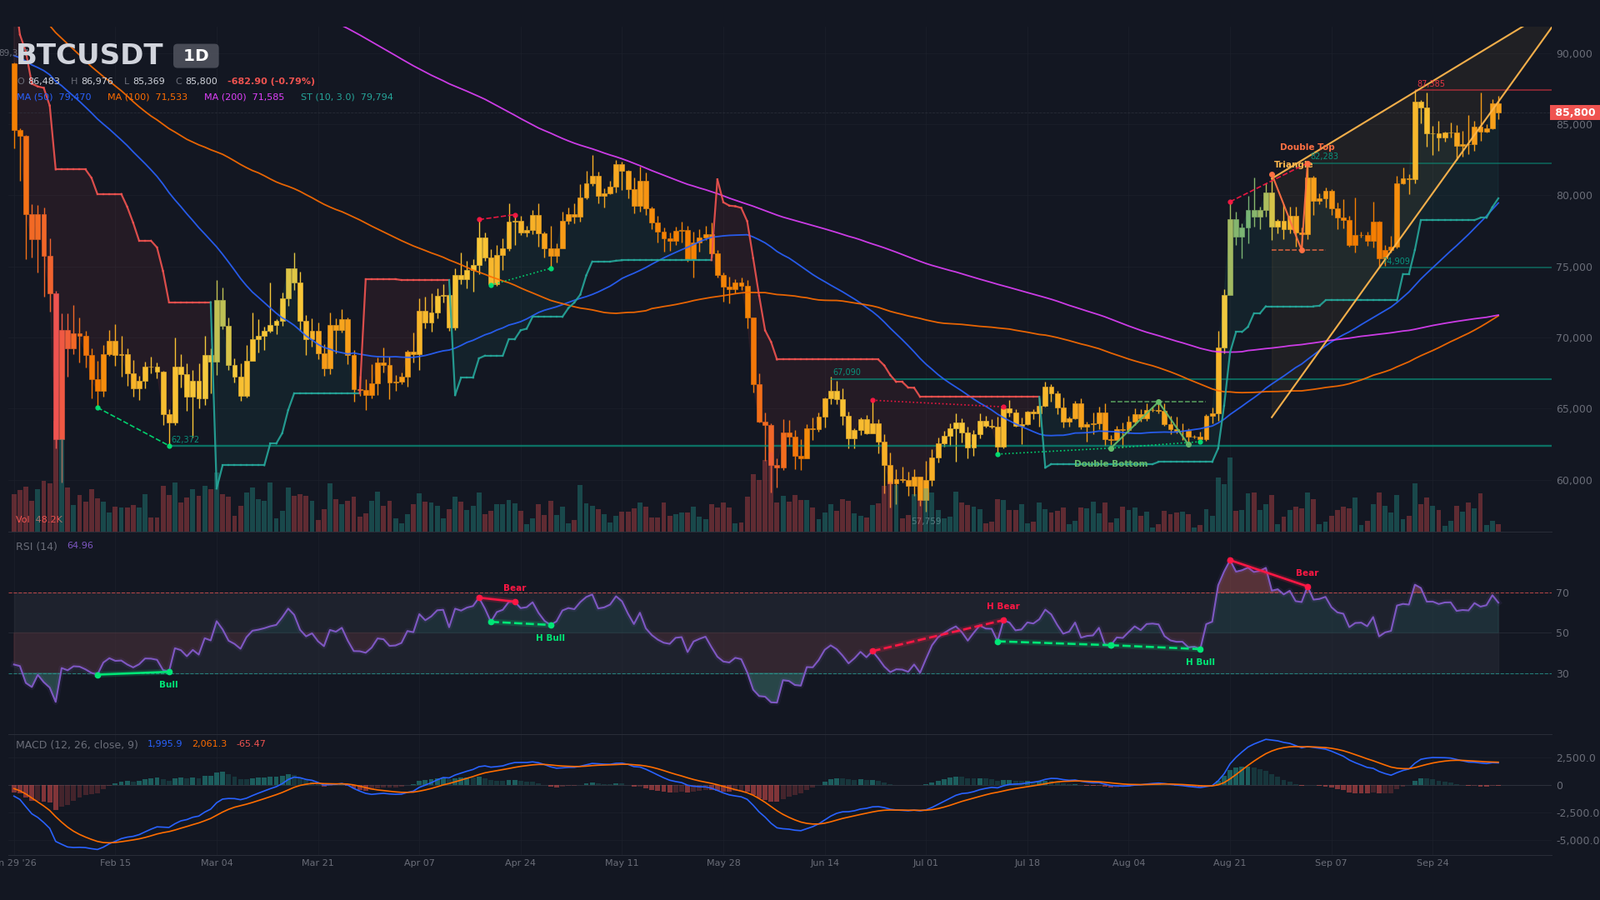
Daily Timeframe (1D): Expanding Wedge and Emerging Bearish MACD Crossover
The daily structure remains bullish on the primary frame. Price closes above the 20-day SMA at $83,356, the 50-day SMA at $79,470, and the 200-day SMA at $71,585, with a Golden Cross (bullish crossover of the 50-day and 200-day simple moving averages) on the 50/200 pair confirmed on September 8, now 27 candles ago. The daily MACD, still positioned above zero, has completed a bearish line/signal crossover on September 29 (six candles), with a negative histogram at -65.47. Momentum is therefore fading even as the overall structure is preserved. The 14-period RSI at 64.96 stays in neutral-positive territory, with no marked recent divergence.
The most relevant algorithmically detected pattern is an expanding wedge formed between August 28 and September 28, with apex estimated at October 17, 2026, bounds at $82,500 and $89,058 — a typical compression pattern in the terminal phase of an impulse. A horizontal resistance at $87,385.1 (1 touch, September 21) and the daily R1 pivot at $87,276 frame the current rejection zone. The algorithmically confirmed bearish double top (neckline $76,152, target $70,412) has been invalidated by price action since mid-September. Daily volume on the current candle at 48,198 represents 33% of the 20-period average, signaling a lack of conviction in the current bearish attempt.
Intermediate Dynamics (4H): Higher Lows Preserved, Competing Patterns Unconfirmed
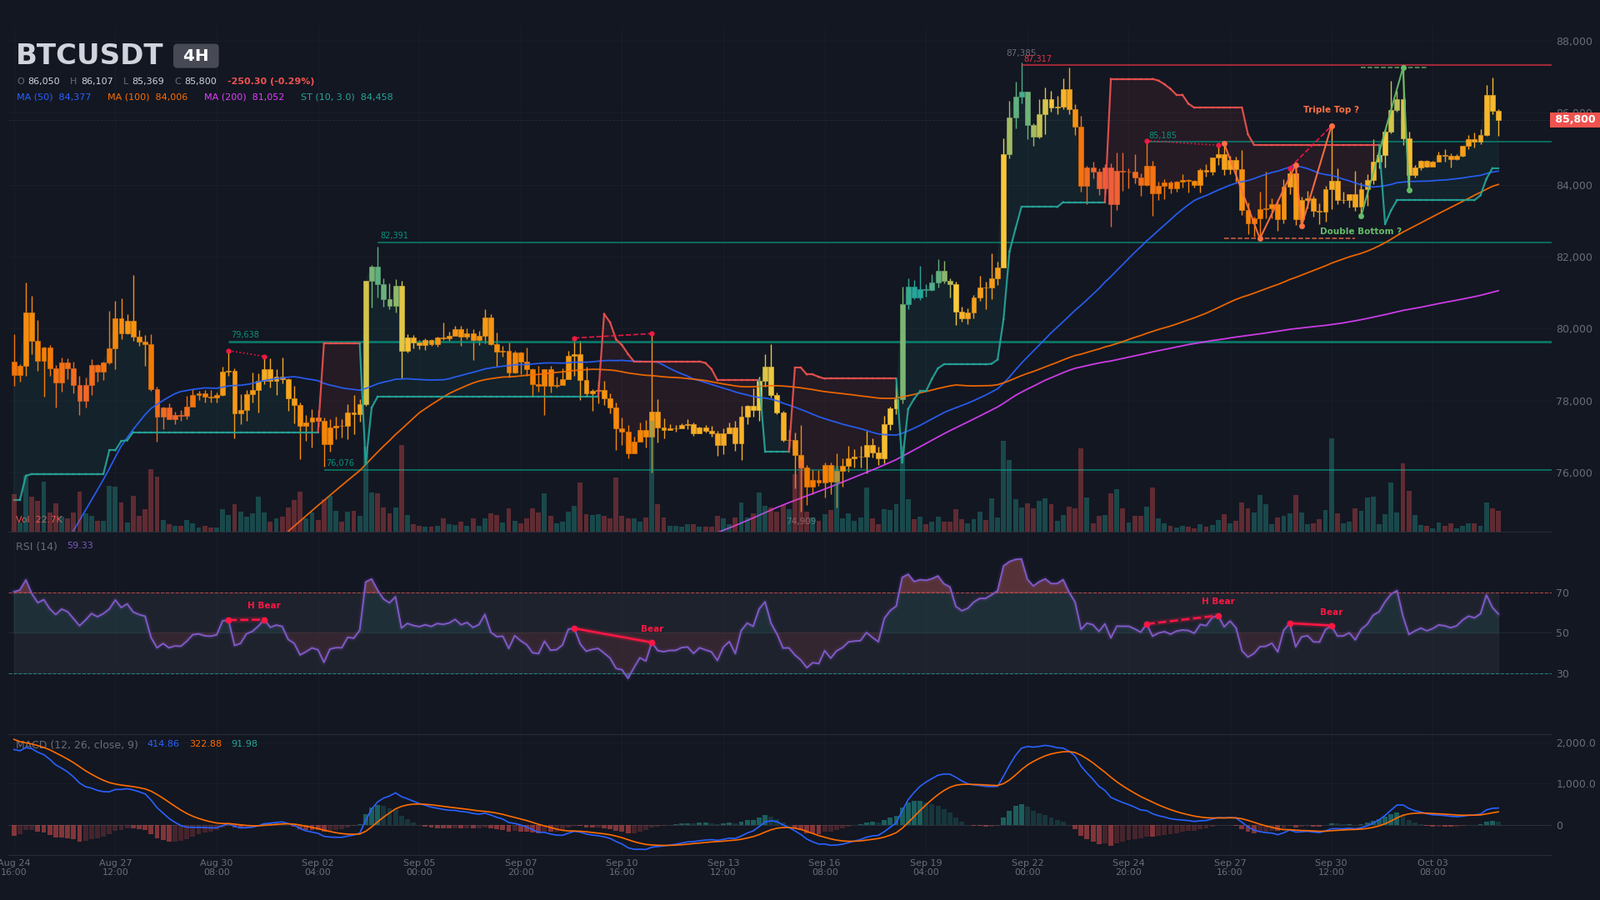
On the 4-hour chart, the structure confirms the daily trend: a series of higher lows at $82,724 on September 29, $83,137 on October 1, $83,841 on October 2, and $84,475 on October 3, with higher highs up to the intraday peak at $87,249 on October 2 at 17:00, followed by a pullback. The 4H SuperTrend (trend-following overlay based on the Average True Range) remains bullish at $84,458 — a dynamic support to watch closely — and the 4H MACD has just crossed bullishly on line/signal on October 4 at 12:00 (four candles), with a positive histogram at +91.98, a positive momentum signal diverging from the daily. The 14-period RSI at 59.33 is neutral, retreating from 68.8.
Two unconfirmed patterns are competing: a bullish double bottom (neckline $87,250, target $91,010) and a bearish triple top (neckline $82,500, target $79,889) — the configuration that technically dominates the battle. 4H supports at $85,185 (2 touches), $82,391 (2), and $79,638 (4 touches, the most solid) are the main levels to monitor. 4H volume on the current candle at 22,707 represents 121% of the 20-period average, signaling interest in the current pullback.
Intraday Structure (15m): Post-Rejection Correction with Multiple Bearish Divergences
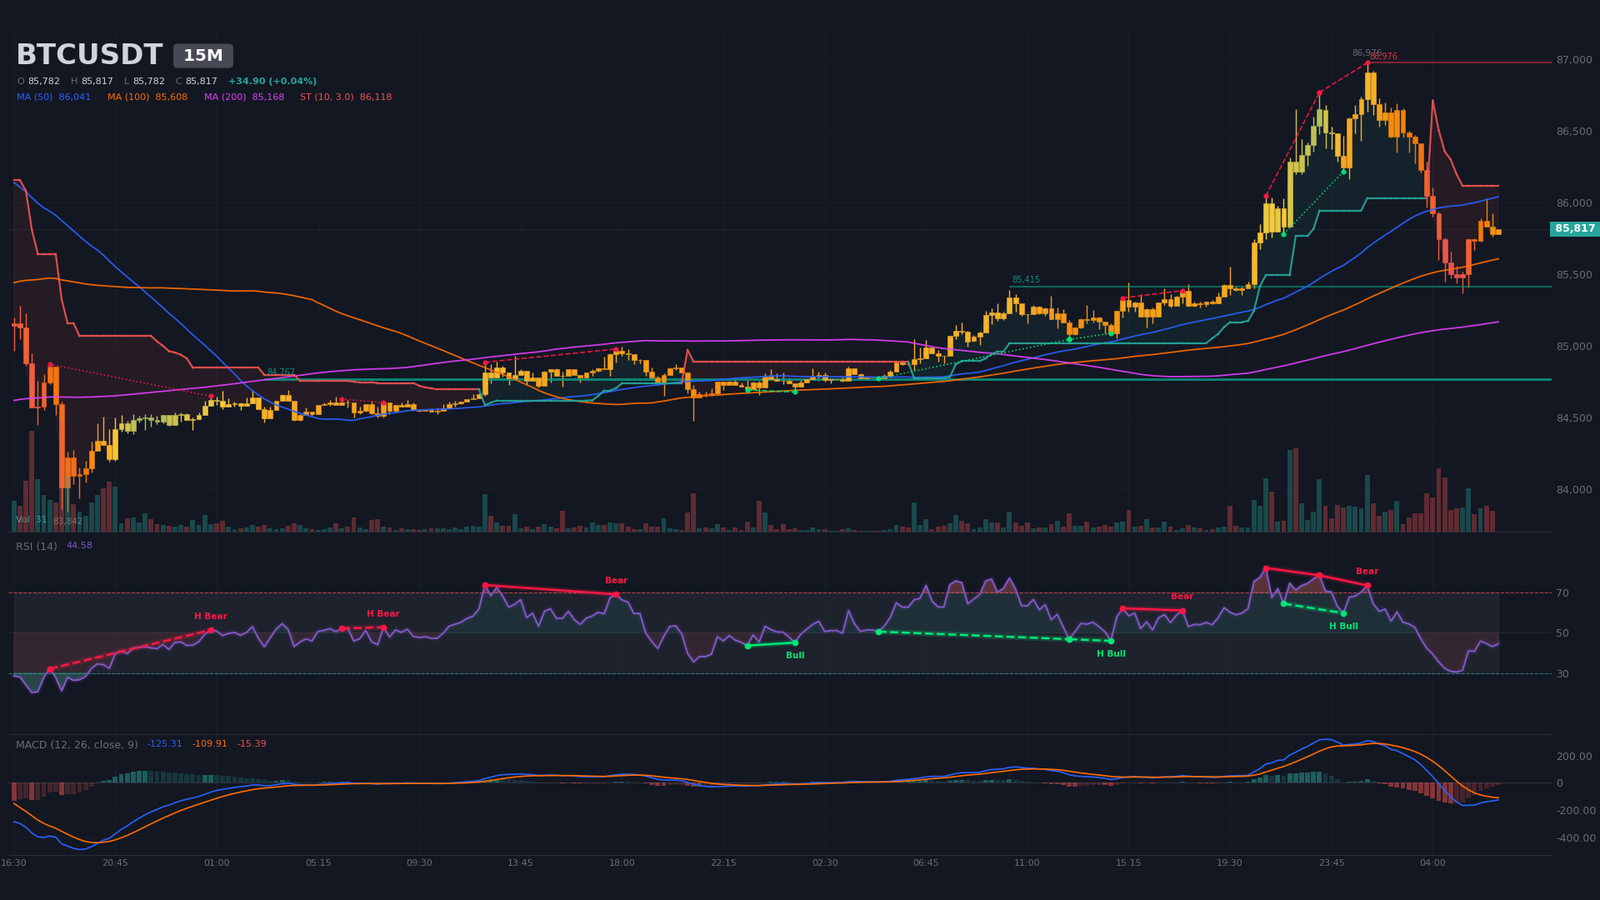
On the 15-minute chart, the structure is clearly corrective. Since the peak at $86,976.1 on October 5 at 01:15, price has printed a sequence of lower highs and lower lows — high $86,655 at 22:15, low $85,369 at 05:15, bounce to $85,817. The 15-minute MACD has turned back below zero with a bearish crossover on October 5 at 01:45 (20 candles), histogram negative at -15.39; the 15-minute SuperTrend has flipped bearish at $86,118, and the 14-period RSI at 44.58 confirms the bearish intraday dynamic. Three regular bearish divergences detected by the algorithm — on the 21:00, 23:15, and October 5 01:15 swings — underline buyer exhaustion as price approaches the $87,000 area.
The major 15-minute support at $84,766.6 (6 touches) is the lower bound of the intraday range, with a secondary bounce level at $85,415 (2 touches). Volume on the current candle at 31 units represents 1.76% of the average: a complete absence of directional commitment. Numerical bounds: range $84,770-$86,970, central pivot $85,823.
Multi-Timeframe Synthesis
The analyst’s table summarizes the cross-timeframe read:
| Timeframe | Dominant trend | RSI (14) | MACD | Chart pattern |
|---|---|---|---|---|
| Daily (1D) | Bullish (consolidation below resistance) | ~65 (neutral) | Bearish crossover stabilizing | Expanding wedge, $87,385 resistance |
| 4 hours (4H) | Bullish (higher lows) | ~59 (neutral) | Recent bullish crossover (4 cand.) | Double bottom / triple top (unconfirmed) |
| 15 minutes | Bearish (post-rejection correction) | ~45 (neutral) | Below zero, bearish crossover | Intraday rejection under $86,976 |
Technical Levels and Pivots Map
The map combines daily and 4H classical pivots, recent swing highs and lows, algorithmically detected supports and resistances on each timeframe, the bounds of the daily wedge, and estimated liquidity concentrations. The short-term central pivot is the $85,970-$86,330 zone, which combines the daily P pivot at $85,977 and the 4H P pivot at $86,331. This equilibrium point between observed buying flows and the immediate resistance serves as the reference level for intraday reading.
| Level | Price (USD) | Category | Technical basis |
|---|---|---|---|
| R3 | $92,500 – $93,000 | Major resistance 3 | Estimated short liquidation pocket (~$155M, peak $92,602) |
| R2 | $89,100 – $89,500 | Major resistance 2 | Short liquidation pocket (~$108M, peak $89,295) + daily period high $89,317 |
| R1 | $87,200 – $87,400 | Immediate resistance | Daily chartimg resistance $87,385 (1 touch) + daily R1 pivot $87,276 + 15m high $86,976 |
| P | $85,970 – $86,330 | Central pivot | Daily pivot $85,977 + 4H pivot $86,331 |
| S1 | $85,400 – $85,700 | Immediate support | 15m support $85,415 + Binance bid wall $85,646-$85,760 ($33M + $12M) + 4H S1 pivot $85,685 |
| S2 | $84,700 – $85,200 | Major support 2 | 15m support $84,767 (6 touches) + daily 20-SMA $83,356 (lower band) |
| S3 | $82,300 – $83,700 | Major support 3 | Estimated long liquidation pocket (~$180M, peak $83,137) + 4H support $82,391 |
Order Book and Liquidity Heatmap
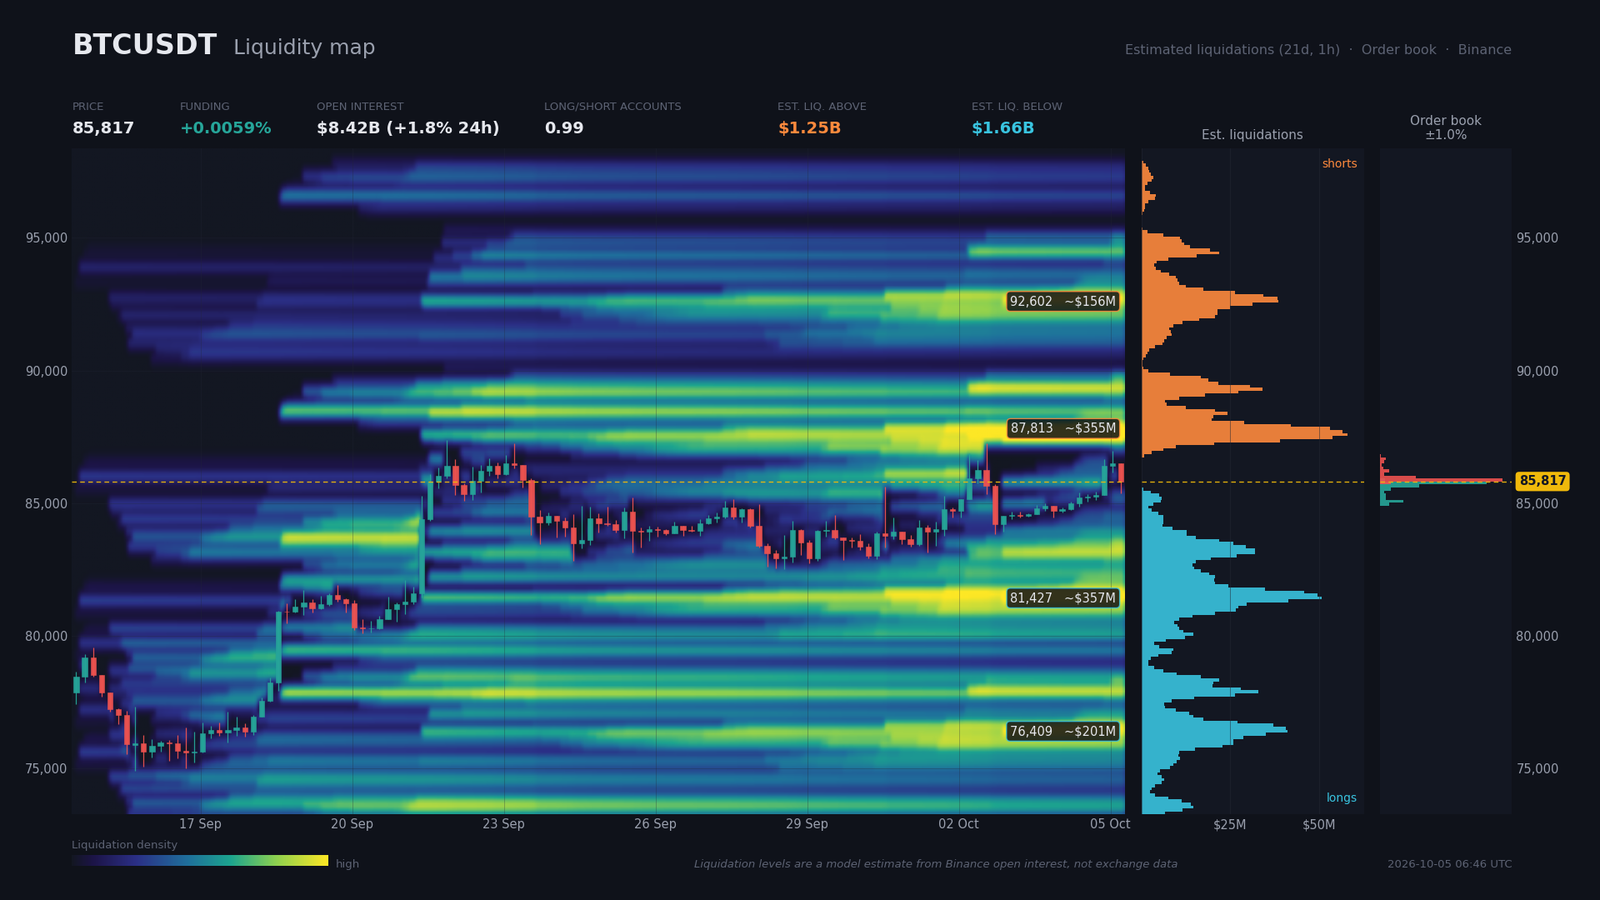
The Binance spot + perp order book (2% coverage, i.e. roughly 0.4% above and below price) shows a buyer imbalance of 3% ($64.1M bids vs $60.4M asks). The main bid wall sits at $85,760 ($33M, -0.07%), followed by $85,646 ($12M, -0.2%); the main ask wall is at $85,874 ($38M, +0.07%), then $85,988 ($11M). Cumulative depth on both sides is modest and quickly exhausted beyond ±0.3%, which makes moves beyond that zone primarily driven by liquidations.
On the derivatives side, the perpetual funding rate at 0.0059% (6.4% annualized) is moderately positive, marking a modest long premium. Open interest stands at $8.42B (+1.79% 24h, +5.92% 7d) — confirmation of the rebuilt long leverage noted by CoinDesk (October 2). The global long/short ratio is 0.994 (balanced), but top traders are at 1.856 (significantly long) and the 24h taker buy/sell ratio is 1.008 (a very slight buyer bias). Estimated liquidation pockets above (shorts) total ~$1.25B with three clusters: $87,300-$88,100 (~$355M), $89,100-$89,500 (~$108M), and $92,500-$93,000 (~$156M); those below (longs) total ~$1.66B with $80,900-$82,050 (~$357M), $82,970-$83,650 (~$180M), and $76,100-$76,700 (~$201M). The imbalance amounts to ~$400M in favor of the downside, identifying a latent bearish price magnet.
Consequence: risk of an initial liquidity sweep toward $85,200-$85,400 before any directional resolution, with a short squeeze potential (forced buy-back of short positions that propels prices higher) if $87,400 breaks (cluster of $355M just above).
Calendar: Catalysts to Watch
Six high-impact events cluster in the next ten days and can alone push Bitcoin out of the $84,700-$87,400 corridor observed since September 15. The centerpiece remains the FOMC minutes on October 7 at 20:00 (Zurich).
- Oct 5, 16:00 (Zurich) — US ISM Services: consensus 55.7, previous 55.4. Issue: confirm ISM slowdown after Manufacturing at 52.7.
- Oct 6, 08:35 (Zurich) — Ueda speech (BoJ). Issue: yen catalyst and Asia flows.
- Oct 7, 20:00 (Zurich) — FOMC Minutes (HIGH): dovish post-NFP consensus, previous: September meeting. Major issue: tone on the pause and forward guidance, market pricing 78% October pause.
- Oct 9, 16:00 (Zurich) — UoM preliminary sentiment: consensus 48.1, previous 48.1.
- Oct 14, 14:30 (Zurich) — CPI m/m + Core CPI US (HIGH): primary directional catalyst of the month.
- Oct 13-14 — China trade balance and inflation, US Existing Home Sales: peripheral macro support.
Three Scenarios for the Coming Weeks
Three probability-weighted configurations frame the evolution through the FOMC minutes and beyond. Scenario A remains the central hypothesis, Scenario B reflects the liquidity-sweep risk, and Scenario C depends on a dovish pivot.
Scenario A — Range Consolidation Ahead of FOMC Verdict (probability 50%)
Trigger: absence of an internal catalyst before October 7 at 20:00, ETF flows holding at a weekly pace of $200-$250M, moderate perpetual funding. Trajectory: oscillations bounded between S2 ($84,700-$85,200) and R1 ($87,200-$87,400), with central pivot at $85,970-$86,330. The daily MACD remains under bearish pressure but without a confirmed breakdown, the daily wedge continues its compression toward the October 17 apex, and sessions end with alternating rejections at the bounds. The R:R ratio of the configuration is 1.9. Execution zone: buy on pullback toward $84,800-$85,200 (S2), target $86,800-$87,200 (R1). Invalidation: 4H close below $84,475 (October 3 4H higher low), i.e. >1.001ATR14 4H.
Scenario B — Bearish Sweep Toward $83,100-$83,700 then Rebound (probability 30%)
Trigger: ETF flow fatigue, profit-taking ahead of the FOMC minutes, sweep of the long liquidation pocket (~$180M at $83,137) identified by the heatmap. Trajectory: 4H break of $84,475 → S3 $82,300-$83,700 → stabilization and rebound, with the daily SuperTrend then playing the role of ultimate support. Execution zone: no aggressive buying; monitor a 15m/4H reversal signal (hammer, bullish divergence) on $82,800-$83,200; rebound target $84,700-$85,400. Invalidation: acceptance below $81,200 (broken $80,900-$82,050 pocket, -5.12%), stop >1.001ATR14 daily ($2,179) from entry.
Scenario C — Bullish Break of $87,400 Toward the $89,100-$89,500 Pocket (probability 20%)
Trigger: FOMC minutes on October 7 perceived as dovish, a scenario reinforced by the 29K NFP, or spot ETF flows above $250M weekly. Trajectory: break of $87,400 with 4H close confirmation, acceleration toward R2 ($89,100-$89,500), then potential activation of the 4H double bottom toward $91,010. The R:R ratio reaches 1.8. Execution zone: break and retest of $87,200-$87,400 as new support; target R2 $89,100-$89,500 (~$108M pocket). Invalidation: return below $86,800 on 4H close, stop >1.001ATR14 4H ($703).
Summary and Conclusion
Bitcoin is evolving through a post-impulse transition phase. The daily structure remains bullish — a 27-candle-old SMA50/200 Golden Cross, price above all SMAs — but momentum is fading, as shown by the bearish MACD crossover and absence of volume. The 4H structure preserves the higher lows and shows a recent bullish MACD, while the 15-minute microstructure corrects after the rejection at $86,976. Spot ETF flows ($241M weekly, $2.7B in September) and rebuilt open interest support Scenario A (range), while the liquidation asymmetry ($1.66B below vs $1.25B above) and the macro backdrop (US yields above 5%, upcoming FOMC minutes) tilt toward short-term bearish caution.
The dominant technical strategy is therefore to avoid both aggressive dip-buying and outright shorting, favoring a buy only on a confirmed pullback toward $84,700-$85,200 (S2), with strict invalidation below $84,475 on 4H close and a target of $86,800-$87,200 ahead of the FOMC minutes verdict on October 7 at 20:00 (Zurich). The global protection level, which would signal exhaustion of the bullish structure, is a daily close below $82,391.
Sources
- Bitcoin Price Prediction: To The Moon and Back, $87K Rally Canceled — Cryptonews, Oct 5, 2026
- Bitcoin faces major short liquidation cluster near $90K, Glassnode says — Crypto Briefing, Oct 5, 2026
- Bitcoin Faces Make-or-Break Resistance at $87,200 — U.Today, Oct 5, 2026
- Spot Bitcoin ETFs see $241M in net inflows for third straight week — Crypto Briefing, Oct 5, 2026
- « Uptober » Starts Green as Bitcoin ETFs Draw $134 Million — Decrypt, Oct 4, 2026
- Why surging Treasury yields don’t signal a U.S. ‘fiscal apocalypse’ — yet — CNBC, Oct 5, 2026
- Stock futures are flat as investors grapple with higher yields, await Fed minutes — CNBC, Oct 4, 2026
- Here are 3 things we’re watching in the stock market in the week ahead — CNBC, Oct 4, 2026
- Fed minutes coming this week could give markets important clues about future rate hikes — MarketWatch, Oct 4, 2026
- How Nvidia, Micron and a surprising jobs report drove last week’s stock action — CNBC, Oct 3, 2026
- Bullish bitcoin (BTC) bets build as open interest jumps by $2.3 billion — CoinDesk, Oct 2, 2026
- Dollar gets lift from higher yields — Reuters, Oct 1, 2026
- SEC Targets Crypto Custody Rules in Major Regulatory Shift — Investing.com, Oct 2, 2026
- SEC Proposes Conditional Self-Custody for Crypto Custody — Cointribune, Oct 2, 2026
- Bitcoin Whales Are Buying Again: 113,950 BTC Added in 10 Weeks — Bitcoin Foundation, Sep 28, 2026
- Hyperliquid perpetual contracts now available on Bloomberg Terminal — Crypto Briefing, Oct 5, 2026
- Ether Outperformed Bitcoin in Q3, But Liquidity Evaporated — Journal du Coin, Oct 5, 2026
- Crypto en France : Binance, flat tax à 31,4 %, DAC8 et euro numérique — Journal du Coin, Oct 5, 2026
- Former SEC boss made AI Czar, Bitcoin may hit $600K this cycle: Hodler’s Digest — Cointelegraph, Oct 5, 2026
- El Salvador receives $138 million from IMF after Bitcoin waivers granted — Cointelegraph, Oct 4, 2026
Disclaimer: This article is for educational and informational purposes only. It does not constitute investment advice, a recommendation to buy or sell, or an invitation to trade any financial asset. Cryptocurrency markets are extremely volatile; any investment decision should be based on your own research (DYOR) and, where appropriate, the advice of a licensed financial adviser.

