


Bitcoin trades at $83,069 on Binance as September draws to a close, after the September 21 peak at $87,385. Over five days the pullback stands at 1.17%, over twenty days residual gains still reach 8.54%. Price has retraced nearly 5% from its high and settled into a consolidation phase that does not yet impair the daily structure. The primary trend stays bullish since the 50/200 SMA crossover on September 8, but short-term momentum is clearly fading.
The dominant driver right now is leverage compression on derivatives. Bitcoin’s open interest on Binance has retreated 15.55% over seven days to $7.74B, while funding has stabilized at 0.001%, equivalent to 1.1% annualized. The market has digested the bulk of directional leverage after the September 21-28 drop, which lowers the probability of a violent short-term squeeze. The global long/short ratio sits at 1.393 and rises to 1.941 among top traders, evidence that the best-informed accounts keep a structural buyer bias. The Deribit quarterly options expiry on September 25 was absorbed without incident.
On the macro side, US Treasuries marked a rate high since 2007 on the 10-year and since 2002 on the 30-year according to CNBC (September 30, 2026), which mechanically weighs on long-duration assets including Bitcoin. NY Fed President John Williams stated on September 29 (MarketWatch) that there was “no urgency” after the September hike, tempering expectations of a back-to-back October move. Recent prints confirm cooling: JOLTS at 7.079M on September 29 versus 7.23M consensus and 7.335M prior, Conference Board consumer confidence at 81.9 versus 89.2 expected — a 7.3-point disappointment. China’s manufacturing PMI on September 30 at 50.2 (consensus 49.3) moved back above the expansion threshold.
On flows and adoption, US spot Bitcoin ETFs pulled in $2.95B over 30 days per Decrypt (September 29, 2026), with an eight-day inflow streak that began on September 17. HANetf launched the world’s first euro-hedged Bitcoin ETF (Bitcoin Magazine, September 29, 2026). Bitwise indicated that none of the fifteen large investors surveyed sold during the drop from $125,000 to $60,000, with many adding (Bitcoin Magazine, September 29). The CryptoQuant report dated September 29 adds nuance, however: short-term traders’ unrealized profit margin has reached 33%, its highest since December 2024, and 25,700 BTC were taken as profit on September 22 — the largest daily volume of 2026.
Multi-Timeframe Technical Analysis
Daily Timeframe (1D): Distribution Below Resistance After the Rally
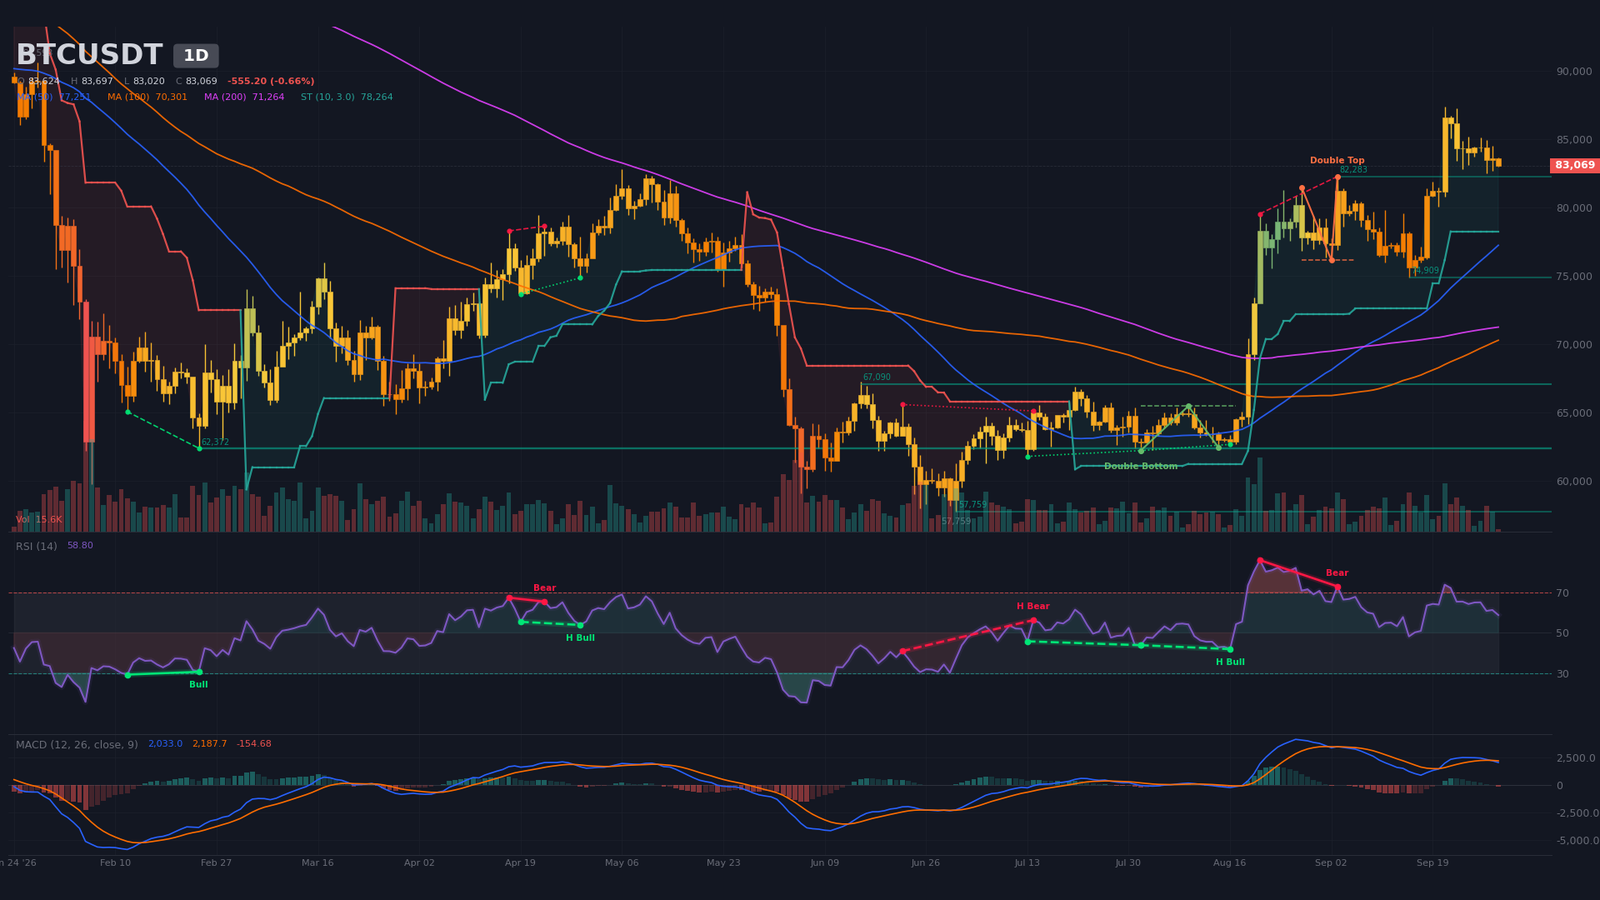
The daily trend remains bullish: price at $83,069 holds above the 20 SMA ($81,264), 50 SMA ($77,251) and 200 SMA ($71,263), in the wake of the bullish 50/200 crossover on September 8, 2026. The September 15-21 rally lifted price from $74,909 to $87,385, or +16.7% in six sessions, before a distribution phase took hold. The 14 RSI has pulled back from 72.2 to 58.8 over the last nine candles — a neutral reset, no bearish excess.
The daily MACD crossed below its signal on September 29 (one candle), with a negative histogram at -154.68 and a MACD line still positive at 2,033. This crossover flags a slowdown in momentum, not a structural turn. The pattern detector flags a regular bearish RSI divergence from August 21 to September 3 (price 79,555 → 82,283, RSI 86 → 73) that forms a second divergence in waiting with the September 21 high at $87,385 on RSI 73.86. The bullish daily SuperTrend at $78,264 remains the cornerstone: as long as it holds, the daily structure is valid.
Intermediate Dynamics (4H): Confirmed Double Top and Bearish Compression
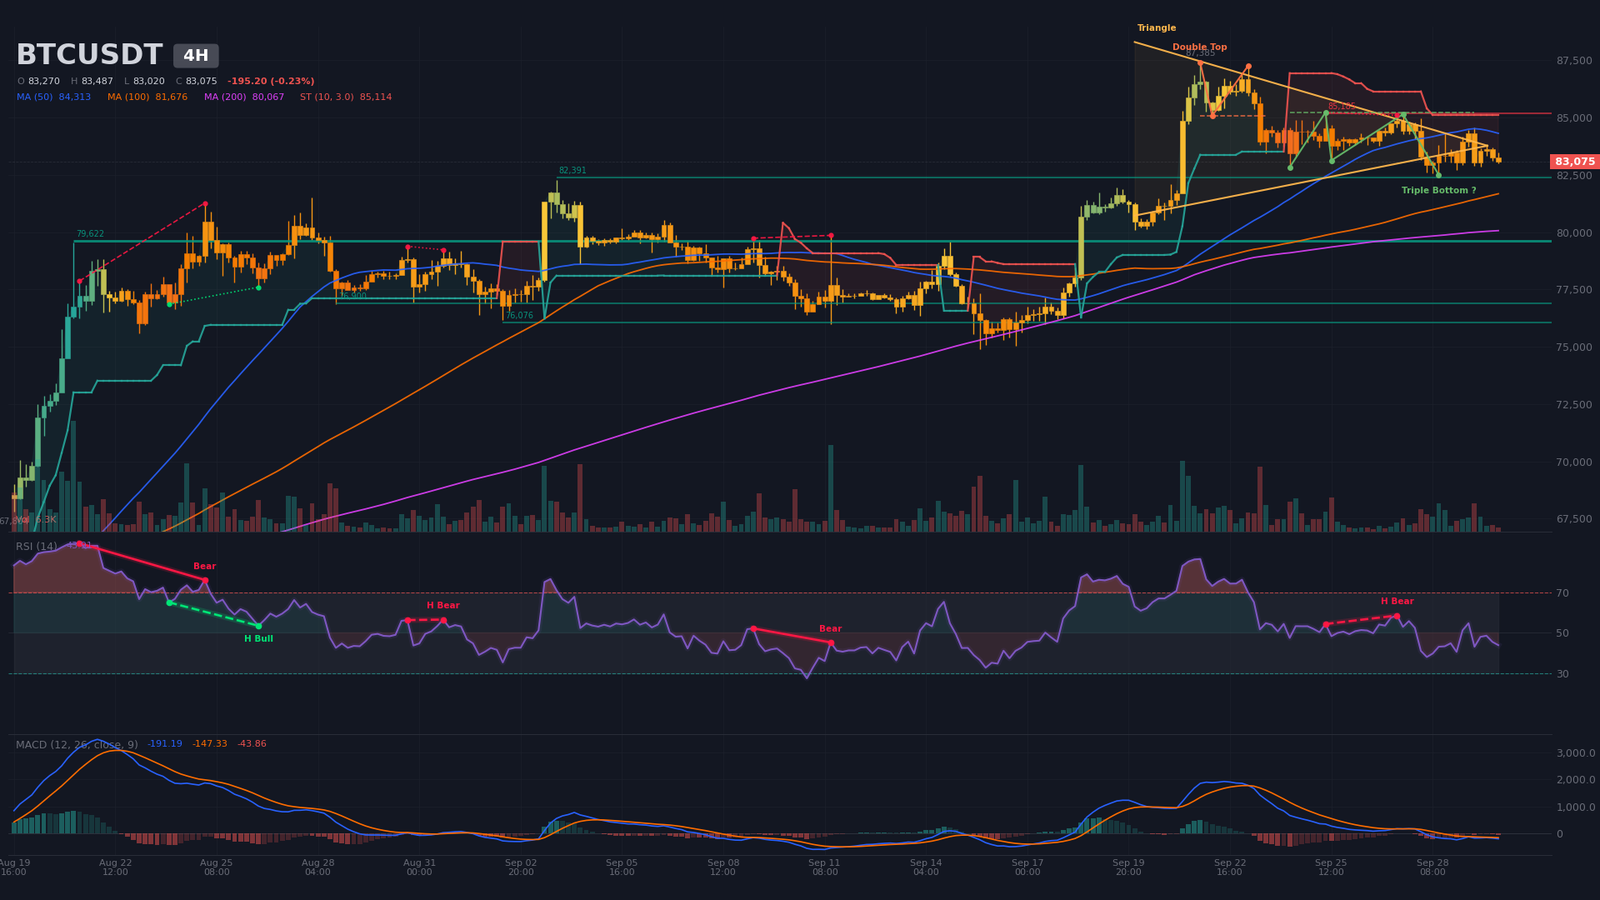
The H4 structure confirms the daily correction: September 29-30 candles trade below the 20 SMA ($83,739) and 50 SMA ($84,313), while staying above the 200 SMA ($80,067). The 14 RSI has pulled back to 43.9 from 54.8 four candles earlier, signaling neutral leaning bearish. The H4 MACD moved below its signal and below zero since the bearish crossover on September 27 at 20:00 (14 candles), with a line at -191.19, a signal at -147.33 and a histogram at -43.86 — confirmed bearish momentum.
The H4 detector identifies a confirmed bearish double top with a neckline at $85,080 and a target at $82,844 — almost reached with price at $83,075. An unconfirmed bullish triple bottom (neckline $85,224, target $87,627) is still pending validation. The H4 SuperTrend has flipped bearish at $85,114 and clearly defines the short-term resistance. Notable H4 supports stack at $82,391 (two touches), $79,621 (five touches since August), $76,900 and $76,076. The 14-period H4 ATR stands at $826, or 0.99% of price.
Intraday Structure (15m): Compression Below Resistance, Support at $82,775
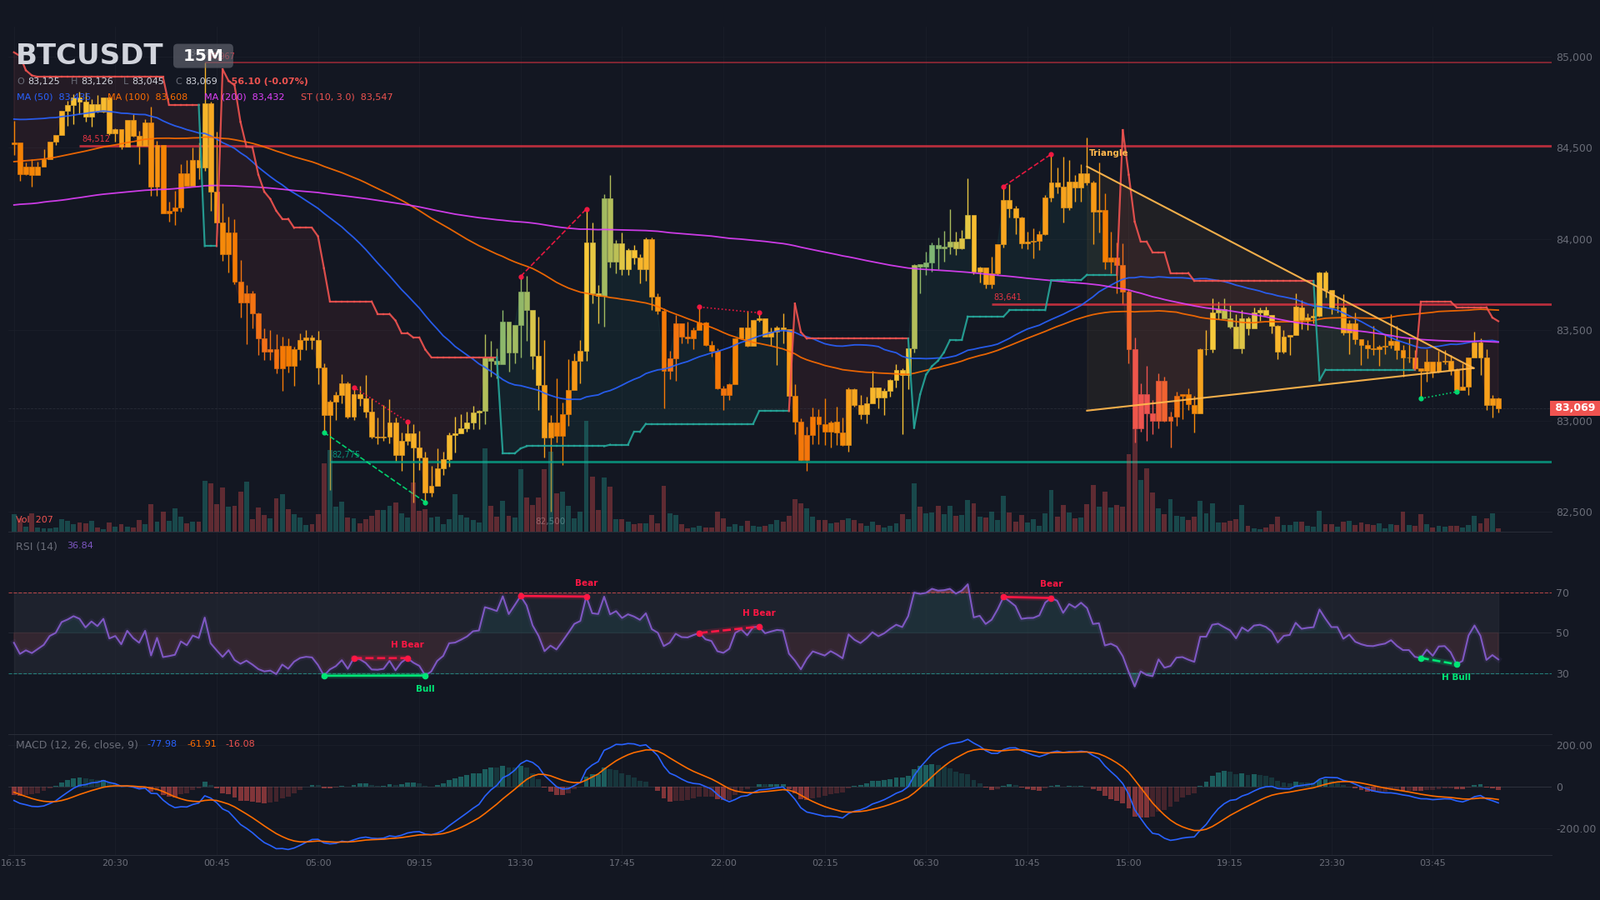
On the 15-minute chart, the structure sketches a bearish compression: a symmetrical triangle was detected with apex on September 30 at 05:15 (resolved), price below all three SMAs (20 at $83,290, 50 at $83,435, 200 at $83,432) and a 14 RSI at 36.8 — the lowest of the last nine candles, near oversold. The M15 MACD crossed bearish at 06:00 (two candles), with a histogram at -16.1 expanding.
The M15 SuperTrend has flipped bearish at $83,547; M15 resistances stack at $83,641 (four touches), $84,512 (four touches) and $84,967 (one touch). The key M15 support is $82,775 with seven touches since September 28 — an extremely dense congestion level. The 14-period M15 ATR stands at $154, or 0.19% of price, typical of compression. A hidden bullish divergence (price 83,122 → 83,159, RSI 37.6 → 34.5) signals an imminent technical bounce after the liquidity sweep.
Multi-Timeframe Synthesis
The crossover of the three timeframes paints a market in transition. The daily structure stays bullish but in distribution, H4 confirms the correction through a double top whose target is nearly reached, and M15 exhausts below resistance in a compression typical of an inflection point.
| Timeframe | Dominant trend | RSI (14) | MACD | Chart pattern |
|---|---|---|---|---|
| Daily (1D) | Bullish (distribution) | ~59 | Recent bearish crossover (1 d) | Disabled double top |
| 4-hour (4H) | Bearish (correction) | ~44 | Below zero, contracting | Confirmed double top |
| 15-minute | Bearish (compression) | ~37 | Below zero, expanding | Resolved symmetrical triangle |
Technical Levels and Pivots Map
The map combines classic daily pivots, daily/H4 swing highs and lows, algorithmically detected supports and resistances, H4 triangle bounds and daily/H4/M15 SuperTrends. The short-term central pivot is the $83,400-$83,700 zone, which matches both the daily pivot ($83,635) and the current oscillation zone.
| Level | Price (USD) | Category | Technical foundation |
|---|---|---|---|
| R3 | 87,250 – 87,700 | Major resistance | Short liquidation pocket 87,257-87,684 (+5.39%) + daily swing high $87,385 on 21/09 |
| R2 | 85,000 – 85,500 | Major resistance | H4 resistance $85,185 (2 touches) + bearish H4 SuperTrend $85,114 + double-top neckline $85,080 |
| R1 | 84,400 – 84,600 | Immediate resistance | Daily R1 pivot $84,545 + daily R2 pivot $85,465 |
| P | 83,400 – 83,700 | Central pivot | Daily pivot $83,635 + current oscillation zone |
| S1 | 82,700 – 82,800 | Immediate support | M15 support $82,775 (7 touches since 28/09) |
| S2 | 81,400 – 82,400 | Major support 2 | Long liquidation pocket 81,367-81,709 (-1.9%) + H4 support $82,391 (2 touches) |
| S3 | 79,500 – 79,700 | Major support 3 | H4 support $79,621 (5 touches since August) + bullish daily SuperTrend $78,264 |
Order Book and Liquidity Heatmap
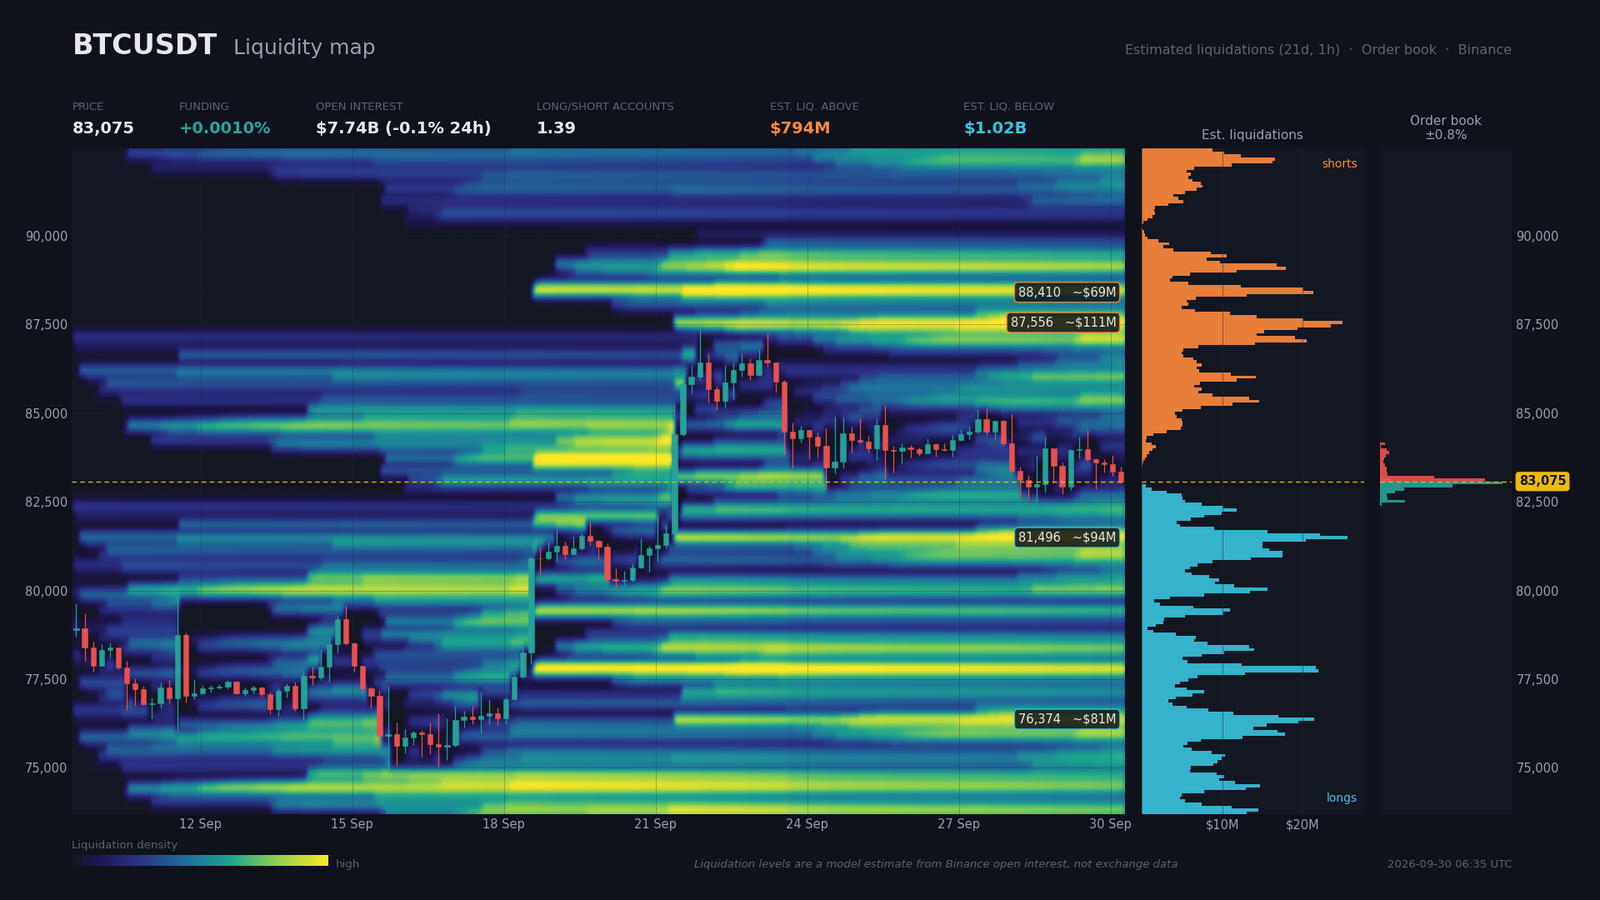
The Binance order book is readable up to 0.76% of price on either side, which is narrow. On the 2% window, bids total $81.3M against $62.6M on asks — a +13% imbalance in favor of buyers, evidence of limited short-term selling pressure. The main buyer wall is at $83,032 ($35.3M, distance -0.05%), followed by $82,947 ($20.8M, -0.15%) and $82,861 ($7.0M, -0.26%). On the sell side, the main wall is at $83,117 ($30.3M, +0.05%) then $83,203 ($15.5M, +0.15%) — a very thin book that signals compression and potential breakout volatility.
On the derivatives side, open interest stands at $7.74B, down 15.55% over seven days and almost flat over 24 hours (-0.08%) — a significant leverage wash-out. Funding at 0.001% (1.1% annualized) is neutral. The global long/short ratio is 1.393 and rises to 1.941 on top traders, meaning the best-informed traders keep a structural buyer bias.
Modeled liquidation pockets are asymmetric: $1.02B below price (longs) versus $794M above (shorts). The nearest pocket below price is $81,367-$81,709 (~$93.6M, -1.9%), immediately followed by $76,160-$76,502 (~$80.9M, -8.07%). Above, the densest short pockets are $87,257-$87,684 (~$111M, +5.39%) and $88,367-$88,623 (~$69M, +6.42%). Mechanically, the proximity of the $81,400 pocket makes it a short-term bearish magnet: a liquidity sweep toward $81,400-$81,700 before a bounce is the efficient scenario.
Calendar: Catalysts to Watch
The macro calendar over the next ten days concentrates two high-impact events capable of pulling Bitcoin out of its $82,800-$84,600 compression zone: the US core PCE printed today, Wednesday September 30 at 14:30, and the NFP report on Friday October 2.
- Wed. Sep. 30, 14:30 (Zurich) — Core PCE m/m (USD) | consensus 0.3% | prior 0.2%: today’s main catalyst. A core ≥ 0.4% would reignite long-end yields and weigh on BTC; a core ≤ 0.3% would open the door to a Fed pivot.
- Thu. Oct. 1, 16:00 (Zurich) — ISM Manufacturing | consensus 55 | prior 51.2: sharp rebound expected, reindustrialization signal.
- Fri. Oct. 2, 11:00 (Zurich) — Flash Core CPI EUR | consensus 2.5% y/y | prior 2.4%.
- Fri. Oct. 2, 14:30 (Zurich) — NFP (USD) | consensus 90K | prior 162K: major catalyst of the week. A print < 90K would confirm labor deceleration; a print > 110K would revive stagflation fears.
- Wed. Oct. 7, 20:00 (Zurich) — FOMC Minutes.
Three Scenarios for the Coming Weeks
The combination of the technical setup, pivot levels and macro catalysts lets us rank three trajectories for the weeks ahead. Desk probabilities: 55% / 30% / 15%.
Scenario A — Sweep then Bullish Bounce (probability 55%)
Trigger: test of M15 support at $82,775 then of the liquidation pocket at $81,367-$81,709 within 24 to 72 hours, followed by a bounce catalyzed by a core PCE ≤ 0.3% today or an NFP < 100K on Friday. Path: 83,069 → 81,600 → 82,391 → 84,545 → 85,185. Execution zone: $81,400-$81,700. Invalidation: H4 close below $79,621 (H4 support at five touches) or daily break below the bullish SuperTrend at $78,264. Stop ≥ $826 (1× H4 ATR) above entry, i.e. roughly $82,226 for an entry at $81,400. R:R toward $85,000 ≈ 4.4. Justified by the top-trader long/short ratio at 1.94, the density of the $81,400 pocket ($94M) and the persistence of the bullish daily SuperTrend.
Scenario B — Hawkish PCE and Break (probability 30%)
Trigger: today’s core PCE print ≥ 0.4% m/m reigniting US long-end rates (10-year toward 5.4%) and triggering a wave of selling. Path: 83,069 → 82,391 → 81,367 → 79,621 → 76,160. Execution zone: $82,300-$82,400. Invalidation: return above $83,886 (seller wall +0.98%) on H4 close. Stop ≥ $826 above. R:R toward $76,500 ≈ 7.3. Justified by Bitcoin’s sensitivity to US real rates and Treasury nervousness, with the 10-year at a high since 2007.
Scenario C — Range and Two-Sided Sweep (probability 15%)
Trigger: PCE in line with consensus and NFP near 90K on Friday. Path: oscillations between $82,000 and $84,600, with sweeps in both directions. Execution zones: $82,200-$82,800 for buying, $84,400-$84,600 for selling. Invalidation: range break via daily closes. Justified by the M15 compression (ATR $154, 0.19%) and the density of technical levels in the $82,000-$84,600 zone.
Summary and Conclusion
Bitcoin trades in a distribution phase within a daily primary bullish trend, supported by the September 8 50/200 crossover and price still holding above the 200 SMA. The September 15-21 rally ($74,909 → $87,385) exhausted short-term momentum, confirmed by the daily MACD bearish crossover and the formation of a confirmed H4 double top whose target at $82,844 is almost reached. ETF flows remain positive ($2.95B over 30 days) and institutional sentiment is stable, but the derivatives market has lightened up (-15.5% open interest over seven days) and US long-end rates weigh on duration.
The dominant technical strategy is buying dips in the $81,400-$82,400 zone with strict invalidation below $79,621 (H4 close) or $78,264 (daily close, SuperTrend). The priority protection level remains the daily SuperTrend at $78,264, whose break would call the entire primary bullish bias into question.
Sources
- Customers Withdraw Over 4,000 Bitcoin From Bitget in One Hour After $388M Hack — Bitcoin Magazine, September 29, 2026
- Bitwise Head of Research: Sovereigns Selling Gold for Bitcoin — Bitcoin Magazine, September 29, 2026
- Tracy Shuchart: BTC & the Commodities Supercycle — Bitcoin Magazine, September 29, 2026
- CryptoQuant says bitcoin correction could be near as traders’ unrealized profit hits 21-month high — The Block, September 29, 2026
- HANetf Debuts Euro-Hedged Bitcoin Fund in World First — Bitcoin Magazine, September 29, 2026
- Crypto ETFs Surge as Bitcoin Funds Add $2.95 Billion in 30 Days — Decrypt, September 29, 2026
- Stretched Profits and Cooling Demand Put Bitcoin Rally on Pause — Bitcoin Magazine, September 29, 2026
- Million-dollar question: Between S&P 500 bulls and bears — CNBC, September 30, 2026
- Hedge funds now hold a record share of the $30 trillion Treasury market — CNBC, September 30, 2026
- Stock futures inch higher as traders weather latest rise in Treasury yields — CNBC, September 30, 2026
- Traders expecting a back-to-back rate hike from the Fed in October may have gotten ahead of themselves — MarketWatch, September 29, 2026
- Crypto regulation at SEC, CFTC to come down to 3 commissioners — Cointelegraph, September 29, 2026
- Citi Clients Can Now Take Stablecoin Payments Through Coinbase — Decrypt, September 28, 2026
- Profit-Taking: A Young Bull Market Showing Signs of Fatigue — CryptoQuant Research, September 29, 2026
- Binance Starts Moving Crypto Out Of Funding Accounts — Bitcoinist, September 30, 2026
- Robinhood Begins US Crypto Perps Rollout With Up to 10x Leverage — The Defiant, September 30, 2026
- Cboe’s New S&P Deal Opens the Door to Tokenized Options — Decrypt, September 29, 2026
Disclaimer: This article is for educational and informational purposes only. It does not constitute investment advice, a recommendation to buy or sell, or an invitation to trade any financial asset. Cryptocurrency markets are extremely volatile; any investment decision should be based on your own research (DYOR) and, where appropriate, the advice of a licensed financial adviser.

