


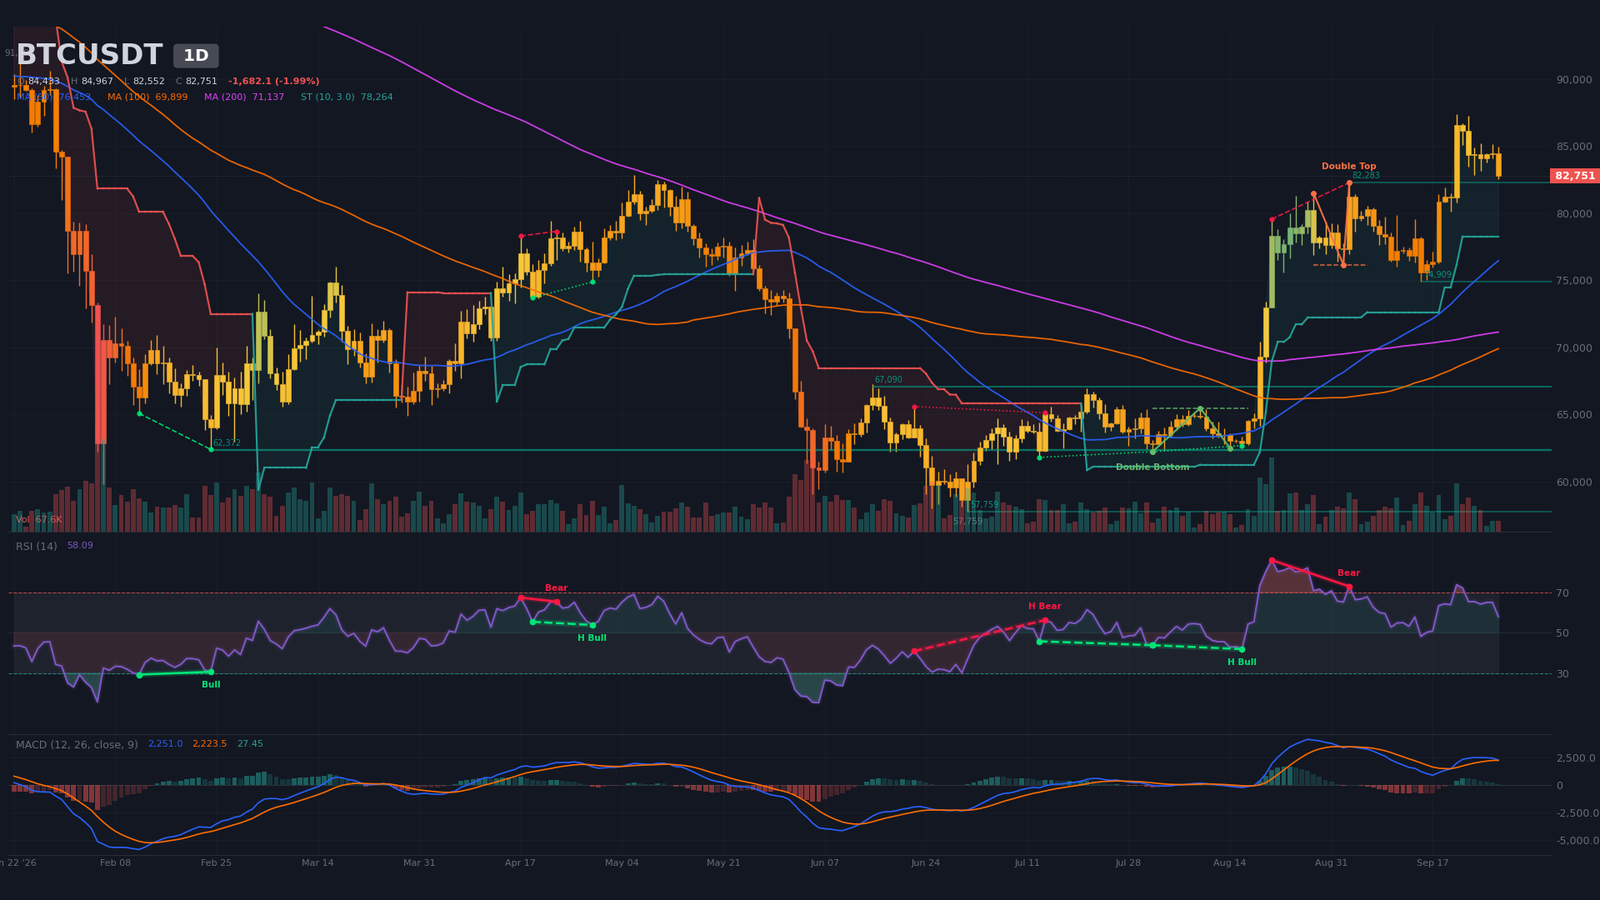
Bitcoin trades around $82,750 on the daily candle of September 28, down 1.99%. The price slipped under the $83,000 mark for the first time since September 21, touching an intraday low at $82,551. The relevant swing high remains $87,385 (September 21) and the daily reference low stays at $57,758 (July). The corrective move from the high reaches nearly 5.3%, within a daily structure that stays bullish on moving averages but whose momentum is rapidly eroding. The current phase resembles a corrective pause within a bullish cycle fueled by record ETF inflows but exposed to a liquidity sweep risk below $82,500.
The dominant session episode is Bitcoin’s drop below $83,000, accompanied by a cascade of long liquidations. Cointelegraph (September 28) cites a concentration of more than $30M in offers around $85,700 blocking any attempt to return toward the 2026 yearly open near $88,700. According to CoinGlass, roughly $70M in long positions were liquidated over 24 hours. Crypto Briefing tallies more than 101,000 crypto positions liquidated in 24 hours, totaling between $114M and $203M depending on sources. The September 25 Deribit quarterly expiry and the same-day CME futures monthly settlement sustained post-settlement volatility that fed selling pressure.
The macro backdrop weighs against risk in the short term. US Treasury yields kept climbing, with the 10-year at 5.21% and the 30-year at 5.52% per CNBC (September 28). WTI crude crossed $95 for the first time since September 24 (Cointelegraph, September 28) after Donald Trump refused to rule out further strikes against Iran, while Nasdaq futures were down 0.9%. Recent releases confirm the defensive tone: weekly jobless claims on September 24 came in at 197,000 vs 201,000 consensus, a slight improvement with little directional impact, and durable goods orders ex-transport on September 25 printed 0.3% m/m vs 0.6% expected, a disappointment weighing on risk appetite. Against the tide, US spot ETF flows confirm robust institutional demand: $2.4B in inflows over the week per Cointelegraph (September 28) and The Block (September 26), the largest since October 2025, with seven consecutive positive sessions totaling nearly $3B and bringing YTD flows back into positive territory. Riot Platforms fully repaid a $200M credit facility (Cointelegraph, September 27), while the SEC ruled that token buyback programs on functional networks do not constitute a “managerial effort” under the Howey test (Decrypt, September 27). Washington and Beijing announced on Monday a reciprocal tariff cut on $60B of goods following the Trump-Xi summit, extending the truce through January (CNBC, September 28 and 25).
This hybrid context calls for patient technical reading. The short-term pressure – liquidations, bond yields, geopolitics – opposes the structural bullish flow driven by ETFs and the trade truce. The bullish daily technical signal stays valid but cannot express itself without a positive catalyst. The PCE (September 30) then NFP (October 2) sequence will decide between extended consolidation and trend resumption.
Multi-Timeframe Technical Analysis
Daily Timeframe (1D): Return Below the Post-Impulse Range Axis
The dominant daily structure is a return below the post-impulse range axis, a classic pullback after top. The price at $82,750 trades below the September 21 swing high at $87,385 and below the prior September 3 peak at $82,282, sketching a lower high that signals buyer exhaustion. The moving average hierarchy nonetheless stays bullish: the price holds above the SMA20 at $80,634, the SMA50 at $76,453 and the SMA200 at $71,136, with the 50/200 bullish crossover dated September 8, twenty candles ago. The ATR14 at $2,286 represents 2.76% of price, an elevated daily volatility that mandates a reduced position size.
The daily RSI14 prints around 58 after a sequence of 64-65-65-65-66-72-74-58, retracing from overbought without crossing the lower neutral. The daily MACD, line at 2,251 and signal at 2,224, stays positive after its September 21 bullish cross, but the histogram has contracted to +27 over seven candles, a sign of fading momentum. A regular bearish RSI divergence is confirmed by chartimg over August 21 – September 3, price from $79,555 to $82,282, RSI from 86 to 73, an end-of-impulse signal to monitor closely.
Detected patterns frame the reading. A bearish double top, neckline at $76,152 and target at $70,412, has been executed, confirming the post-September 21 distribution scheme. A bullish double bottom, neckline at $65,483 and target at $68,609, was already realized in August. The daily SuperTrend stays bullish at $78,263. Today’s volume at 67,646 represents 47% of the 20-period average, a decline that lacks selling conviction. The daily bias remains bullish on trend, with an extended consolidation risk between $76,000 and $85,000 as long as the SMA200 holds.
Intermediate Dynamics (4H): Confirmed Bearish Double Top
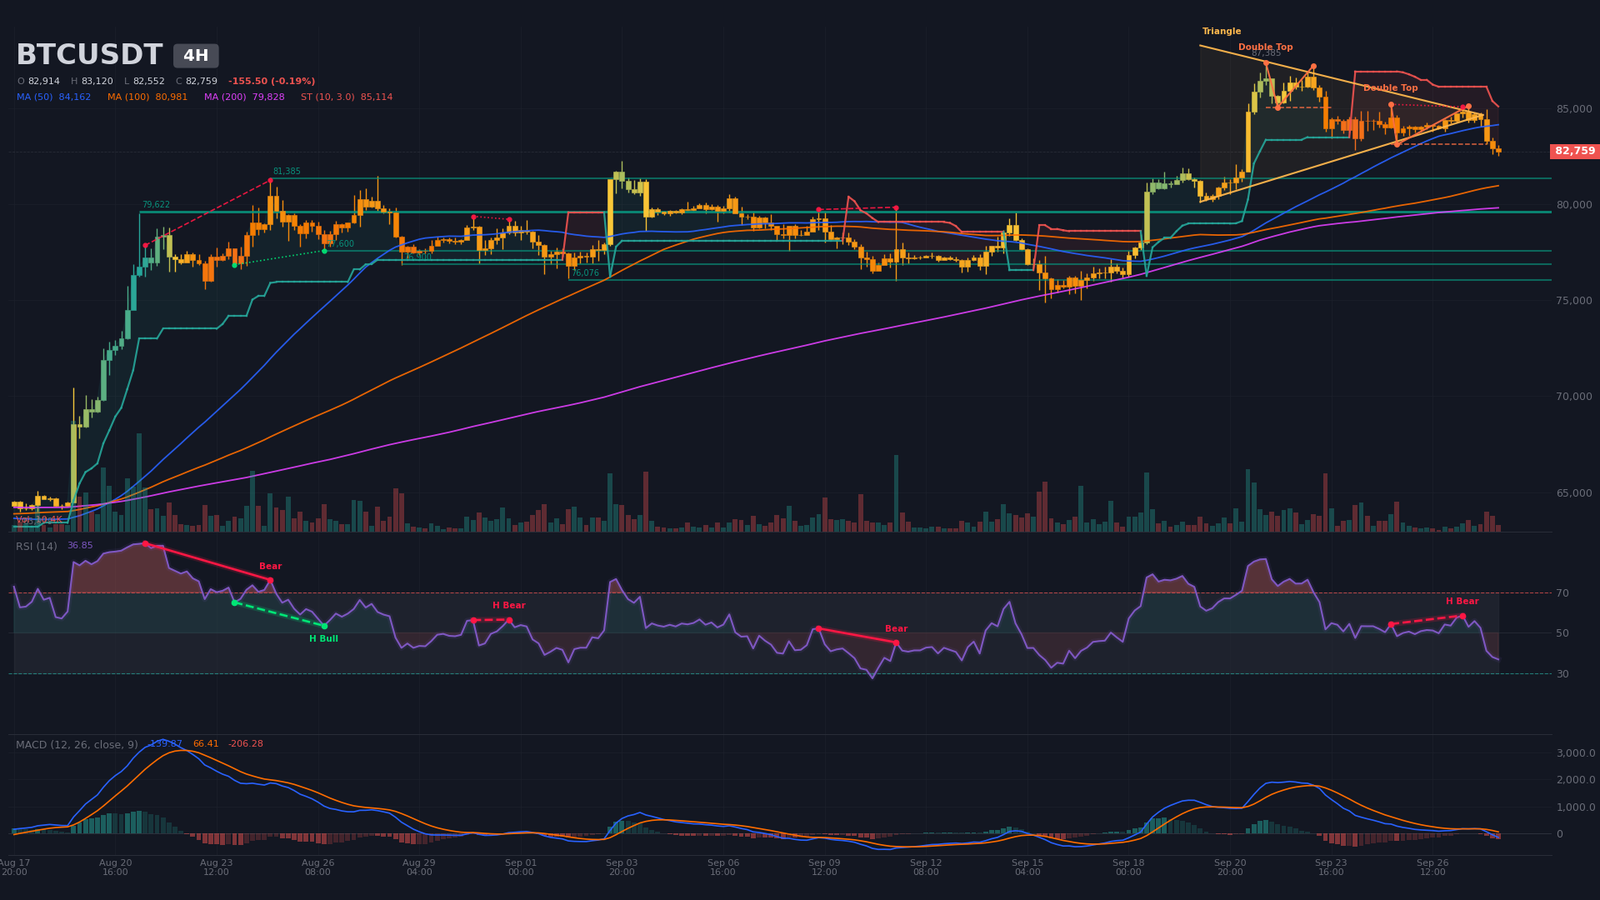
The dominant 4-hour structure is a confirmed bearish double top, in extension. Two tops have been detected by chartimg: a first double top, neckline at $85,080, last pivot September 23 at 04:00, target at $82,844 widely reached; a second double top, neckline at $83,130, last pivot September 27 at 12:00, target at $81,075, with remaining distance around 1.3%. A symmetric triangle was also detected from September 20 to 27, apex September 27 at 20:00, bounds $84,855 and $84,440, resolved to the downside.
The price at $82,759 trades below the SMA20 at $84,072 and the SMA50 at $84,162, but stays above the SMA200 at $79,828. The 4H MACD crossed below its signal line on September 27 at 20:00, three candles ago, with a histogram at -206 translating recent bearish dynamics. The RSI14 at 36.9 drifts away from neutral on the downside after topping at 76.7 on September 22. The 4H SuperTrend is now bearish at $85,114. Last candle volume at 10,410 represents 71% of the 20-period average, without capitulation flow. 4H supports step down at $81,385 (two touches), $79,622 (five touches, the most tested), $77,600, $76,900 and $76,076. The 4H validates the daily message of fading momentum and adds a chartist target at $81,075 reached at roughly 1.3%.
Intraday Structure (15m): Descending Wedge Resolved to the Downside
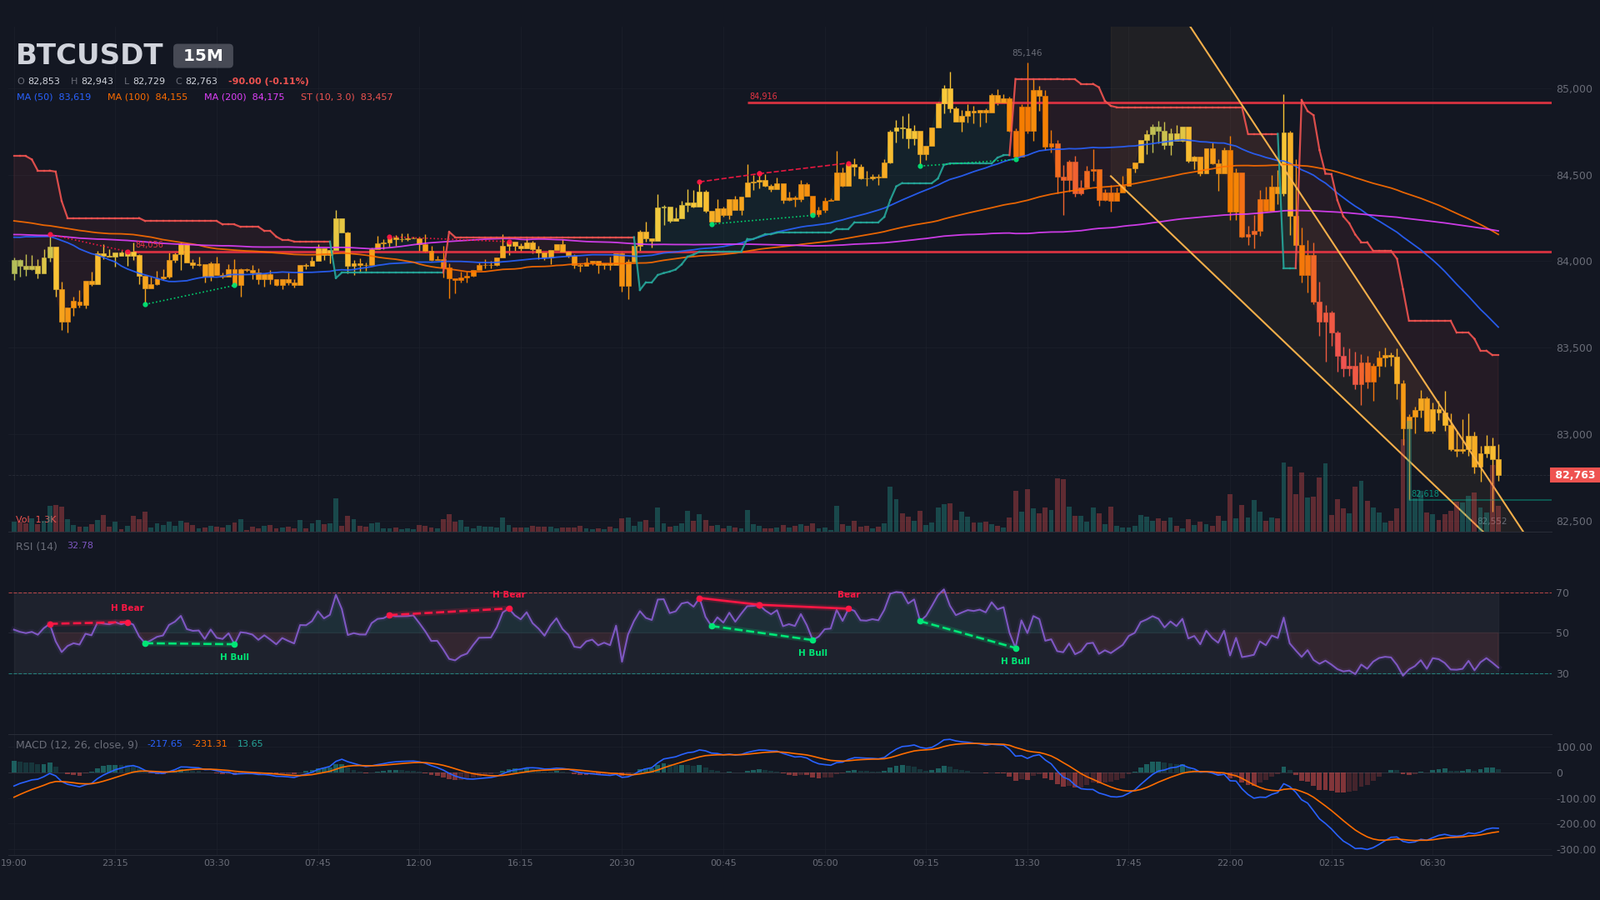
The dominant 15-minute structure is a descending wedge in bearish resolution. The chartimg detection bounds the pattern between $83,438 on the high side and $82,845 on the low side, with an estimated apex on September 28 at 13:09. The lower bound at $82,845 was broken as early as 08:15, and the intraday low at $82,551 confirms it. The price at $82,763 trades below the SMA20 at $83,049, the SMA50 at $83,619 and the SMA200 at $84,175, and a bearish 50/200 crossover was just recorded on September 28 at 04:00. The RSI14 at 32.8 enters moderate oversold, and the M15 MACD performed a bullish cross on September 28 at 06:00, histogram at +13.6, the first sign of seller exhaustion. Immediate support sits at $82,618, one touch. Resistances sit at $84,056 (eight touches, heavily tested) then $84,916 (five touches). The wedge now invites a test of the $82,200 – $82,600 zone before any recovery.
Multi-Timeframe Synthesis
The table below condenses the reading across the three timeframes analyzed: dominant trend, momentum (RSI14 and MACD) and main chartist pattern.
| Timeframe | Dominant Trend | RSI (14) | MACD | Chartist Pattern |
|---|---|---|---|---|
| Daily (1D) | Bullish (consolidation) | ~58 (retracement) | Bullish, contracting histogram | Double top (executed) + bullish bottom |
| 4-hour (4H) | Bearish (topping pattern) | ~37 | Recent bearish cross | Double top + triangle (resolved low) |
| 15 minutes | Bearish (wedge resolution) | ~33 (oversold) | Nascent bullish cross | Descending wedge broken to the downside |
Mapping of Technical Levels and Pivots
The method combines classic daily pivots, extensions from reference swings, liquidity concentrations drawn from the order book and liquidation estimates, and detected chartist patterns. The short-term central pivot is the $84,000 – $84,500 zone, matching the daily P pivot at $84,551 and the 4H SMA20/SMA50 area.
| Level | Price (USD) | Category | Technical Basis |
|---|---|---|---|
| Major Resistance 3 (R3) | $88,800 – $89,300 | Major resistance | Estimated short liquidation pocket $89,003 – $89,249 ($60M) + 2026 yearly open (~$88,700) |
| Major Resistance 2 (R2) | $87,200 – $87,700 | Major resistance | 4H swing high September 22 12:00 ($86,700) + short liquidation cluster $87,278 – $87,689 ($114M) |
| Immediate Resistance (R1) | $85,000 – $85,700 | Immediate resistance | 4H SuperTrend bearish $85,114 + daily R1 $85,028 + Cointelegraph offer $85,700 (>30M) |
| Central Pivot (P) | $84,000 – $84,500 | Pivot | Daily P pivot $84,551 + 4H SMA20/50 ($84,072 / $84,162) |
| Immediate Support (S1) | $82,200 – $82,800 | Immediate support | Daily support $82,282 (1 touch) + order book buy walls $82,640 / $82,722 (~$41M) + day low $82,551 |
| Major Support 2 (S2) | $81,000 – $81,600 | Major support | 4H support $81,385 (2 touches) + long liquidation pocket $81,367 – $81,613 ($78M) + 4H double top target $81,075 |
| Major Support 3 (S3) | $76,000 – $76,600 | Major support | 4H supports $76,076 and $76,900 (2 touches each) + long liquidation pocket $76,194 – $76,523 ($85M, densest below price) |
Order Book and Liquidity Heatmap
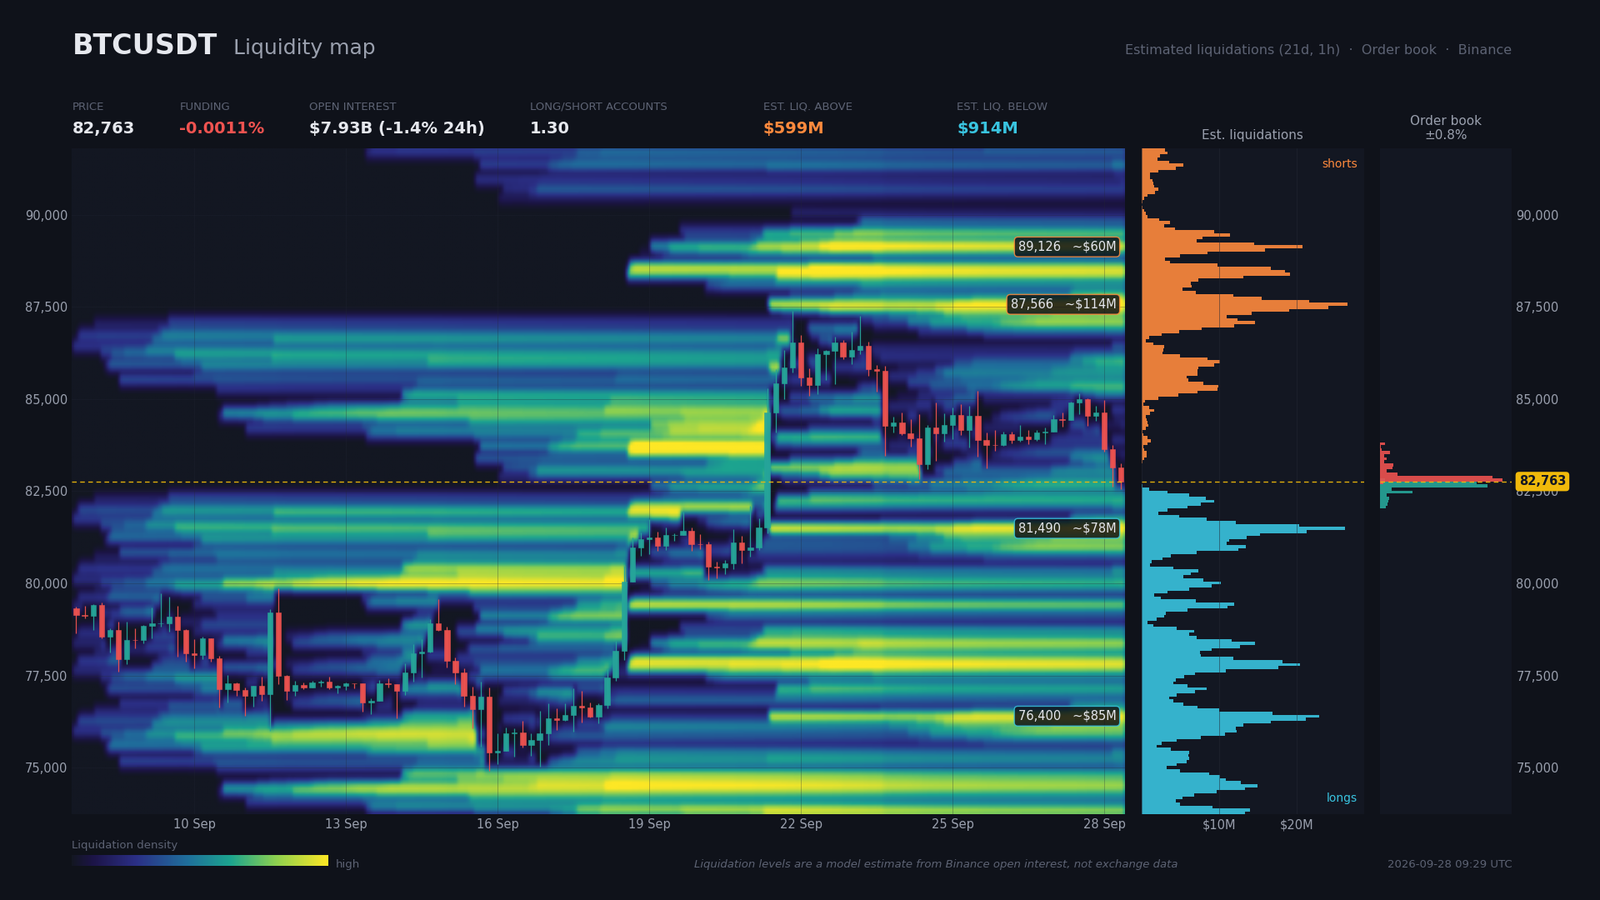
The aggregated Binance spot + perp order book shows a -4.4% selling imbalance on the ±2% band: $58.1M in bids vs $63.5M in asks, with coverage displayed at 83%. The main buy wall sits at $82,639.8 for $21.6M, 0.15% below price, followed by $82,721.9 at $19.5M. The main sell wall sits at $82,804.1 for $24.6M, 0.05% above price, followed by $82,886.2 at $22.6M. This configuration places the price at the heart of a narrow buyer-seller corridor, around $150 of usable spread, typical of an intraday indecision state.
On derivatives, perpetual funding sits at -0.0011%, i.e. annualized -1.2%, signaling a mild seller imbalance. Total open interest stands at $7.93B, down 1.36% over 24 hours and 14.22% over 7 days, a significant deleveraging that reflects the purge of unsupported long positions. The global long/short ratio is at 1.303 and the top trader ratio at 1.842, indicating that informed accounts remain structurally buyers. The 24h taker buy/sell at 0.91 confirms a net selling pressure.
The estimated liquidation pockets (model: 1h OI variation × typical 5x-100x leverage) are denser below price at $913M than above at $599M. On the long side, the nearest concentration is $81,367 – $81,613 for $78M, then $76,194 – $76,523 for $85M and $77,672 – $77,918 for $72M. On the short side, the major pocket is $87,278 – $87,689 for $114M, followed by $88,346 – $88,428 for $40M and $89,003 – $89,249 for $60M. The main risk is a liquidity sweep below S1 toward $81,400 before a technical rebound, with a secondary bearish magnet toward $76,500. A bullish squeeze would require reabsorption of the $599M in shorts above $87,300.
Calendar: Catalysts to Watch
The PCE core release on September 30 followed by NFP on October 2 can push Bitcoin out of its $82,000 – $85,000 range structure. A hot PCE and/or a strong NFP would confirm yield pressure and the selling dynamic; an in-line PCE and/or a weak NFP would revive the tactical rebound scenario.
- Tue. September 29, 16:00 (Zurich) – JOLTS: consensus 7.24M, previous 7.27M.
- Wed. September 30, 14:30 (Zurich) – PCE core m/m: consensus 3.7%, previous 3.7%.
- Wed. September 30, 14:30 (Zurich) – Final GDP t/t: consensus 6.4%, previous 3.6%.
- Thu. October 1, 16:00 (Zurich) – ISM Manufacturing: consensus 54.9, previous 54.6.
- Fri. October 2, 14:30 (Zurich) – NFP: consensus 84k, previous 162k; very low consensus, positive surprise likely if > 120k.
- Fri. October 2, 14:30 (Zurich) – Unemployment rate: consensus 4.1%, previous 4.1%.
Three Scenarios for the Coming Weeks
Three credible trajectories stand out over the next two to three weeks, hinging on the PCE/NFP macro verdict. The probability split is 40% / 35% / 25%, totaling 100%.
Scenario A – Sweep Below $82,500 Then Tactical Rebound (probability 40%)
Catalyst: break of the M15 wedge and the $82,200 – $82,600 zone, fueled by a hawkish PCE on September 30 or by a chain liquidation of spot and derivatives longs. Quantified trigger: 4H close below $82,000 and test of the $81,367 – $81,613 pocket with 4H RSI bullish divergence. Path: $81,200 toward $82,800 (daily S1), then $83,500 (4H SMA50) and $84,500 (daily P pivot) if strength returns. A validated break below $80,700 opens $79,600 (4H S3, five touches). Execution zone: $81,200 – $81,500. Invalidation: 4H close above $83,200 with 4H RSI > 45. Stop: $80,200 (~1.3×4H ATR14). Target 1: $82,800; Target 2: $83,500. R:R target 1 ≈ 1.4; R:R target 2 ≈ 1.9.
Scenario B – Range Compression $82,500 – $84,050 Until NFP (probability 35%)
Catalyst: late resolution and absorption of buy walls between $82,200 and $82,800, absence of directional catalyst before the October 2 NFP. Path: tight range between $82,500 (bottom) and $83,500 (top) with occasional attempts toward $84,050 (M15 resistance, eight touches). Exit to the upside on a weak NFP (< 80k) toward $84,500; exit to the downside on a strong NFP (> 130k) activating Scenario A. Execution zone: $83,400 – $83,700 (sell top of range). Invalidation: break of $82,200 (bottom) or $84,200 (top) on 4H close. Stop: $84,200 (~1×4H ATR14). Target 1: $82,800; Target 2: $82,200. R:R target 1 ≈ 1.5; R:R target 2 ≈ 1.9.
Scenario C – Failed Rebound and Acceleration Toward $76,000 – $77,600 (probability 25%)
Catalyst: daily close below the SMA20 at $80,634 and the S2 zone $81,000 – $81,400, combined with a strong October 2 NFP and 10-year US yields at 5.25%+. Path: $81,000 toward $79,600 (4H S3, five touches), then $76,500 (long liquidation pocket $85M). A break below $76,000 invalidates the daily bullish structure (loss of SuperTrend $78,263) and opens $74,900 (daily support 1 touch) then $70,400 (daily double top target). Execution zone: $79,700 – $80,000 (sell, reduced allocation). Invalidation: return above $82,800 on 4H close with 4H RSI > 50. Stop: $81,200 (~1.3×4H ATR14). Target 1: $77,600; Target 2: $74,900. R:R target 1 ≈ 1.7; R:R target 2 ≈ 2.8.
Summary and Conclusion
Bitcoin is living through a corrective pause within a structurally intact daily bullish trend. The dual reading – record ETF inflows at $2.4B weekly and YTD flows back in positive territory on one side, executed 4H double top and pullback below $83,000 on the other – calls for tactical patience rather than a conviction reversal. Institutional flows (ETFs and corporate treasury like Riot Platforms) confirm that any weakness should be seen as an opportunity as long as the daily SuperTrend at $78,263 holds. The PCE (September 30) then NFP (October 2) macro sequence will decide: an in-line PCE plus a weak NFP would revive Scenarios B then A to the upside; a hot PCE plus a strong NFP would activate the bearish Scenario C.
The dominant technical strategy consists of selling rebounds toward $84,500 – $85,700 (R1/R2) and buying dips on $81,000 – $81,600 (S2) with a stop below $80,000, keeping in mind that the daily ATR14 at $2,286 mandates a reduced size as long as the $80,000 – $85,000 range remains unresolved. Critical levels: $85,100 – $85,700 (4H SuperTrend plus daily R1 plus $30M offer) for a bullish break; $84,550 (P pivot) as the neutrality axis; $82,200 – $82,800 (daily support plus buy walls) for the swing toward S2; $81,000 – $81,600 (4H support plus liquidation pocket) as the tactical short target; $76,000 – $76,600 (densest liquidation pocket plus 4H supports) as the daily invalidation threshold.
Sources
- Bitcoin drops under $83K as liquidity hunting keeps bulls from targeting yearly open – Cointelegraph, 09/28/2026
- Bitcoin ETFs draw $2.4B in biggest inflow week since October 2025 – Cointelegraph, 09/28/2026
- Bitcoin ETFs turn positive for 2026 with $2.4 billion weekly inflow, their largest since October – The Block, 09/26/2026
- Bitcoin ETFs Notch Seven-Day Winning Streak as 2026 Flows Turn Green – Decrypt, 09/26/2026
- U.S. Treasury yields edge higher amid pressure on global government bonds – CNBC, 09/28/2026
- U.S., China to lower tariffs on $60 billion of goods – CNBC, 09/28/2026
- Trump, Xi wrap state visit centered on spectacle over substance – CNBC, 09/25/2026
- Over 101,000 crypto positions liquidated amid market volatility – Crypto Briefing, 09/28/2026
- Tokenized funds rise to $11.39 for every $100 in stablecoins – Crypto Briefing, 09/28/2026
- SEC Staff Says Token Buybacks Don’t Make Crypto a Security – Decrypt, 09/27/2026
- Riot Platforms repays $200M credit facility, releases collateral – Cointelegraph, 09/27/2026
- Ethereum shorts jump 13,000% – Is ETH laying out a $3K bear trap? – AMBCrypto, 09/28/2026
- Here are the 4 big things we’re watching in the stock market in the week ahead – CNBC, 09/27/2026
- Crypto ETF Options: The SEC Deadline on Sept 27 – CryptoTicker.io, 09/24/2026
Disclaimer: This article is for educational and informational purposes only. It does not constitute investment advice, a recommendation to buy or sell, or an invitation to trade any financial asset. Cryptocurrency markets are extremely volatile; any investment decision should be based on your own research (DYOR) and, where appropriate, the advice of a licensed financial adviser.

