


On September 19, 2026, Bitcoin is trading at $81,192 after printing a local high of $82,389, currently compressing beneath the macro supply zone of $82,000–$84,000. The asset is going through a major structural transition: the daily chart has just confirmed a Golden Cross between the 50- and 200-day moving averages, sealing the definitive exit from the multi-month accumulation base of $58,000–$64,000 that formed after the prior bull cycle’s blow-off top at $126,000.
On the 4-hour timeframe, earlier bearish divergences have been fully absorbed thanks to an aggressive defense of the $76,200 support, while the 15-minute microstructure is consolidating within a high-quality bull flag. Positioning in derivatives markets and order-book depth reveal a strong operational asymmetry: a short-liquidation ladder stretches from $81,800 to $86,000, coinciding precisely with the average break-even level of US spot Bitcoin ETFs at $86,000.
A confirmed breakout above the $82,400 resistance could trigger a mechanical unwind of stop-loss orders and forced short covering, potentially propelling the asset toward $86,000 before targeting the sell-side liquidity wall identified at $96,000. The directional bias remains bullish as long as the $79,800–$80,000 pivot holds on intraday closes; a break below this threshold would not invalidate the underlying trend, but would trigger a temporary flush toward the thick institutional buy-order floor located between $76,500 and $77,400 — a level that matches the average entry price of active investors.
Daily macro setup and the Golden Cross deployment
The daily timeframe confirms a technical regime shift after several months of post-all-time-high distribution. The long horizontal compression phase observed between May and August 2026 transferred coins from weak hands to institutional entities, drying up floating sell-side liquidity. The vertical acceleration seen in late August broke the pattern of descending highs, pulling the price back into the upper half of its annual range.
The dominant technical signal remains the formal execution of a Golden Cross: the 50-day moving average has crossed above the 200-day moving average in the $79,500–$80,200 zone. This alignment turns the 200-day MA — which had capped every rally since the start of summer — into a long-term structural support floor, a signal that mechanically triggers positive reallocations within index-tracking and trend-following funds.
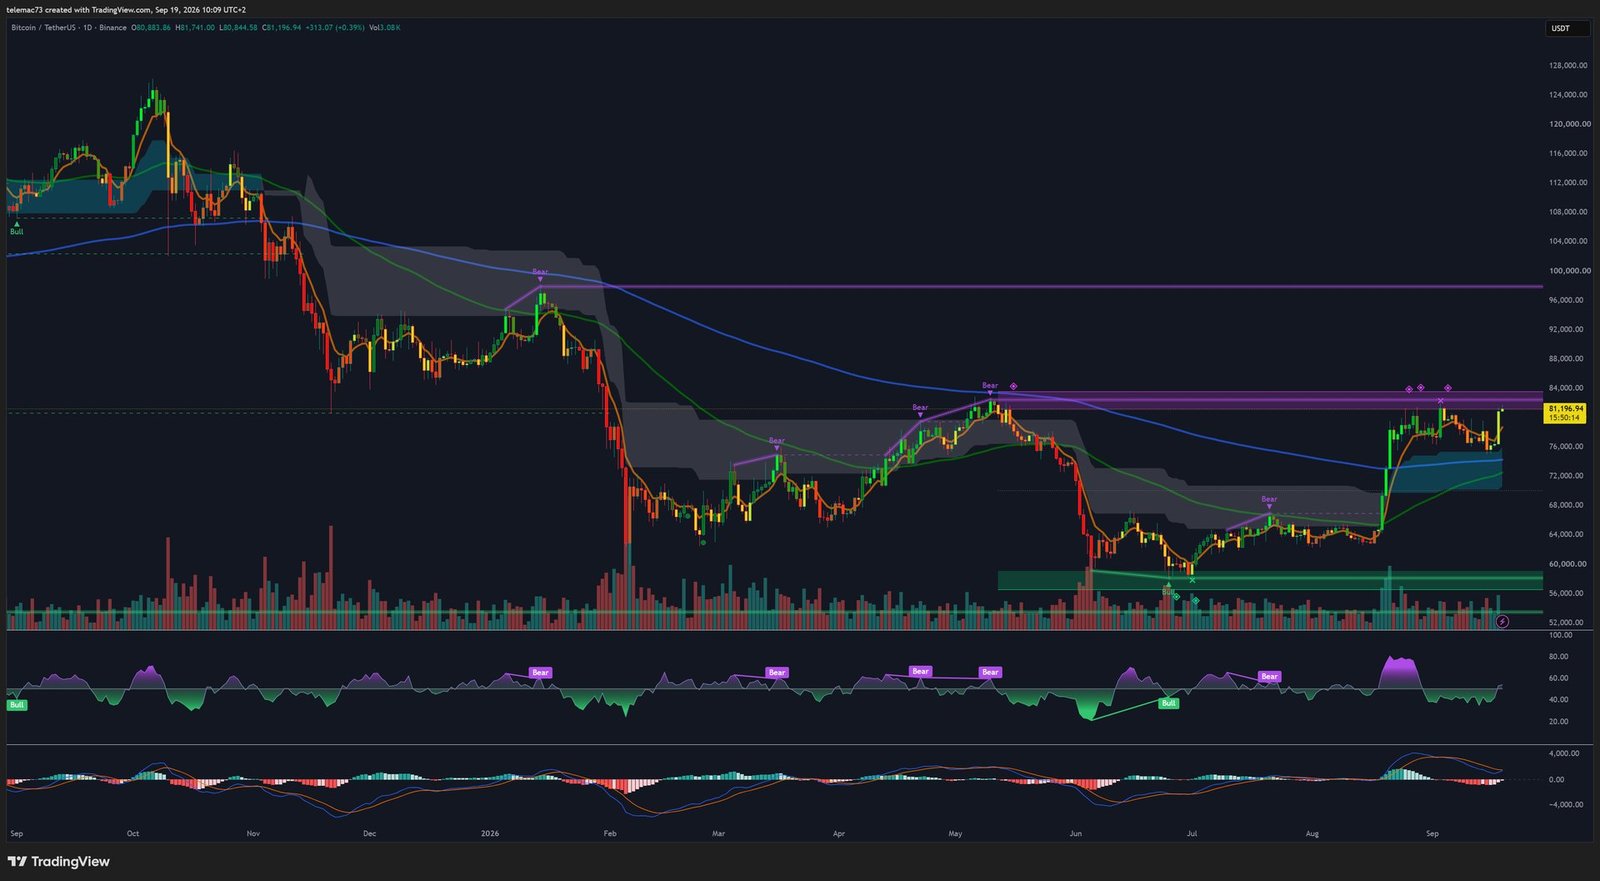
The daily RSI stands at 67.5, reflecting powerful directional momentum without reaching the critical overbought zone above 80. The MACD (12, 26, 9) shows a substantial positive gap between its two lines, backed by a green histogram in continuous expansion above the zero line. This confluence of indicators confirms that the current advance is not a mere relief bounce, but the opening impulse of a new trend phase. The market is currently testing the supply band between $82,000 and $84,000, which corresponds to the 38.2% Fibonacci retracement of the major corrective wave; acceptance above this level would open a low-resistance corridor toward $96,000.
Intermediate (4H) dynamics: momentum divergence resolved
On the 4-hour scale, price structure has been organized around an expansion channel bounded by support at $76,000 and a ceiling at $82,389. On the initial contact with this level, the 4H RSI reached an extreme reading of 82.5, generating a marked bearish divergence on the chart. This friction triggered an orderly pullback toward the demand zone at $76,200–$76,600, precisely tagging the 4H 50-period moving average and the support band.
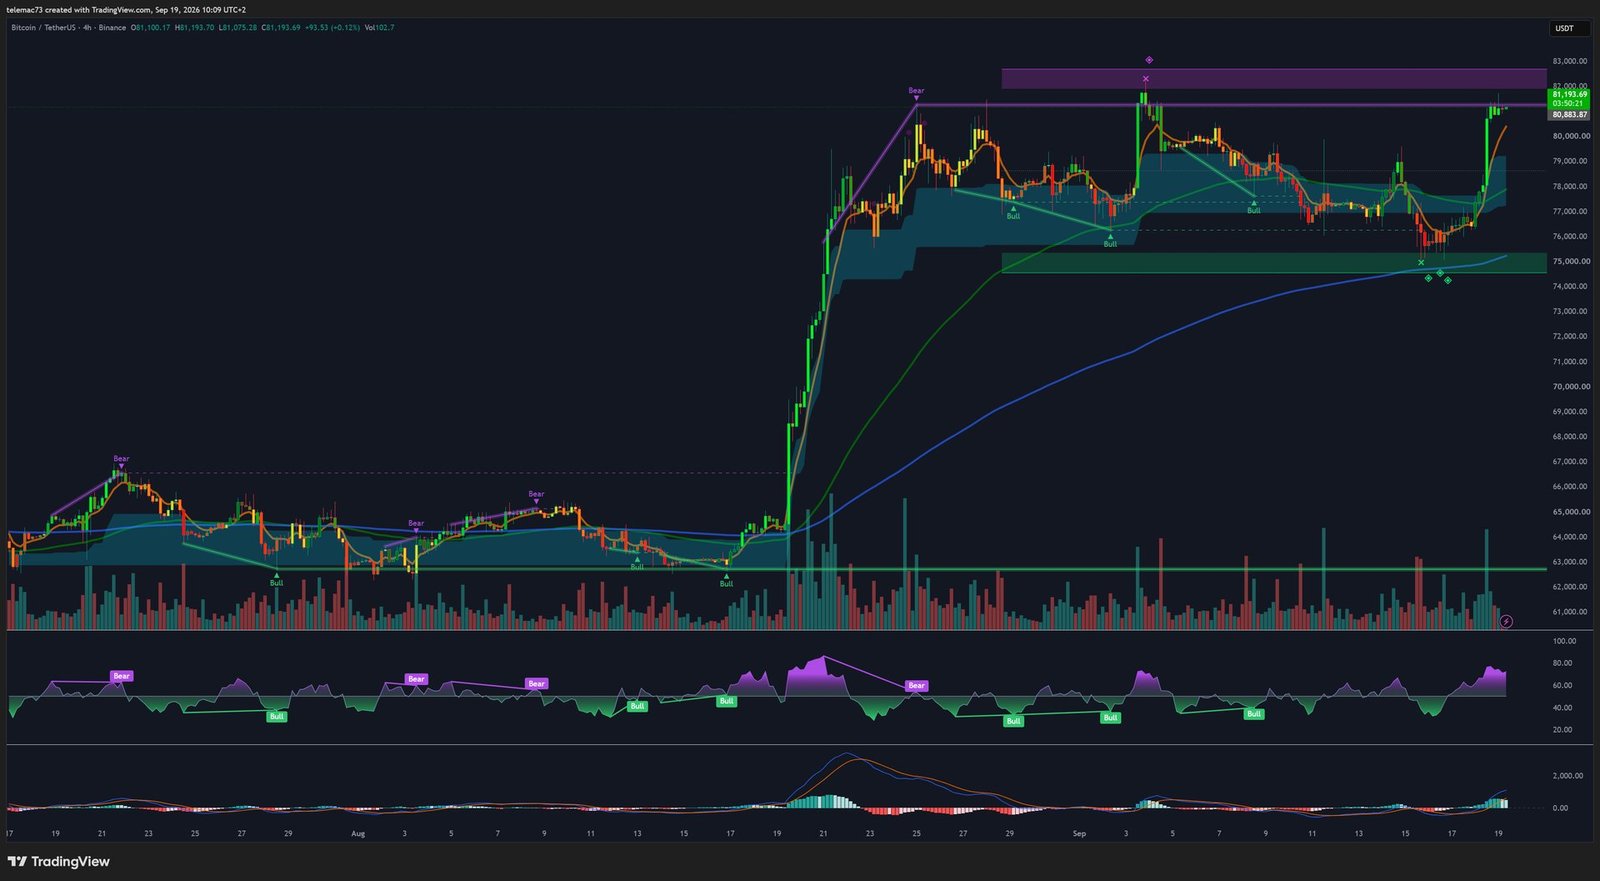
The defense of this zone demonstrated the aggressiveness of buy-side flows: the dip was bought back immediately in a V-bottom formation, quickly returning price to current levels. This pullback served a healthy purpose, flushing out excess accumulated leverage. The 4H RSI, having retraced to the 40-point floor, bounced to settle at 68.5 without forming a fresh bearish divergence on the second approach to $82,000 — a sign of a more solid advance, driven by increased spot participation. The 4H MACD confirms this momentum recovery with a clean bullish crossover above its neutral line. The central technical pivot for this timeframe locks in at $80,000: as long as 4H candles close above this level, market structure retains higher lows and higher highs.
Intraday (15-minute) microstructure: bull-flag compression
On the 15-minute horizon, the market has shifted from an impulsive expansion phase to an orderly compression phase. After a vertical impulse that propelled price from $77,200 to $81,500 on strong buying volume, the market stabilized sideways in the shape of a bull flag, bounded by horizontal resistance at $81,600 and an ascending diagonal support whose immediate floor sits at $80,850.
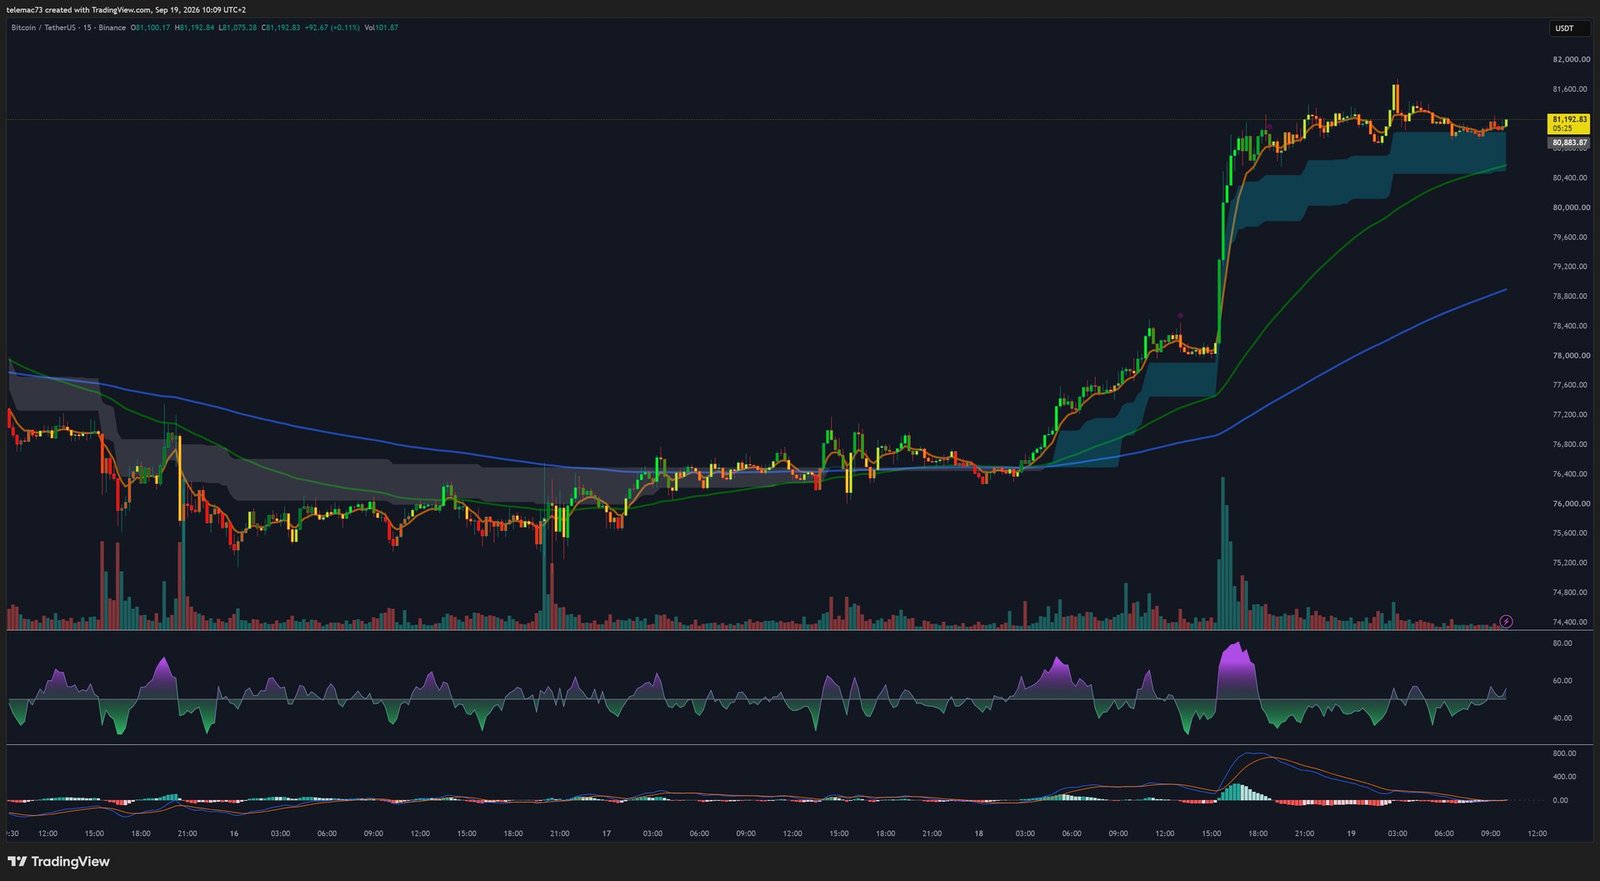
Intraday oscillator behavior reflects a passive absorption dynamic: after the 15M RSI hit severe overbought territory above 84 during the initial thrust, sideways candle drift brought the indicator back into an equilibrium range of 54–58 without giving up meaningful price retracement. This ability to neutralize overbought conditions through time rather than through a price correction confirms the presence of an order book passively absorbing profit-taking. A 15-minute close above $81,600 would serve as the trigger signal for an immediate impulsive continuation.
Order-flow mapping and liquidation reservoirs
The BTC/USDT order-book heatmap clearly exposes the structure of dormant and active liquidity. A substantial accumulation of buy limit orders is stacked in a staircase pattern between $76,000 and $78,500, with maximum density between $76,350 and $77,000 — a level that coincides with the average entry price of active investors and the point of control (POC) of recent weeks’ volume. This continuous liquidity cushion guarantees massive absorption in the event of an unexpected correction.
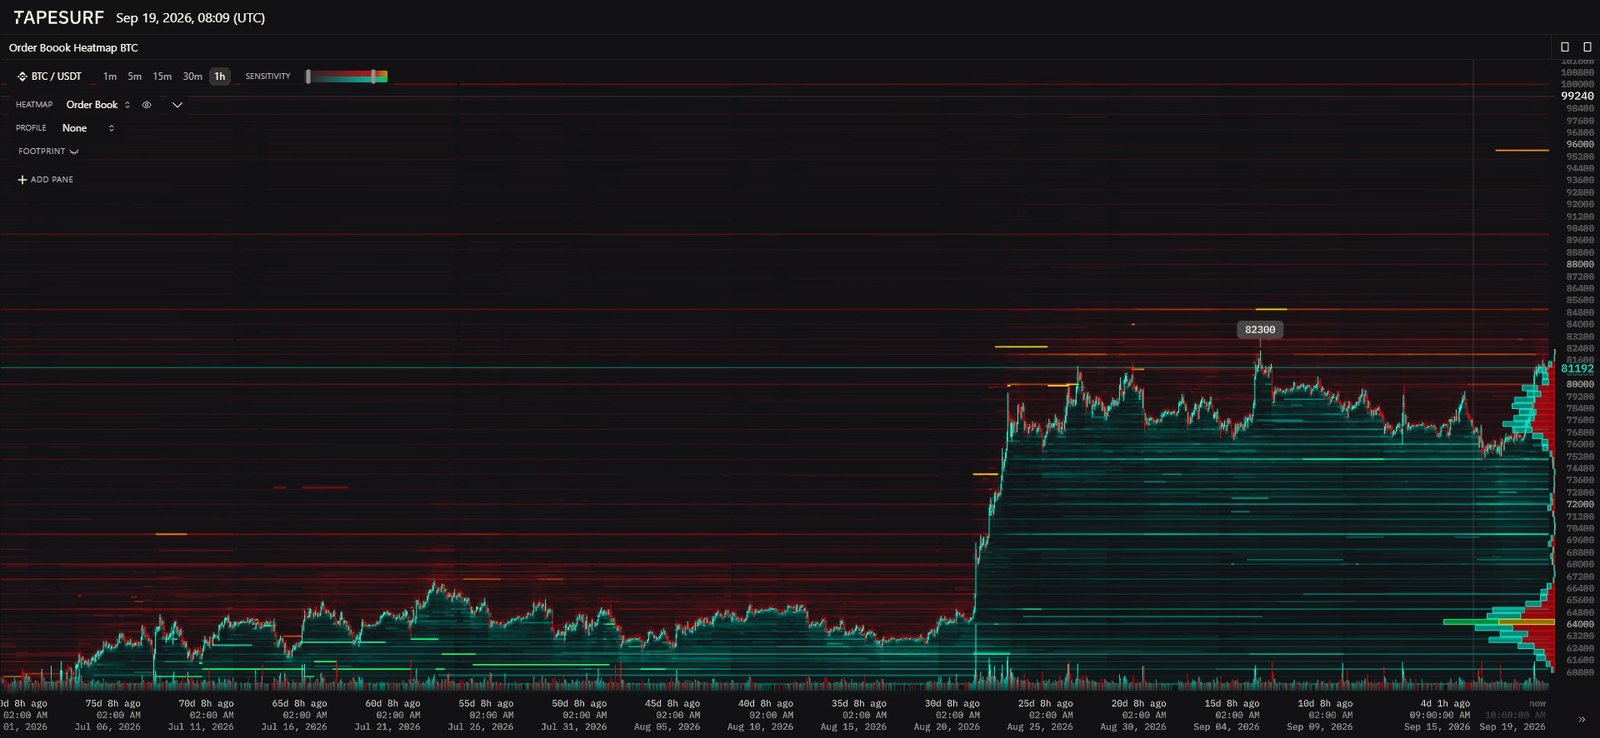
Above the current spot price, the order book reveals a relative scarcity of sell orders up to the immediate vicinity of the local peak at $82,389. Beyond that, the heatmap highlights a void of major orders up to $96,000–$99,249, just below the $100,000 psychological cap. The short-liquidation ladder between $82,000 and $86,000 has grown 21% in volume since mid-August, representing the densest cluster of modeled liquidations across the entire curve. Conversely, long-position liquidations are dispersed below $79,800 and then below $76,000, with their major structural cluster not appearing until $60,000–$64,000. This distribution asymmetry favors a mechanical pull of price to the upside.
| Key level | Structural role | Technical implication |
|---|---|---|
| $99,249 – $100,000 | Major psychological resistance | Sell-order wall on the heatmap |
| $96,000 – $97,500 | Resistance / extended target | Concentrated sell-side liquidity wall; cycle Golden Pocket |
| $86,000 | Institutional pivot resistance | Aggregate break-even level of US spot ETFs |
| $82,000 – $82,389 | Immediate resistance | 4H channel ceiling; short-liquidation cascade trigger |
| $80,000 – $80,500 | Central operational pivot | Corporate treasury cost basis; 4H support |
| $76,500 – $77,400 | Major structural support | Institutional absorption base; 4H 50-MA |
| $74,000 – $75,000 | Secondary support / floor | Critical invalidation threshold |
| $60,000 – $64,000 | Macro base | Long-term accumulation base |
Macro backdrop and institutional profitability
The technical picture finds confirmation in the mid-September 2026 macro backdrop: the Federal Reserve raised its policy rate by 25 basis points, bringing the target range to 3.75%–4.00%, while the Bank of Japan tightened policy to 1.25%, a multi-decade high. A narrow 49–50 Senate vote against the CLARITY Act also triggered a wave of transient volatility that briefly pushed Bitcoin down to test $75,800.
The market’s ability to absorb this synchronized monetary tightening without giving up its $76,000 support reflects a structural shift in demand, fueled by renewed net inflows into US spot Bitcoin ETFs — $433 million over a handful of sessions, including $159.5 million pulled in by BlackRock’s IBIT fund alone. The aggregate acquisition price for the entire spot ETF complex is estimated at $86,000; this cohort spent 228 consecutive sessions underwater relative to that break-even level, with unrealized losses peaking at $18 billion in February 2026 before shrinking to $3.9 billion on the recent move through $81,000. Corporate treasury cost basis, meanwhile, sits at $80,500; with price now trading above this marker, corporate balance sheets have flipped back into positive territory, easing the risk of distressed selling.
Directional scenarios and critical thresholds
Short-term price behavior hinges on how the compression resolves between the 15-minute flag boundaries ($80,850–$81,600) and the $82,389 ceiling. Two paths stand out.
Bullish expansion scenario (primary): a volume breakout above $81,600, followed by a 4H close above $82,400, would trigger forced liquidation of short positions accumulated between $82,000 and $86,000. The move would find an intermediate waypoint at $84,000, before reaching the spot-ETF neutrality threshold at $86,000, then the liquidity wall identified at $96,000, coinciding with the cycle’s Golden Pocket retracement at $97,540. This immediate impulse would be invalidated by a confirmed break below $79,800.
Extended consolidation scenario (alternative): a fresh rejection at the $82,000–$82,389 test, marked by a break below $80,850 and then below the $80,000 pivot, would trigger a hunt for long-side liquidity toward $78,700–$79,000, followed by a retest of the $76,500–$77,400 absorption base. This breather would not alter the underlying bullish trend driven by the Golden Cross, but would impose a prolonged sideways accumulation phase. Only a clean, confirmed break below $74,000 would call the bullish macro structure into question.
The alignment of the daily Golden Cross, the bullish resolution of 4H divergences, and the flag-shaped compression on the 15-minute chart together point to a technical dominance of buy-side flows. Bitcoin’s resilience against internationally synchronized monetary tightening, combined with the massive return of net spot-ETF inflows, confirms that the asset is now operating under a liquidity-expansion regime. Once the $82,400 lock gives way under the pressure of a short unwind, the pull of price toward the institutional equilibrium at $86,000 could serve as the catalyst driving toward the higher liquidity pools established at $96,000.
Disclaimer: this article is intended for educational and informational purposes only. It does not constitute investment advice, a recommendation to buy or sell, or an inducement to trade in financial markets. Cryptocurrencies are highly volatile and risky assets. Do your own research (DYOR) and consult a licensed financial advisor before making any investment decision.

