


After a summer marked by tight consolidation, Bitcoin (BTC/USDT) has just delivered a major technical breakout. The exit from a compressive bearish channel, confirmed by a sharp expansion in volume, is reshaping the picture across every timeframe — from the daily chart down to intraday microstructure. Here is a full breakdown of the current market structure, order-book liquidity map, and the scenarios to watch over the coming sessions.
Macro structure and daily dynamics (1D)
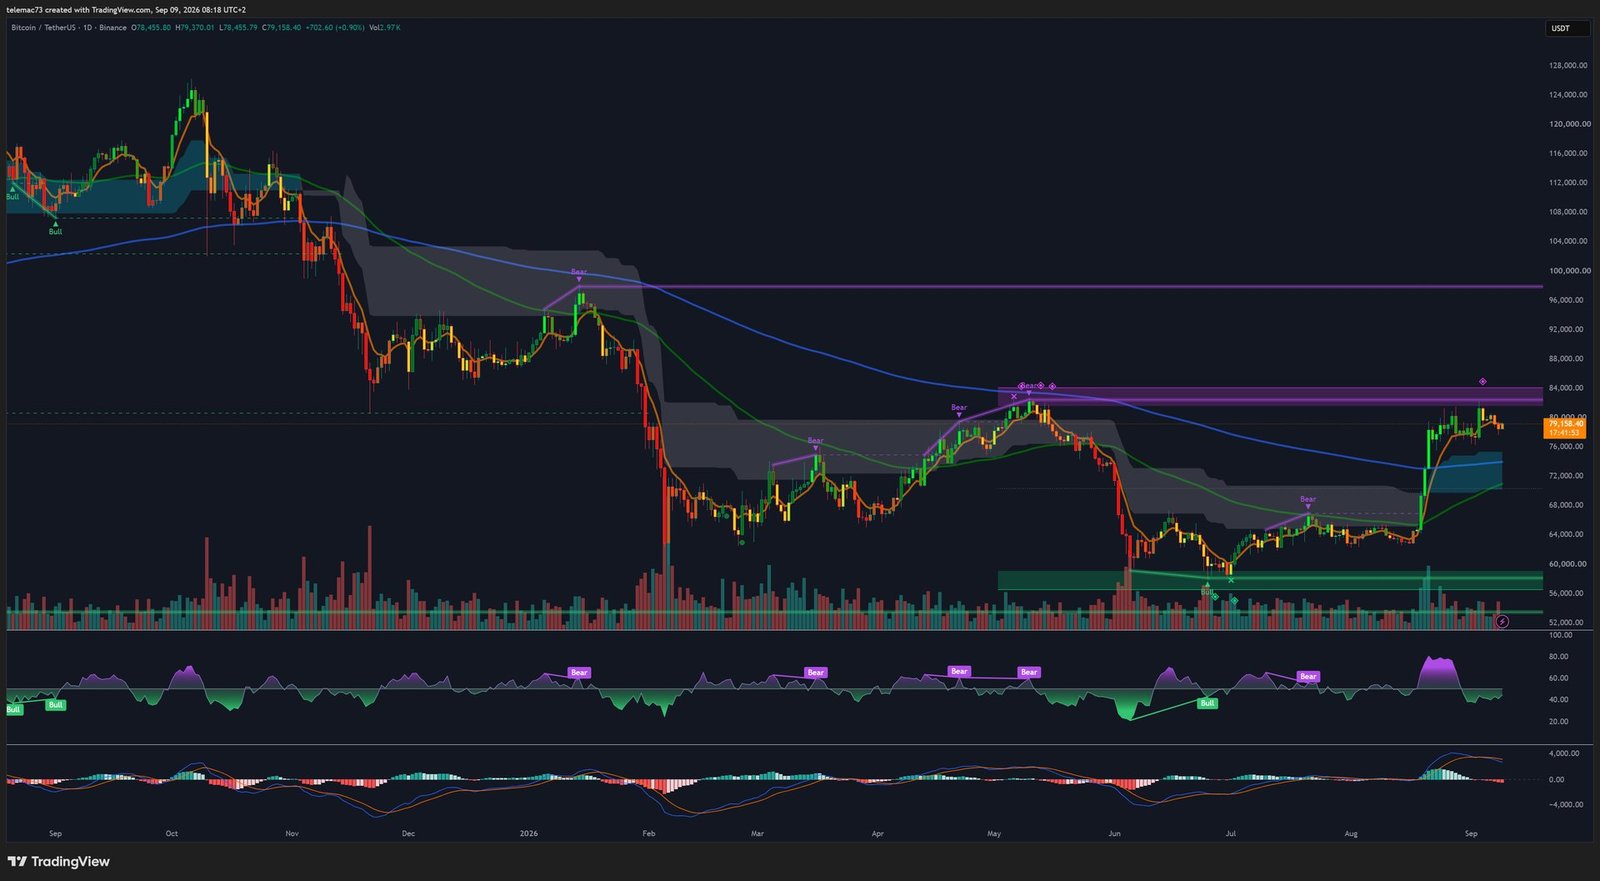
The daily chart reveals a first-order structural shift: the interruption of a long descending correction phase in favor of an impulsive expansion cycle. After consolidating over the summer months inside a descending wedge and a compressive bear channel, price found support on an institutional accumulation base delimited between $57,800 and $60,000. The breakout above this zone materialized through an exceptionally large candle marked by very strong volume expansion, successively piercing short-term intermediate resistances and driving price into direct contact with the long-term moving average (blue curve, comparable to the 200-period moving average). This major moving average, whose slope is starting to flatten near the $80,000 area, now stands as a decisive dynamic pivot for confirming the secular regime change.
The Relative Strength Index (RSI 14) on the daily timeframe sits at 64.0 points. This reading reflects a vigorous return of momentum after exiting the deep oversold zones seen at the summer lows. The RSI’s break above the 50-point midline confirmed the invalidation of underlying selling pressure, without yet pushing the asset into extreme overbought territory beyond 70 points — leaving meaningful technical room to run before saturation. At the same time, the MACD confirms this flow rotation through a pronounced bullish crossover (Golden Cross), accompanied by a clean crossing of its zero line and a substantial expansion of the histogram bars into positive territory.
The daily chart’s geometry highlights a major horizontal resistance zone, formed by a historic distribution block between $82,000 and $84,000. This level, which previously acted as a support floor before being broken during an earlier liquidation phase, now functions as a rigid technical ceiling. Beyond this boundary, the structure offers no substantial volumetric obstacle before the pivot level at $96,000. On the downside, the $64,000–$66,000 zone, combined with the $57,800 thermal floor, represents the macro-structural safety base whose preservation remains the essential condition for sustaining the bullish dynamic.
| Technical parameter | Daily (1D) | 4-hour (4H) | 15-minute (15M) |
|---|---|---|---|
| Directional bias | Impulsive bullish | Bullish consolidation | Bullish momentum recovery |
| RSI (14) | 64.0 (healthy dynamic) | 52.0 (neutral cooling) | 62.5 (out of oversold) |
| MACD configuration | Golden Cross validated below zero line | Bearish cooling-off crossover | Active intraday Bullish Cross |
| Moving averages | Testing the long-term 200 MA | Holding above the 4H 50 EMA | Fast/slow Micro Golden Cross |
| Chart pattern | Break of a descending channel | Bull Flag | Liquidity sweep and V-bottom |
| Volume profile | Strong expansion on the breakout | Contraction within the range | Institutional absorption spike |
Bullish flag consolidation: the 4-hour picture
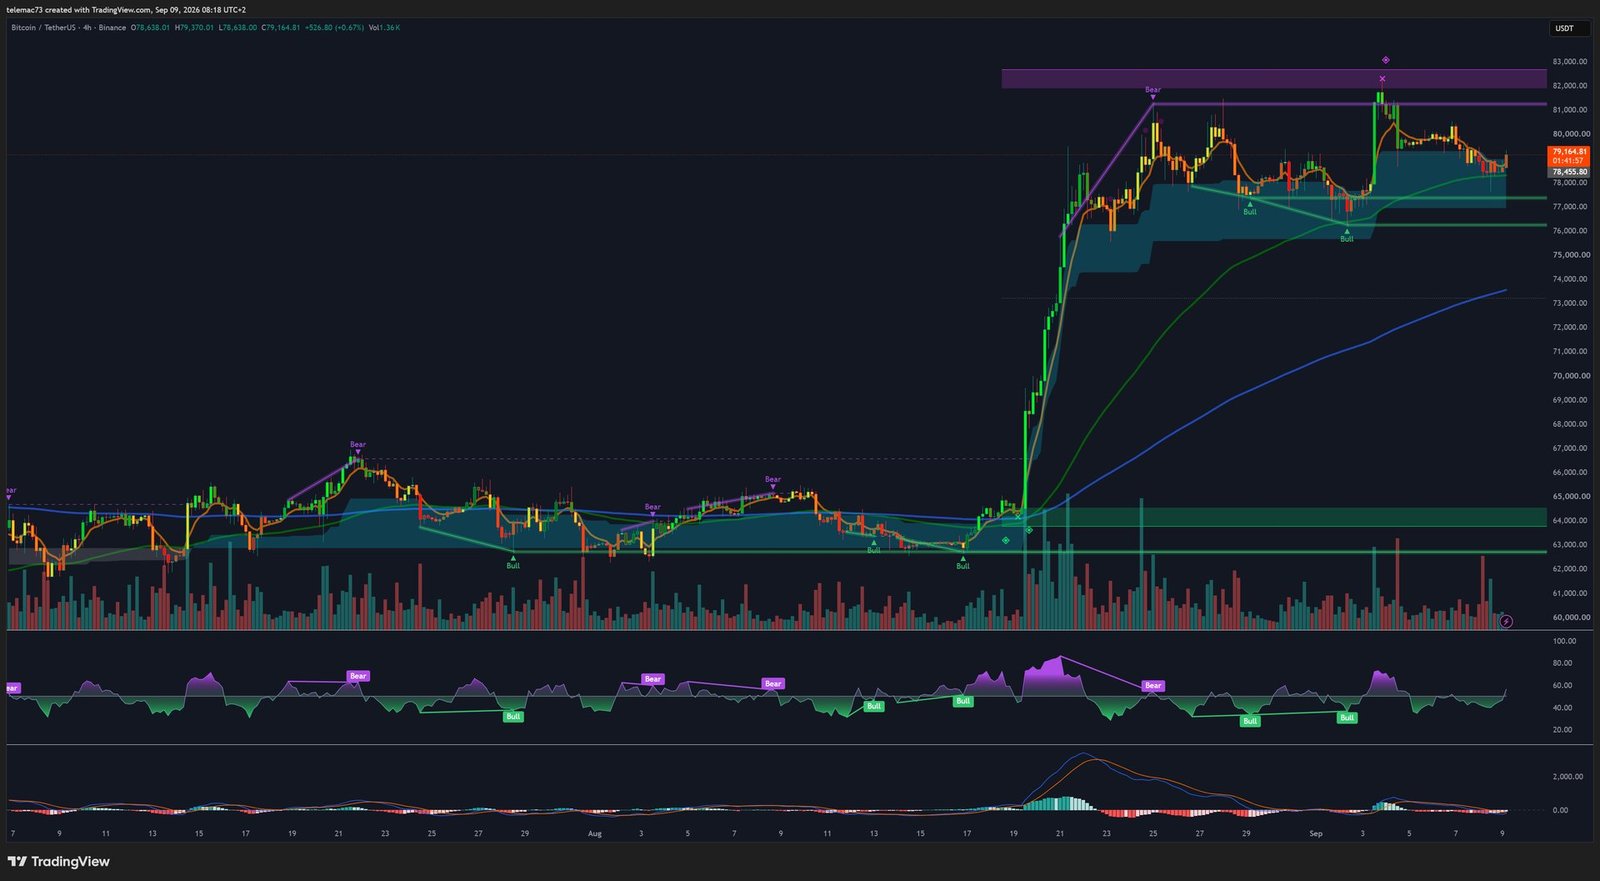
On the 4-hour timeframe, price action is building a classic continuation pattern in the form of a bullish flag (Bull Flag) or a horizontal compression rectangle. After the initial vertical rally that carried price from the $64,000 pivot up to a local top at $82,300, the market entered an orderly drift phase. This pause is organized between an upper boundary at $81,500–$82,300 and a lower boundary at $77,000–$77,200. The gradual decline in trading volume observed along this horizontal channel shows an absence of aggressive selling from large players, reflecting a passive absorption of profit-taking rather than active distribution.
The 4H RSI illustrates this momentum rebalancing process perfectly. After reaching a marked overbought threshold of 85 points during the initial attack on resistance, the indicator traced a steady bearish divergence — lower highs against stable prices — driving a methodical retreat toward the 50-point pivot line. Currently at 52.0 points, the RSI has fully purged its prior excess while maintaining a structure of rising lows, placing the oscillator in an optimal window to welcome a new buying wave.
The arrangement of moving averages on this timeframe reinforces this case for structural resilience. The fast moving average (green curve, comparable to the 4H 20/50 EMA) has aligned just below current price, acting as a dynamic cushion within the $78,500–$79,000 range. Meanwhile, the slow 4H moving average (blue curve) retains a particularly steep upward slope, gradually climbing toward $73,500. For its part, the 4H MACD is registering a technical bearish crossover following the exhaustion of the impulse leg, but the progressive convergence of its signal lines and the contraction of the red histogram bars near the equilibrium line suggest a momentum reversal is imminent.
Intraday microstructure: the 15-minute liquidity sweep
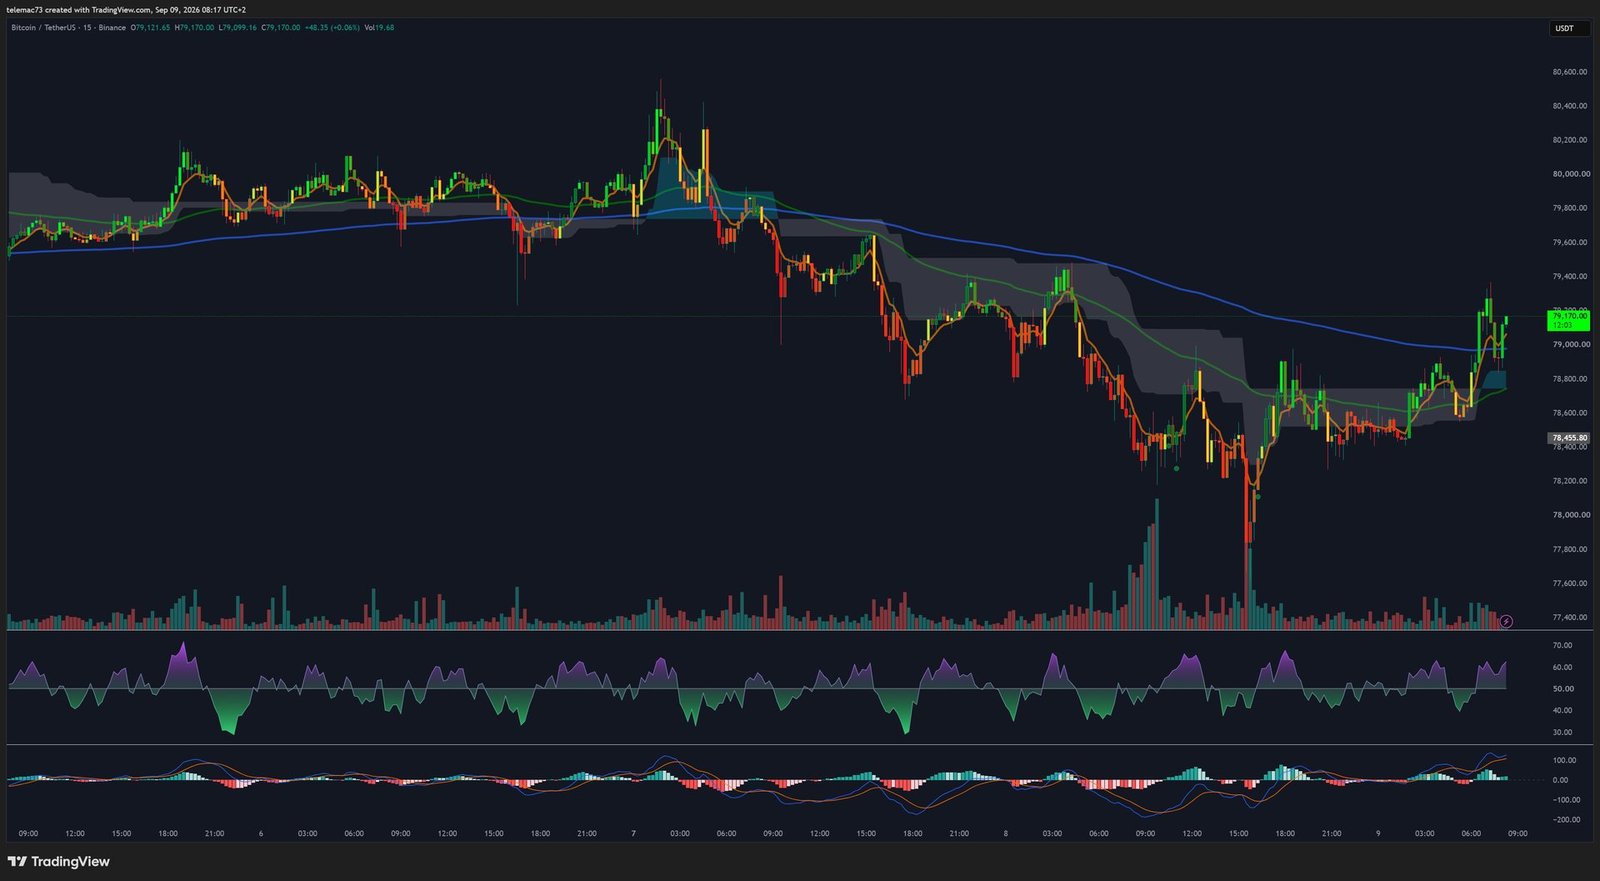
Analysis of the 15-minute intraday timeframe offers a precise read on short-term liquidity transfer mechanics. The gradual slide from the local peak at $80,500 concluded with an abrupt downward acceleration, deliberately piercing the local support at $77,500 to probe lows at $77,200. This calculated dip allowed market makers to execute the stop-sell orders stacked below this boundary before triggering a lightning-fast reintegration above $78,000, forming a liquidity sweep (Liquidity Sweep) capped by a V-shaped bottom (V-Bottom). This absorption move was accompanied by a particularly sharp isolated volume spike on the exhaustion wick, confirming the presence of institutional limit buying.
- The 15M RSI, which had collapsed into extreme oversold territory below 25 points during the drop toward $77,200, quickly regained the 62.5-point zone without printing an exhaustion divergence.
- Intraday moving averages confirmed a bullish micro-crossover (Micro Golden Cross), with the fast EMA crossing above the slow EMA, reinforcing an immediate upward bias toward local resistances.
- The 15M MACD pulled out of negative territory via a clean bullish crossover, its histogram bars expanding into green territory to support the push toward the psychological $80,000 threshold.
| Operational level | Price (USDT) | Structural significance and confluences |
|---|---|---|
| Macro resistance R3 | 96,000 | Major extension of the daily impulse leg and secular distribution level |
| Major resistance R2 | 82,300 – 84,000 | Upper boundary of the 4H flag and passive sell-wall on the heatmap |
| Local resistance R1 | 79,800 – 80,200 | 15M intraday breakout threshold and intermediate order-book barrier |
| Equilibrium pivot (P) | 78,800 – 79,200 | Current price, confluence of the 4H 50 EMA and the neutral volume-profile zone |
| Local support S1 | 77,000 – 77,200 | Base of the 4H flag and V-bottom liquidity sweep zone |
| Intermediate support S2 | 73,500 – 74,000 | Alignment with the 4H slow moving average and former breakout high |
| Macro support S3 | 64,000 – 65,000 | Origin of the 1D bullish impulse and major thermal absorption wall |
Liquidity map: reading the order-book heatmap
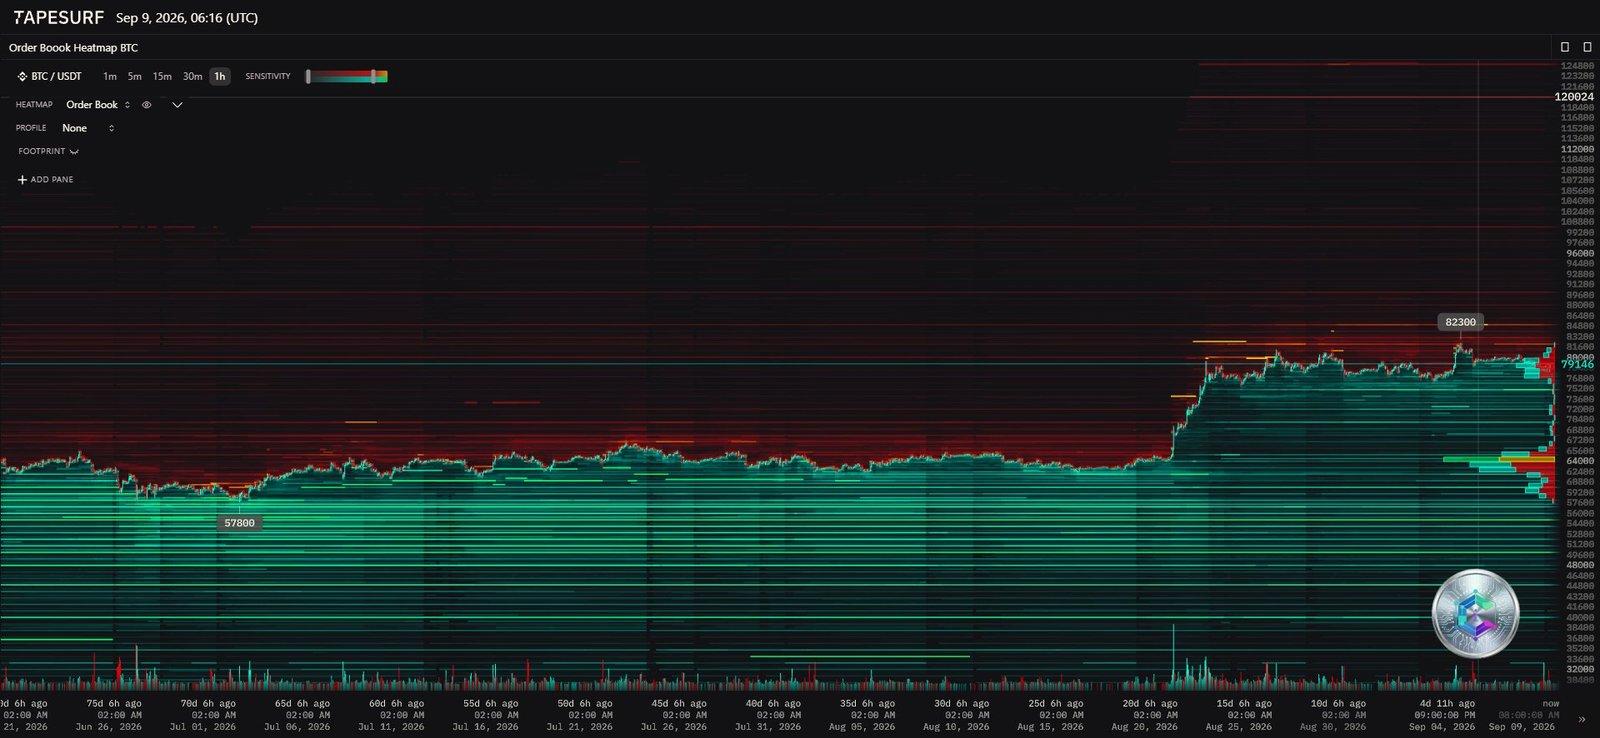
The order-book heatmap makes it possible to read the structure of passive limit orders, revealing the tactical positioning of major players. Above current price, a major sell wall (Ask Wall) has consolidated with remarkable clarity around $82,300. This intense red band of passive liquidity aligns tightly with the top of the 4H flag and the daily rejection zone, forming a barrier meant to slow impulsive breakouts absent institutional spot volume. Beyond this zone, the book shows a relative scarcity of sell orders up to the upper macro block near $128,024, hinting at a supply vacuum capable of fueling a vertical acceleration once the $82,300 level is absorbed.
Below current price, the thermal structure exposes a particularly dense, tiered defense on the passive buy side (Bid Walls). A first solid green support tier sits between $77,000 and $77,500, confirming that the 15M intraday pullback tested the upper edge of this liquidity zone with precision before being rejected higher. Further down, an exceptionally thick continuous green band locks in the $64,000 level, forming a genuine institutional liquidity floor in confluence with the daily breakout base. Finally, the thermal marker at $57,800 recalls the position of the original accumulation floor where strong hands secured their massive exposure at the end of summer. The current price compression, oscillating around $79,166–$79,200 between passive demand at $77,000 and the sell wall at $82,300, forms a setup conducive to triggering a forced short squeeze.
| Thermal zone | Price range (USDT) | Order type | Operational impact on the book |
|---|---|---|---|
| Ultimate sell zone | 128,000 – 128,024 | Macro limit sell orders | Theoretical very long-term target of the expansion cycle |
| Active sell wall | 82,000 – 82,300 | Concentration of Ask orders | Immediate rejection barrier; squeeze catalyst on a break |
| Neutral trading band | 78,500 – 80,000 | Intraday equilibrium liquidity | Current oscillation zone and tactical flow absorption |
| First demand tier | 77,000 – 77,500 | Concentration of Bid orders | Immediate passive support that validated the intraday bounce |
| Major absorption wall | 64,000 – 65,000 | Thick layer of buy orders | Base of the daily impulse and institutional structural rampart |
| Fundamental thermal floor | 57,800 | Secular buy-side liquidity layer | Whale accumulation level and macro capitulation threshold |
Macroeconomic backdrop and institutional flows
The evolution of technical momentum coincides with a series of major fundamental catalysts driving capital behavior globally. Recent U.S. economic releases, particularly the Non-Farm Payrolls report, showed the creation of 142,000 non-farm jobs in August against 160,000 expected, alongside a combined downward revision of 86,000 jobs for June and July. While the drop in the unemployment rate to 4.2% rules out an immediate slide into recession, this orderly economic slowdown has firmly cemented expectations of a Federal Reserve policy pivot. Market consensus now prices in a near-certain 25-basis-point rate cut, while a segment of traders continues to factor in the possibility of a more pronounced 50-basis-point easing.
On the crypto-specific capital flow front, U.S. spot ETFs have put an end to a severe outflow streak that had wiped out more than a billion dollars in net redemptions over several consecutive sessions. This withdrawal cycle has given way to a marked reversal in the flow curve, illustrated by the return of net capital injections initially estimated at $28.7 million, then exceeding the $100 million threshold, driven by Fidelity’s (FBTC) and Grayscale’s (BTC Mini Trust) investment vehicles. This renewed institutional subscription activity, combined with on-chain metrics, points to a sustained withdrawal of Bitcoin reserves from centralized exchanges toward cold-storage solutions — evidence of quiet accumulation by large wealth-holding entities during technical pullbacks.
The market calendar also sits within a well-identified seasonal context. While September is statistically viewed as a period of lethargy or corrective consolidation for digital assets, the history of post-halving cycles shows that the liquidity purge carried out during this period systematically serves as the launchpad for the major trending moves of the fourth quarter. The current absorption of sell orders below $82,300 fits squarely into this cyclical transition pattern.
Tactical scenarios and invalidation levels
| Scenario | Probability | Operational trigger | Primary targets and extensions | Structural invalidation |
|---|---|---|---|---|
| Bullish continuation (A) | 70% | Confirmed 4H close above $82,300 with a volume spike | Target 1: $84,000 — Target 2: $90,000 — Target 3: $96,000 | 4H close below the $78,800 dynamic pivot |
| Corrective pullback (B) | 30% | Clean rejection below $81,500–$82,300 and a sell-side break under $77,000 | Target 1: $73,500–$74,000 — Target 2: $68,000 — Target 3: $64,500 | Impulsive 4H close above $82,500 |
The bullish scenario favors a successful break out of the 4H continuation flag and a resolution of the compression in buyers’ favor. Its validation requires a 4H candle close above the sell wall at $82,300, supported by rising spot buy volume. In this case, the liquidation of short positions concentrated at this level would quickly propel price toward the $84,000 extension zone, before releasing the asset toward the theoretical projection of the daily impulse leg, between $90,000 and $96,000. This scenario would be reinforced by renewed expansion of the 4H MACD histogram into green territory and by the daily RSI holding sustainably above 65 points without an exhaustion divergence. Conversely, any reintegration below the $78,800 central pivot would weaken this immediate breakout thesis.
The bearish scenario, meanwhile, envisions buying pressure failing to absorb the passive sell wall at $82,300, triggering a sharp rejection that would turn the current consolidation into a local distribution phase. In this case, the failure to clear upper resistance would lead to a fresh test of the range base at $77,000. Should this support give way on a 4H close, the triggering of late buyers’ protective stop orders would drive a correction toward the dynamic support of the 4H slow moving average, positioned near $73,500–$74,000. A worsening of institutional ETF outflows could then extend the purge toward the macro accumulation rampart between $64,000 and $65,000. This corrective pattern would be confirmed by the 4H RSI dropping below the 45-point mark. Conversely, an impulsive push closing above $82,500 would decisively invalidate this pullback outlook.
Summary and operational outlook
The alignment of technical indicators, order-book depth mapping, and fundamental factors delivers a technical diagnosis firmly favorable to continued Bitcoin appreciation. The market has consolidated a structural macro low above $57,800, and the subsequent daily impulse has reclaimed key price levels while resetting intraday leverage metrics. The 4H flag configuration and the liquidity sweep executed on the 15M timeframe confirm the dominance of passive buying flows ready to absorb residual volatility.
For market participants and capital allocators, the strategic priority is to monitor flow behavior at the two edges of the current liquidity channel:
- The $82,300 threshold is the major decision-making inflection point, whose break would trigger the breakout and volatility-expansion scenario toward $90,000–$96,000.
- The $77,000 floor acts as a technical protective barrier whose preservation guarantees the integrity of the bullish continuation pattern.
Any prudent operational approach would favor scaled entries anchored to the $78,500–$79,000 dynamic pivot, applying a strict invalidation stop below the $77,000 zone to maximize the reward/risk ratio against the macroeconomic extensions expected over the autumn cycle.
Disclaimer: this article is strictly educational and informational in nature. It presents a technical reading of Bitcoin’s market structure at a given point in time and does not constitute investment advice, a recommendation to buy or sell, or an inducement to take a position in any financial asset. Cryptoasset markets are highly volatile and carry the risk of capital loss. Readers are encouraged to do their own research (DYOR) and, where appropriate, to consult a licensed financial advisor before making any investment decision.

