


Bitcoin is going through a critical phase of arbitration. After a rally of more than 25% in August from cyclical lows around $57,000, the market’s leading asset is now running into a persistent ceiling between $81,500 and $82,400. As of September 8, 2026, the price is trading around $78,425, reflecting a wave of long-position unwinding and marked caution among institutional operators ahead of decisive macroeconomic deadlines.
A macroeconomic backdrop under high tension
The US economy is sending conflicting signals that are splitting FOMC members. August’s jobs report far exceeded expectations, with 162,000 non-farm payrolls added versus 55,000 forecast, while unemployment held steady at 4.1%. That strength reinforces the hawkish stance of Federal Reserve Chair Kevin Warsh, who remains committed to price stability, while Governor Christopher Waller has argued for a more measured approach given the recent slowdown in core inflation.
The CME FedWatch tool currently prices a 50-60% probability of a 25-basis-point rate hike at the September 15-16 meeting, keeping the 10-year Treasury yield near 4.8%. This high cost-of-capital environment weighs on non-yielding assets like Bitcoin. Traders are holding off on directional bets ahead of the US Consumer Price Index release on September 11.
| Key Parameter | Data Point | Implication for BTC |
|---|---|---|
| Fed Funds Range | 3.50% – 3.75% (hike probability at 25 bp: 50-60%) | Pressure on the risk premium; support for the dollar and bond yields |
| US Employment (August NFP) | +162,000 (consensus +55,000), unemployment at 4.1% | Reduced odds of near-term monetary easing |
| Spot Bitcoin ETF Flows | +$3.8B over 3 weeks; average acquisition cost ≈ $83,800 | Potential overhead supply as long as price stays below this level |
| CLARITY Act | Senate procedural cloture vote on September 15; passage odds ≈ 18% | Binary catalyst for crypto market structure |
| Energy & geopolitics | Brent crude above $95/barrel, tension in the Strait of Hormuz | Cost-push inflation risk, less room for central bank easing |
| Bitcoin network | Liquid Network incident: $268M returned, $47M withheld | Temporary L-BTC bridge freeze, no structural impact on the base settlement layer |
On the institutional side, spot Bitcoin ETF flows accelerated in late August and early September, totaling $3.8 billion over three weeks, including a record single-day inflow of $730.8 million on September 3. However, the tapering of these flows ahead of the Labor Day weekend, combined with the fact that spot price trades below the average acquisition cost of ETF subscribers (around $83,800), keeps passive distribution pressure alive whenever the market approaches this equilibrium level.
What the liquidity map reveals
Analysis of the aggregated order book, visualized through the liquidity heatmap (Order Book Heatmap, TapeSurf, September 8, 2026), makes it possible to pinpoint exactly where passive supply and demand sit and helps explain the price capping observed across spot and derivatives markets. Unlike volume executed after the fact on Japanese candlesticks, order book depth reveals where supply and demand are structurally organized.
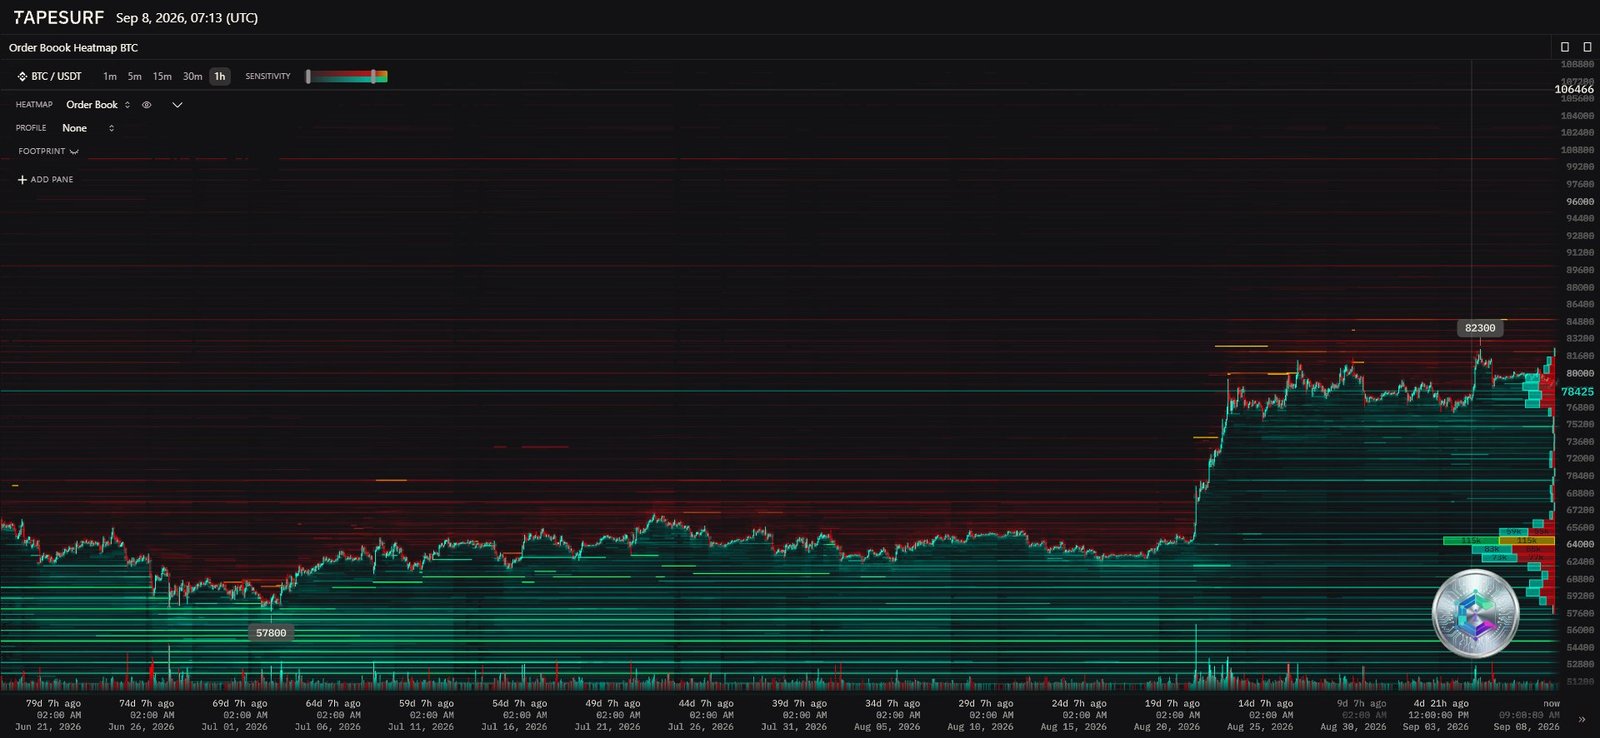
A dense cluster of sell orders (Ask Liquidity Wall) sits firmly between $82,000 and $83,000. This zone has proven to be an impassable barrier on four separate occasions since August 25: every market incursion, including aggressive short squeezes, has been fully absorbed by these passive institutional sellers, mechanically exhausting bullish momentum.
Below current levels, buy-side liquidity is organized in several tiers: a bid wall between $77,000 and $77,800 is currently absorbing selling pressure from the rejection above. A break of this floor would open the way toward the secondary band at $75,500, then toward two major bases: $64,000 (the tipping point of the summer’s bullish impulse) and $57,889, a long-term institutional accumulation zone where the last trend reversal occurred.
Daily chart: a constructive underlying trend, but losing steam
On the daily timeframe, price action sits within a broader recovery cycle following the sharp decline from the October 2025 all-time high of $126,198. That decline was neutralized during the summer of 2026 by a long horizontal accumulation phase on the $57,000 base, setting the stage for August’s vertical takeoff.
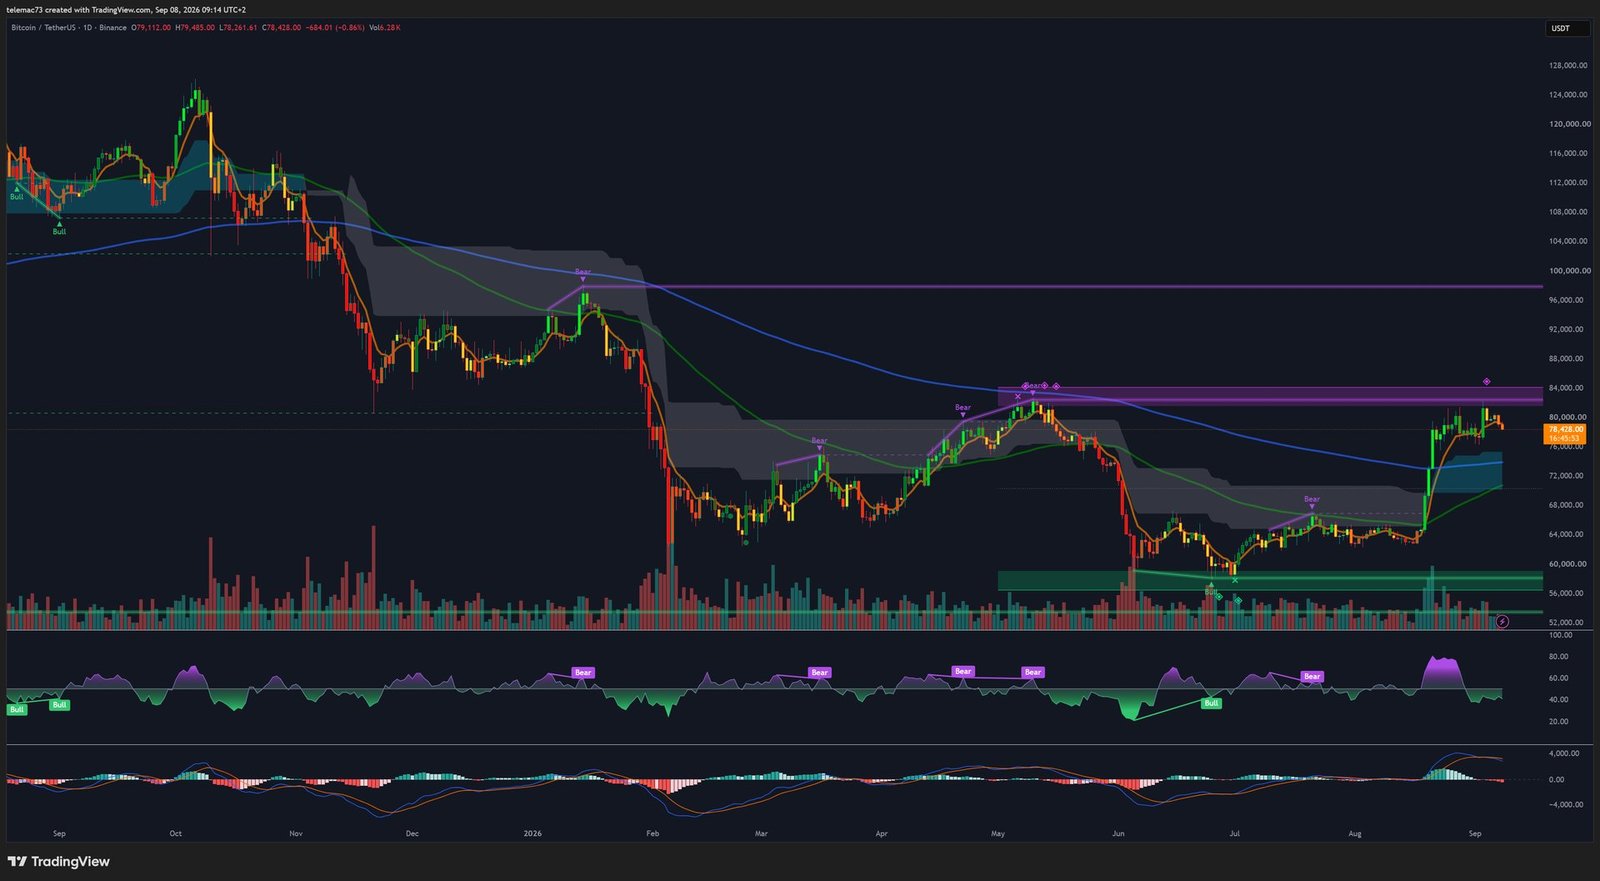
Exponential moving averages confirmed a significant medium-term event: the 50-day EMA crossing above the 200-day EMA (Golden Cross), which theoretically marked the exit from the dominant bearish structure. But the price advance ran headlong into the institutional supply band between $81,500 and $82,400 — a zone with strong negative polarity, since it served as the support floor in spring 2026 before breaking down in May. The 50-week moving average (around $81,041 per Galaxy Digital), which separates long-term bull and bear phases, was also unable to be reclaimed.
Momentum oscillators confirm this loss of steam. The 14-period RSI had reached extreme overbought territory (75-80 points) during the first push toward $82,000; on the second attempt in early September (a peak of $82,283), it topped out at a notably lower level, confirming a classic bearish divergence. It has since fallen back toward its 50-point midline. The MACD, while still positive, shows a continuous contraction of its histogram, with signal lines converging dangerously toward a potential daily bearish crossover.
4-hour chart: triple-top distribution and a Death Cross taking shape
The 4-hour timeframe reflects tactical behavior within a sideways consolidation between $77,300 and $82,000. Price action between August 25 and September 4 traces a classic reversal pattern: a Triple Top (range distribution), where every attempt to break higher was met with absorption wicks.
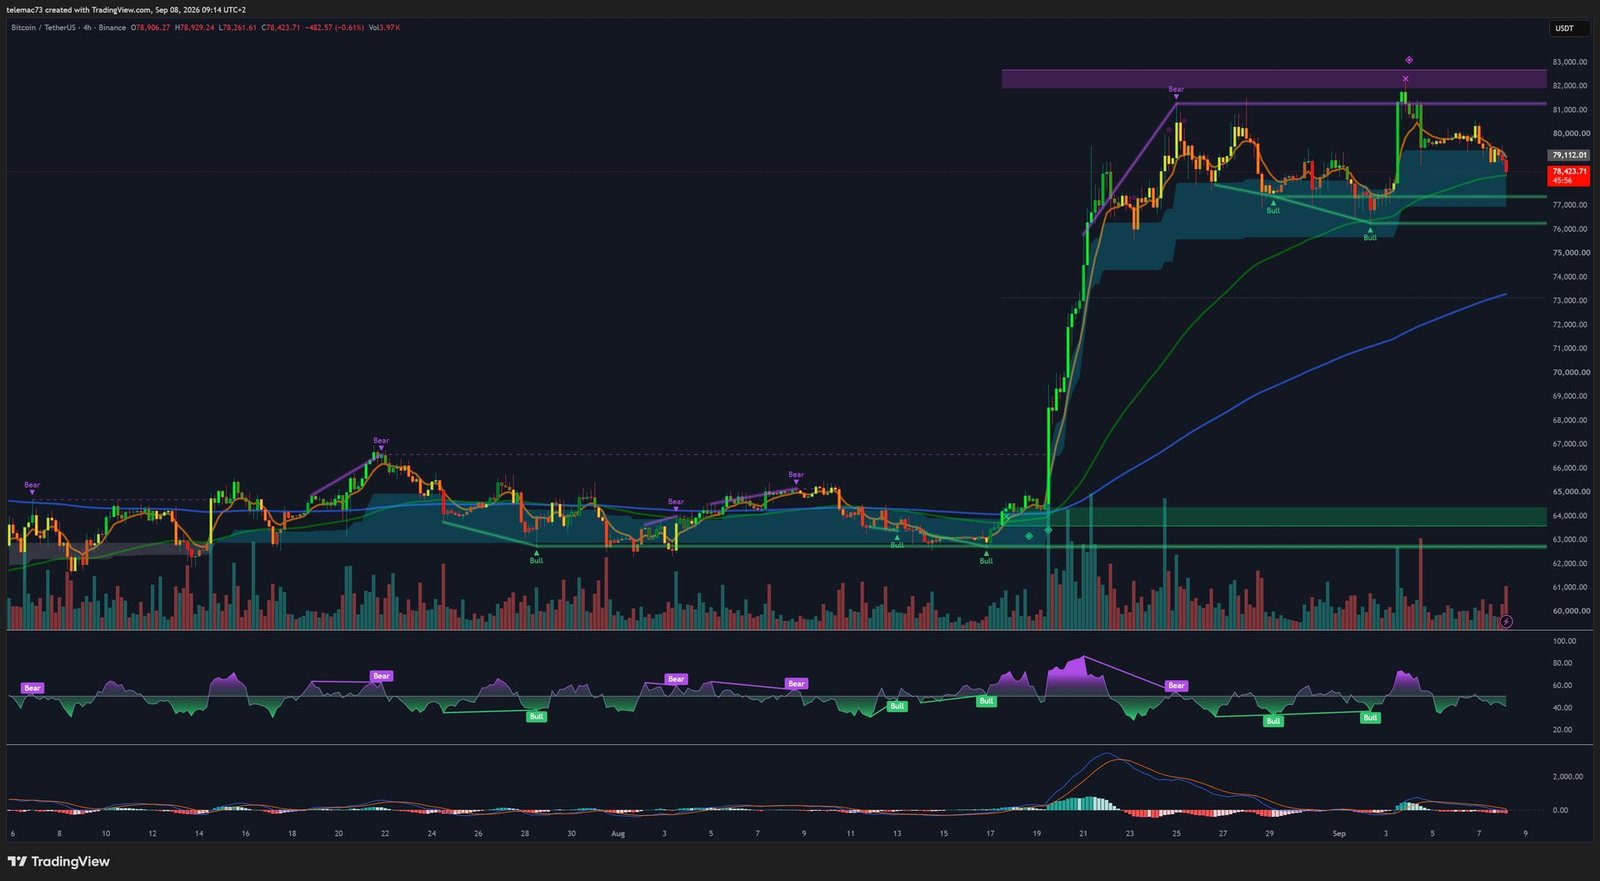
The deterioration accelerated with the consecutive loss of the 20-EMA and then the 50-EMA: the 20-EMA has curved downward and is about to cross below the 50-EMA (4H Death Cross), confirming that sellers have retaken control on this intermediate timeframe. The 200-EMA on the 4H chart, around $73,500, forms the underlying dynamic support toward which the market could be pulled if horizontal supports fail. The 4H RSI has slipped below the 50-point neutral zone toward 40, and the MACD has confirmed a clean bearish crossover with expanding negative histogram bars.
15-minute chart: seller exhaustion in extreme oversold territory
On the 15-minute timeframe, price action reflects a fast, linear flush. From the intraday distribution zone near $80,400, price successively broke the local support at $79,600, triggering a cascade of liquidations on highly leveraged long positions, before finding a temporary low around $78,425.
The 20 and 50 EMAs on the 15-minute chart are in a strictly descending alignment above price, acting as dynamic ceilings. Short-term indicators, however, point to a selling climax: the 15-minute RSI plunged below the critical 25-point threshold, marking an extreme low between 18 and 22 points. Historically, such a level of compression triggers a mean-reversion technical bounce toward a retest of $79,200. The 15-minute MACD is starting to contract its negative bars after printing a severe low below the zero line, suggesting that aggressive selling flow is running out of steam against passive buy-side liquidity around $78,000.
Key technical levels to watch
| Level | Price (USDT) | Technical role | Timeframe |
|---|---|---|---|
| Institutional resistance | $83,800 | Average ETF subscriber cost basis; upper boundary of the macro blockage zone | 1D |
| Major resistance | $82,000 | Top of the 4H Triple Top; massive seller wall on the heatmap | 4H / 1D |
| Immediate resistance | $79,800 | Psychological threshold; confluence with the 4H 20-EMA | 15m / 4H |
| Key pivot | $79,200 | Intraday tactical dividing line | 15m |
| Immediate support | $78,000 | Current price; extreme oversold 15m RSI | 15m / Heatmap |
| Major support | $76,700 | Horizontal floor of the 4H range; September 5 low | 4H |
| Structural support | $75,500 | Low of August’s ascending channel | 4H / 1D |
| Secular support | $64,000 | Breakout base of the summer impulse; confluence with the 200-day EMA | 1D |
Two scenarios for the coming sessions
Scenario 1 — Distributive consolidation and a sweep of lower liquidity (estimated probability: 60%)
This scenario rests on the dominance of selling flows below the major $82,400 resistance, the recurring rejection illustrated by the 4H Triple Top, and negative MACD expansion on that same timeframe. The restrictive rate environment limits buyers’ capacity to commit fresh capital ahead of upcoming inflation data and the FOMC decision.
In this setup, the extreme oversold reading on the 15-minute RSI first triggers a reflex bounce toward the $79,200 pivot, potentially extending to $79,800. That bounce is used by sellers to distribute liquidity at a better price, capping the market below the 4H 20-EMA. Failure to reclaim $80,000 would trigger a fresh wave of selling that breaks the $78,000 support and pushes price toward the range floor at $77,300. If the September 11 US CPI confirms persistent inflation, or if the CLARITY Act cloture vote fails on September 15, a bearish extension could drive stop-loss hunting below $76,700, projecting the market toward the structural support at $75,500, or even the 4H 200-EMA near $73,500. Confirmation: a daily close below $78,000. Invalidation: a 4H close above $80,500.
Scenario 2 — Passive absorption and a bullish breakout (estimated probability: 40%)
This alternative scenario rests on the resilience of the passive buy-order base between $77,500 and $78,000. It assumes the current weakness is simply a leverage flush, without undermining the underlying bullish trend confirmed by the daily Golden Cross. It would require August inflation figures to come in below expectations, reinforcing Christopher Waller’s dovish comments and easing rate-hike fears.
The seller-exhaustion signal on the 15m RSI would then turn into a vigorous buying impulse, clearing the $79,200 pivot and closing above the $80,000 psychological level, forcing recent short sellers to cover into $81,000. The subsequent attack on the $82,000 sell wall would come with stronger spot-market support. A daily close above $82,400 would invalidate the 4H distributive structure and could trigger a large-scale liquidation of dormant sell orders, propelling price toward the average ETF cost basis of $83,800, with an extension target near $85,000. Confirmation: a 4H close above $80,500 with a bullish reopening of the Bollinger Bands. Invalidation: a clean break below $77,300.
Conclusion: caution remains warranted
Bitcoin’s technical setup as of September 8, 2026 shows a clear asymmetry across timeframes. While the daily chart retains the hallmarks of a constructive underlying structure thanks to the Golden Cross, the combination of a bearish daily RSI divergence, a 4-hour Triple Top, and a heavy wall of passive sell orders between $82,000 and $83,000 calls for maximum operational discipline.
In the short term, the pronounced oversold condition on the 15-minute RSI favors a reflex technical bounce toward $79,200, but the market structure will only provide durable bullish confirmation with a daily close clearing the $82,400 ceiling. While awaiting the crucial mid-September macro catalysts (US inflation, the CLARITY Act, and the FOMC decision), capital preservation argues for avoiding aggressive exposure at current mid-range levels, favoring instead close observation of order-book reactions at the identified extremes: the major support at $76,700 on the buy side, or a confirmed institutional breakout above $82,400 on the trend side.
Disclaimer: this article is provided for strictly educational and informational purposes. It does not constitute investment advice, a buy or sell recommendation, or an incitement to make any financial decision. Cryptoasset markets are highly volatile and carry a risk of capital loss. Do your own research (DYOR) and consult a licensed financial advisor before making any investment decision.

