


In early September 2026, Bitcoin is trading around $79,730, consolidating after a nearly 25% rally throughout August. The move, fueled by massive institutional inflows into U.S. spot ETFs, has now run into a key resistance zone and a fresh bout of macro volatility. Here is our complete multi-timeframe technical breakdown, paired with an order-book liquidity map and the strategic scenarios worth watching.
Macro Backdrop and Derivatives Liquidity Structure
The institutional thesis rests on targeted accumulation at discounted levels relative to the all-time high of $126,198 reached in autumn 2025. U.S. spot ETFs recorded net inflows of between $3.05 and $3.5 billion over the past month, the strongest allocation since October 2025. That momentum, however, was checked by a resurgence in macro volatility: U.S. non-farm payrolls (NFP) came in at three times the consensus estimate, pushing bond yields higher. Fed Chair Kevin Warsh also publicly dismissed the idea of a rapid disinflation and confirmed the formal end of forward guidance, which immediately halted the test of highs above $81,000.
On the derivatives side, market structure remains healthy overall. Perpetual futures funding rates hover around 10% annualized, reflecting a balanced risk premium without runaway speculation. Total open interest sits at roughly $54 billion, down 23% from the previous cycle’s $70 billion peak — suggesting the recovery is being driven by spot demand rather than leverage stacking. A tactical asymmetry remains in positioning: Binance alone concentrates $3.0 billion in leveraged long positions vulnerable to a liquidation cascade below immediate supports, against $1.8 billion in short positions stacked above resistance.
The prevailing institutional pivot level sits at $82,500, matching the volume-weighted average cost basis of all U.S. spot ETF holders. A clean weekly close above this level would confirm the shift from a mere counter-trend relief rally to a resumption of the secular bull trend.
Multi-Timeframe Technical Analysis
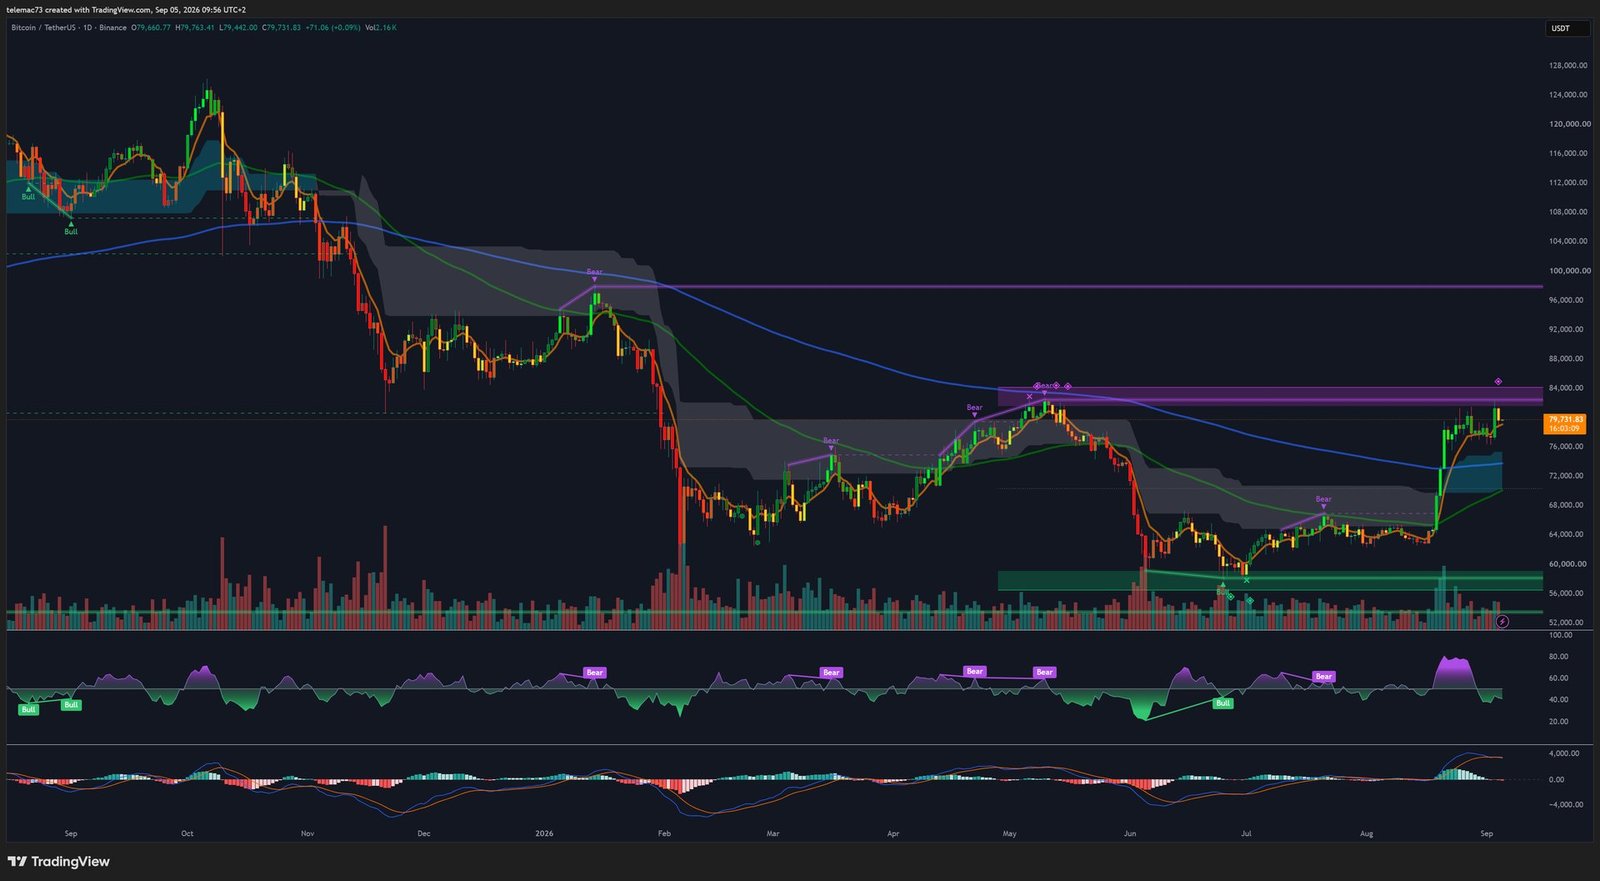
Daily Chart (1D): Moving Average Confluence and Momentum Overheating
The daily chart shows a structural transition that began at the major double bottom identified around $57,800 in mid-August 2026. The subsequent expansion allowed price to simultaneously break above the 50-day and 200-day moving averages, validating a bullish Golden Cross on the underlying trend indicators. Price is now trading 20% above the 200-week moving average ($65,500) and 46% above the average realized price of investors ($53,000).
The advance was rejected under the $81,000–$82,000 resistance band, which coincides with the 50-week moving average — a level that had already rejected price in Q1 2026 and triggered the capitulation toward $57,000. The daily RSI peaked at 82 during the push to $81,500, flashing a technical exhaustion (Bear) signal, before pulling back to 66. The daily MACD remains positive, but its histogram shows a clear deceleration, reflecting a cooling of the initial thrust.
Intermediate Trend (4H): Bull Flag Consolidation
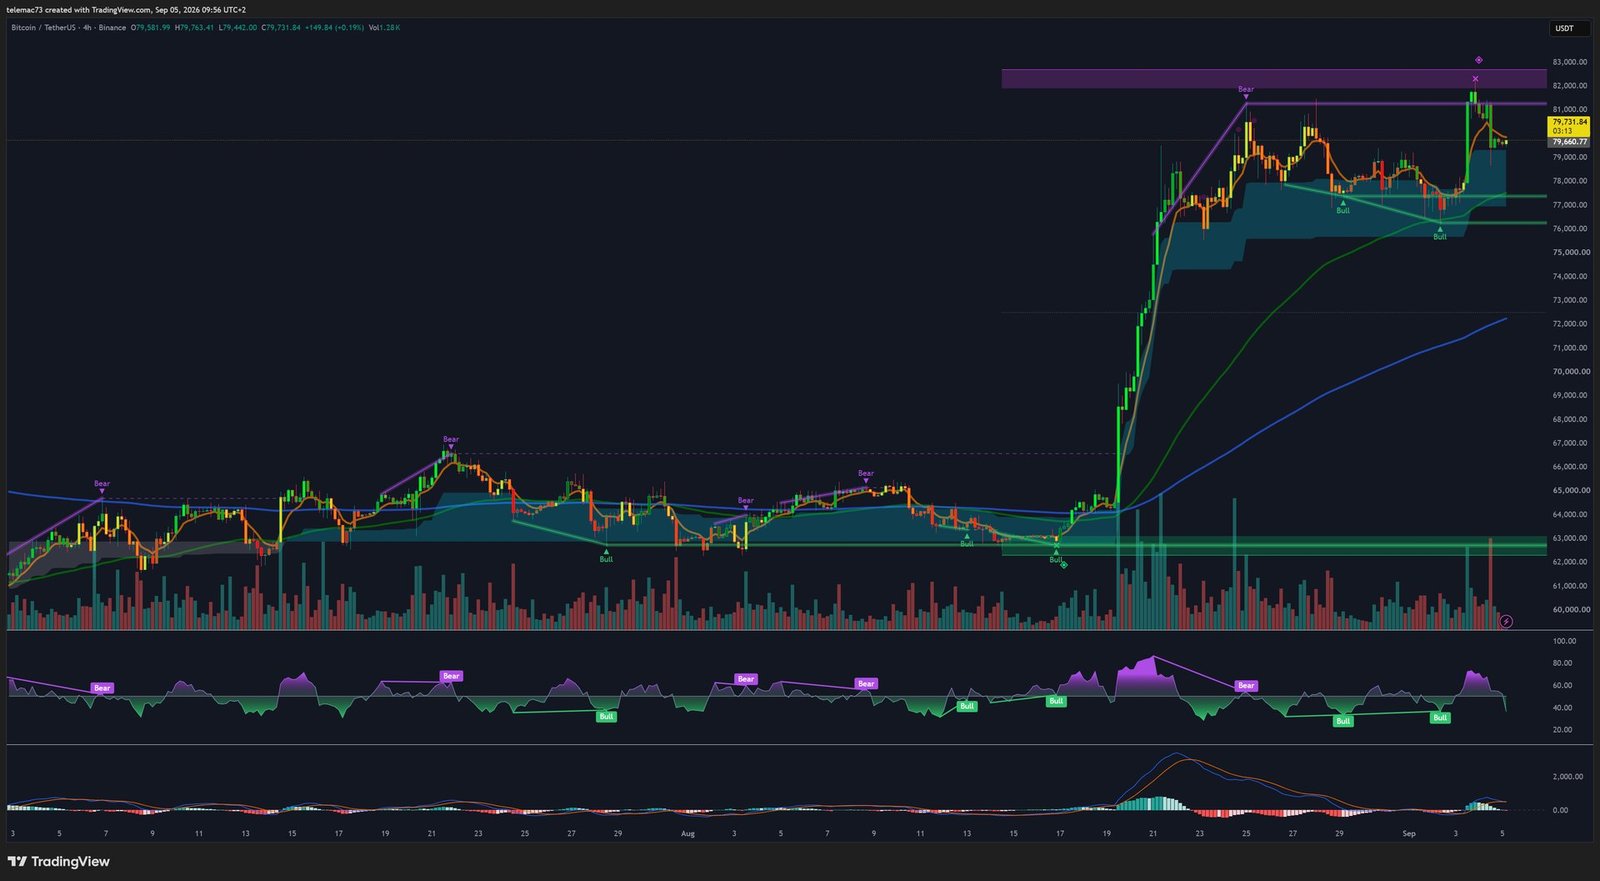
On the 4-hour timeframe, price action is unfolding inside a descending channel resembling a Bull Flag, capped by resistance at $81,500. This chart pattern typically appears after a parabolic move, marking an accumulation phase where strong hands absorb profit-taking without ceding ground on key structural levels. Price is currently holding directly above its intermediate moving average, near $78,800.
After forming a bearish divergence below $81,500, the 4H RSI completed a full technical reset, dipping into relative oversold territory at 40 during the retest of $77,000, before climbing back to 54. This reset gives the market the technical capacity to absorb another breakout attempt without immediate momentum saturation. The 4H MACD, which had formed a bearish cross below $81,000, shows a sharp contraction of its negative bars — a sign of a potential bullish cross should price clear $80,200.
Intraday Microstructure (15m): Institutional Absorption and Compression
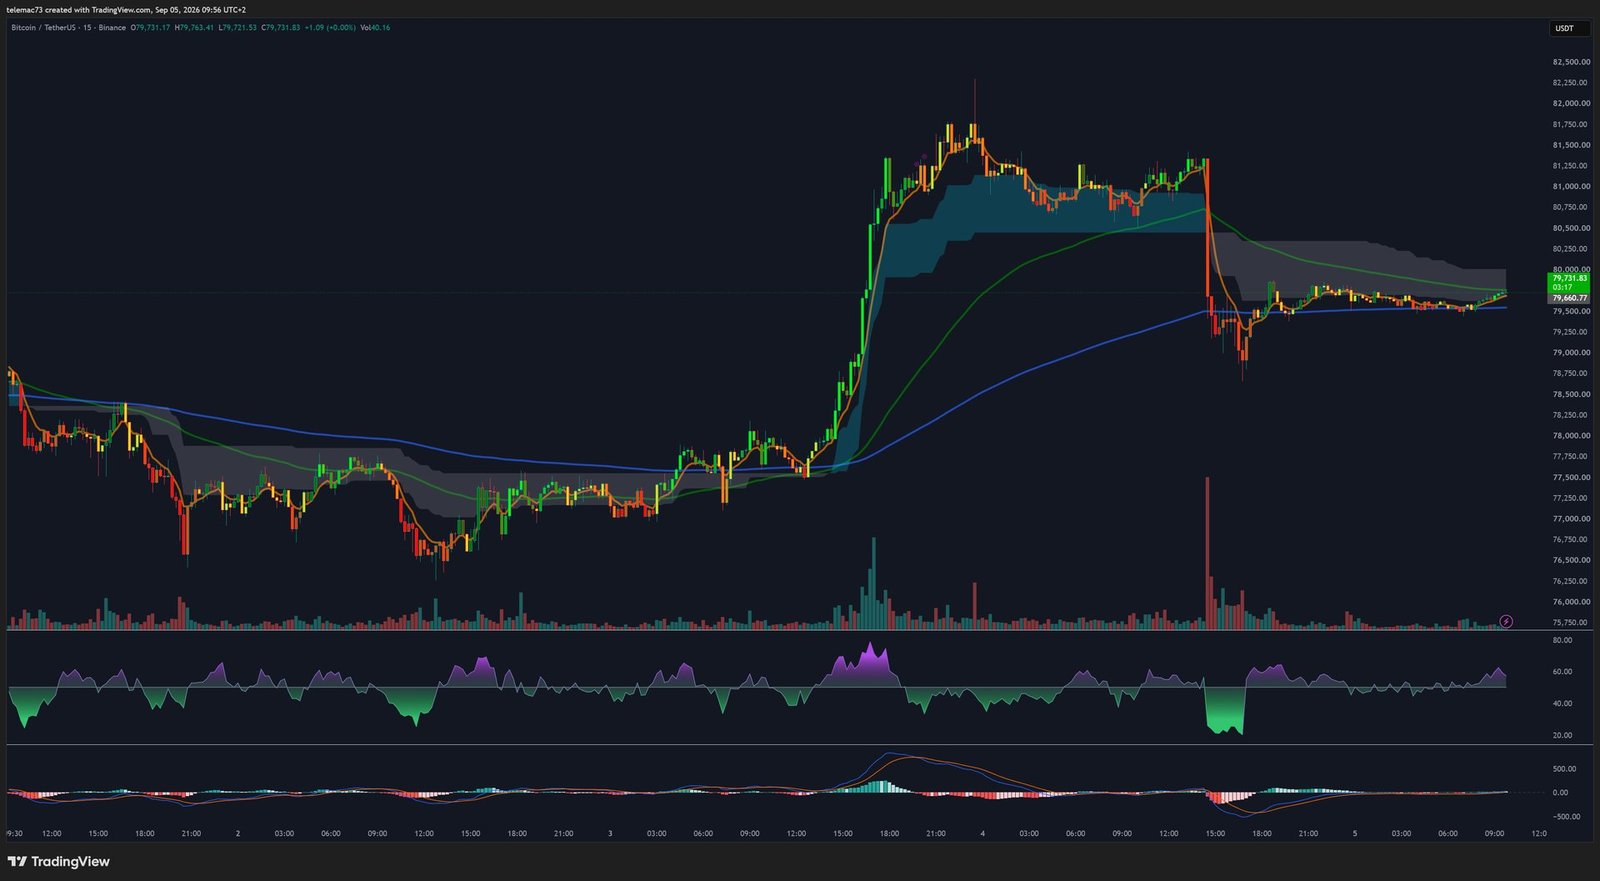
On the 15-minute scale, Fed commentary triggered a brief intraday capitulation down to $78,400, marked by a long lower wick and unusually high volume — a sign of systematic institutional absorption of selling liquidity. This “V”-shaped rejection immediately pulled price back to $79,730, invalidating any bearish breakdown attempt.
Since that episode, price has been trading inside a symmetrical compression triangle, bounded by descending resistance near $80,100 and rising support at $79,350, above the 15-minute exponential moving average ($79,250). The 15m RSI has climbed out of extreme oversold territory (below 20 during the wick to $78,400) to stabilize at 58, while the 15m MACD completed a clean bullish crossover, supported by returning net buying flows.
Timeframe Comparison Summary
| Timeframe | Dominant Structure | Moving Averages | RSI | MACD |
|---|---|---|---|---|
| Daily | Range breakout, consolidation under resistance | Golden Cross confirmed (50MA > 200MA) | 66 (after an extreme overbought peak at 82) | Positive territory, bullish histogram contracting |
| 4-Hour | Bull Flag consolidation | Price above the 4H EMA ($78,800) | 54 (rebound from 40) | Negative histogram in an absorption phase |
| 15-Minute | Symmetrical compression triangle | Price above the 15m MA ($79,250) | 58 (sharp rebound from <20) | Bullish crossover confirmed |
Order Book Mapping and Liquidity Heatmap
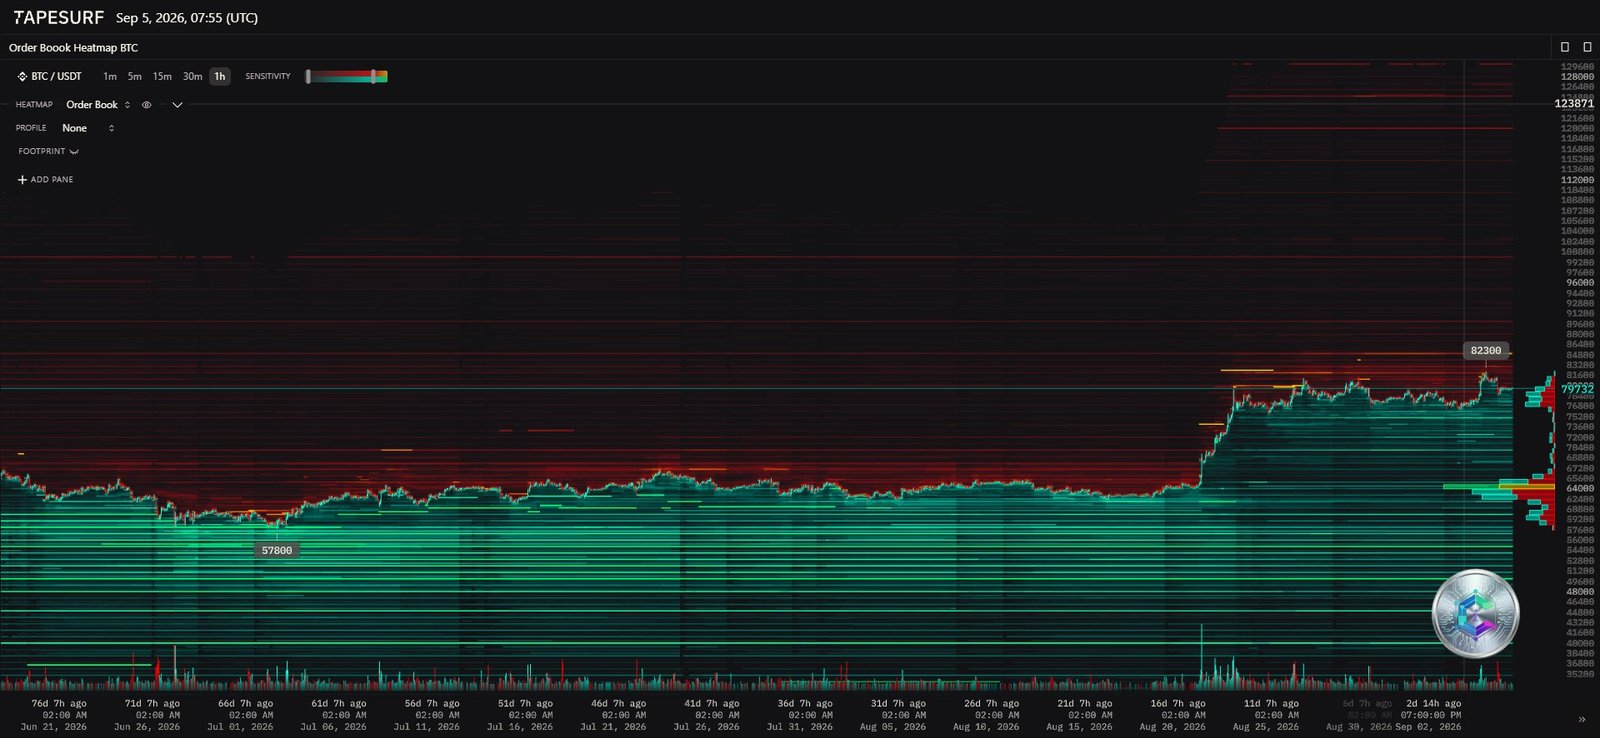
Analyzing the order book liquidity heatmap makes it possible to pinpoint passive liquidity and anticipate how price will react to resting orders. A continuous band of high intensity spans $82,000 to $82,500: this ask wall coincides with the average cost basis of U.S. spot ETF buyers and the 50-week moving average. Beyond it, order density thins out before a further resistance pocket at $85,000.
Conversely, the base of the order book is supported by dense buy blocks between $76,000 and $77,000, a first-order institutional support level formed from the summer’s old resistance now flipped into a floor. Between $80,200 and $81,500, the book shows a liquidity void: a confirmed break above $80,000 would face little technical friction, favoring a fast move up toward the $82,000–$82,500 cluster. In the background, a massive, largely untouched bid stack remains intact at $57,800 — the absolute reference for this cycle’s macro capitulation floor.
Key Technical Levels: Supports, Resistances and Pivots
| Price Level ($) | Type | Timeframes | Rationale |
|---|---|---|---|
| 85,000 | Major Resistance R3 | Daily / Weekly | Range-breakout extension, staging post toward the yearly high |
| 82,000 – 82,500 | Critical Resistance R2 | Weekly / Heatmap | Weekly 50MA, average spot ETF cost basis, passive ask wall |
| 80,000 – 80,200 | Local Resistance R1 | 15m / 4H | Top of the 15m compression triangle, psychological resistance |
| 79,500 – 79,700 | Intraday Pivot | 15m / 4H | Point of control (POC) of volume |
| 78,400 – 78,500 | Immediate Support S1 | 15m | Low of the post-Warsh/NFP capitulation wick |
| 76,800 – 77,050 | Major Support S2 | Daily / 4H / Heatmap | Base of the 4H flag, summer polarity flip, bid shelf |
| 71,800 – 73,000 | Dynamic Support S3 | 4H / Daily | 4H 200MA, Fibonacci retracement of the August impulse |
| 68,500 | On-chain Support S4 | Daily | Short-term holder cost basis |
| 57,800 | Secular Support S5 | Daily / Heatmap | Summer accumulation floor, durable institutional buy wall |
Strategic Scenarios and Risk Modeling
Near-term direction will hinge on how the intraday compression triangle resolves and on buyers’ ability to absorb the leverage imbalance sitting in derivatives.
Bullish scenario (estimated probability 50%): a clean break of the $80,200 pivot would pull price through the liquidity void toward the $81,500–$82,500 cluster. A daily close above $82,500 would force short-covering, opening the path toward $85,000. This scenario requires price to hold above the $79,350 support.
Consolidation scenario (estimated probability 35%): continued sideways action inside the 4H bull flag, with repeated rejections under $80,500 without panic selling, ranging between $77,500 and $80,000. This would let the daily oscillators finish working off their overbought reading.
Bearish scenario (estimated probability 15%): a confirmed break of the major $76,800 support would trigger a cascade of liquidations across the $3 billion in leveraged long positions stacked below the market, with a possible correction toward the 4H 200MA ($71,800–$73,000), or even down to the short-term holder cost basis at $68,500.
| Scenario | Probability | Trigger | Invalidation | Targets |
|---|---|---|---|---|
| Bullish breakout | 50% | Close > $80,200 with volume rebound | 15m close < $79,350 | $82,500 then $85,000 |
| Range consolidation | 35% | Repeated failure under $80,500 | Clean break out of the $77,000–$80,000 band | Range $77,500–$80,000 |
| Bearish purge | 15% | 4H close < $76,800 confirmed by volume | Immediate reclaim > $77,500 | $73,000 then $68,500 |
Conclusion and Operational Takeaways
The multi-timeframe analysis and order-book study confirm that Bitcoin retains a structurally bullish medium-term bias, underpinned by the daily Golden Cross and ongoing institutional accumulation through ETFs. The immediate absorption seen during the wick to $78,400 speaks to the strength of underlying buying flows. That said, the proximity of the $81,000–$82,500 resistance zone makes aggressive buying at these levels asymmetric from a risk/reward standpoint, particularly as the daily RSI has only just exited an extreme overbought zone. A cautious approach would favor buying technical pullbacks into the polarity-flip zone ($77,000–$77,500), or waiting for confirmation of a daily close above $82,500 before considering trend-following positions toward $85,000. A break of the $76,800 support would represent the structural invalidation signal requiring an immediate neutralization of long exposure.
Disclaimer: this article is provided for informational and educational purposes only. It does not constitute investment advice, a recommendation to buy or sell, or an inducement to take any position in the financial markets. Cryptocurrencies are highly volatile assets; only invest what you are prepared to lose, and always do your own research (DYOR) before making any decision.

