


Bitcoin enters August 2026 locked inside a compression zone that is as narrow as it is decisive. Between a polarized order book, historically unfavorable seasonality, and a governance crisis unlike anything seen since Taproot, the asset sits at the crossroads of several competing forces. Our analysis combines order-book microstructure, multi-timeframe technical reading, and a map of the key fundamental risks to outline the most likely scenarios for the coming weeks.
A macro backdrop under pressure
A firm US dollar and elevated bond yields continue to restrict liquidity available to risk assets, even as crude oil’s pullback toward the $82-per-barrel range offers slight relief on global inflation expectations. Investor sentiment remains cautious, with the Crypto Fear & Greed Index stuck in “Fear” territory around 34-35.
That caution is compounded by unfavorable seasonality: August has historically closed in the red in nine of the last thirteen years, with an average negative return near 7.5%. On top of these external constraints sit endogenous tensions unseen since Taproot’s activation in 2021 — chief among them the heated debate around the BIP-110 soft fork, whose signaling window opens in early August and carries a real risk of a chain split.
What the order-book heatmap reveals
Unlike candlestick charts, which only trace executed transaction history, the order-book heatmap exposes latent liquidity — the resting limit orders that shape the price’s probable trajectory. The market is currently navigating a thin liquidity pocket near 64,850 USDT, a sign that market makers and high-frequency algorithms are positioning ahead of a volatility expansion.
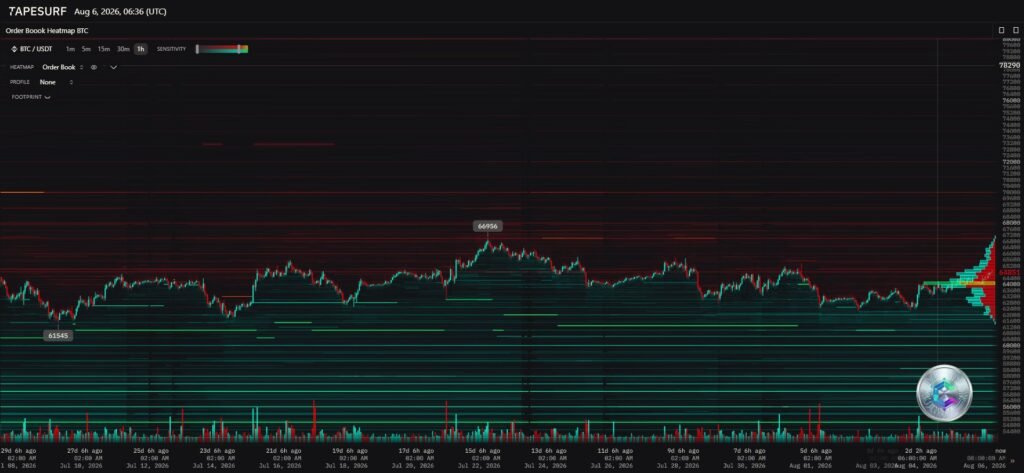
On the sell side, a dense liquidity wall sits at 66,956 USDT, fed by institutional profit-taking and by the recent migration of roughly 39,600 BTC from cold wallets to centralized exchanges following the hack that hit the Coldcard hardware-wallet infrastructure (around 1,367 BTC stolen). This saturated supply spans the 66,000-68,000 USDT range.
On the buy side, institutional demand is firmly anchored at 61,545 USDT, a level that absorbed the bulk of forced liquidations during the most recent stress phases. Below it, defensive layers form near 60,000 and then 58,000 USDT.
| Key level (USDT) | Liquidity type | Implication |
|---|---|---|
| 66,956 | Sell (Ask) | Institutional distribution ceiling |
| 64,851 | Neutral | Transition / equilibrium zone |
| 61,545 | Buy (Bid) | Liquidation-absorption base |
| 58,000 | Buy (Bid) | Macro defensive backstop |
Multi-timeframe reading: from intraday momentum to the macro trend
15-minute: a bullish impulse losing steam
On the shortest timeframe, price is trading above its EMA ribbon, with immediate support at 64,200 USDT and resistance near 65,000 USDT. The RSI, oscillating between 70 and 85, is deeply embedded in overbought territory, while the MACD histogram is contracting — two signals pointing to a rest or consolidation phase rather than a collapse. The bull-flag structure remains technically valid as long as support holds.
4-hour: institutional battleground
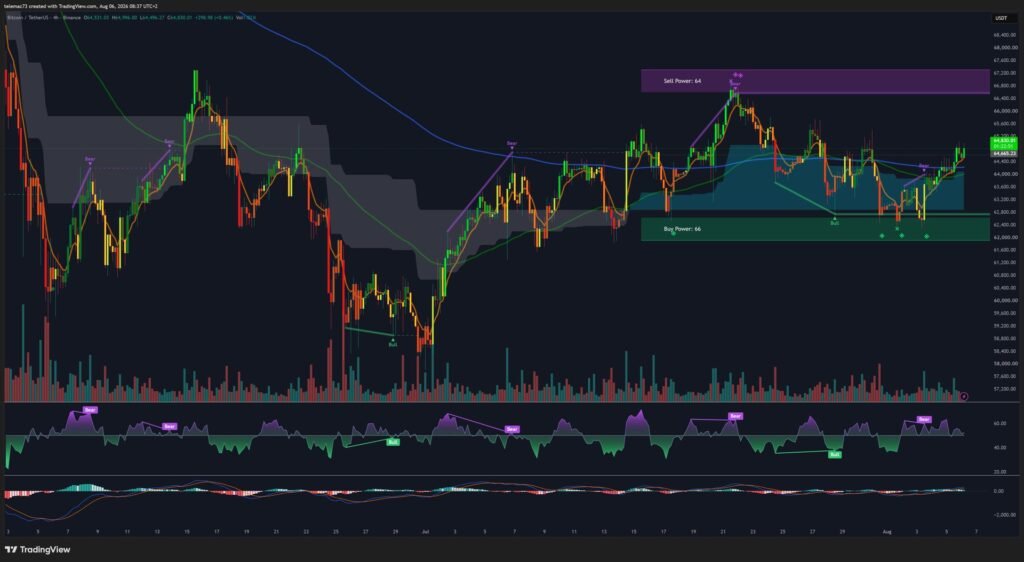
On this scale, the market is gradually pulling out of a multi-month correction. A solid “Buy Power” zone spans 61,500-62,000 USDT, where a double bottom has formed, while a “Sell Power” zone between 66,000 and 67,200 USDT continues to produce rejection wicks. A golden cross is forming on the moving averages, the RSI has recovered from oversold territory into a bullish-leaning neutral zone (55-60), and the MACD has confirmed a bullish crossover below the zero line. A sustained close above 64,700-65,000 USDT would confirm the resumption of upward momentum.
Daily: the fight for the macro structure
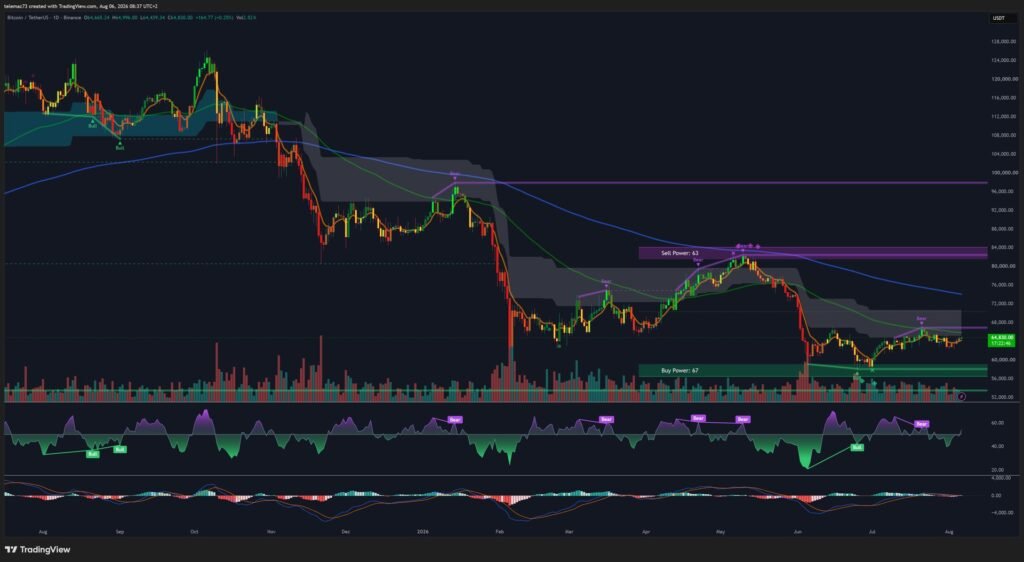
This is where the 2026 cycle narrative is being written. After defending the $60,000 handle from October 2024 through June 2026, Bitcoin saw that floor give way abruptly in early June, collapsing from $67,000 to $59,100 in forty-eight hours and wiping out more than three billion dollars in leveraged positions. The June 25 low of $58,035 marked the weakest level since September 2024.
Price is now trading below its 50-day exponential moving average, a setup that raises the specter of a “Death Cross” should the 50 EMA cross below the 200 EMA. The dividing line between bull and bear market territory sits at $66,000, the average on-chain cost basis of buyers over the past five months. There is, however, a note of hope: the daily RSI, which dipped to 39.52, is attempting to carve out a hidden bullish divergence — a pattern that, during the 2017, 2018, and 2022 cycles, historically preceded a definitive bottom within a 13-to-31-day window.
The August 2026 forks: an unprecedented governance crisis
Bitcoin’s consensus has not been altered since Taproot in 2021. That status quo is now being shaken by the convergence of several major protocol events this month.
- BIP-110 (RDTS) — Targeted for around August 7-9 at block 961,632, this user-activated soft fork aims to restrict the injection of arbitrary data (Ordinals, BRC-20, Runes) onto the blockchain. Its activation threshold, set at just 55% of hashpower, sits well below the historical 90-95% standard, raising the risk of a chain split. Miner signaling remains anemic, capping out between 1% and 2.7%.
- eCash (Sztorc) — A hard fork targeted at block 964,000 (~August 21), aiming to create a parallel chain that force-activates “Drivechains,” with a symmetric 1:1 airdrop of a new token. This unsolicited fork poses a compliance headache for regulated custodians.
- BIP-360 and the quantum clock — A Google Quantum AI publication revised downward the number of qubits needed to break Bitcoin’s cryptography, accelerating the urgency of a post-quantum migration and fueling the parallel debate over covenants (OP_CTV, OP_CAT).
Absent replay protection in the event of a non-consensual split, institutional custodians and exchanges could be forced to suspend deposits and withdrawals — a scenario weighing on near-term risk appetite.
Institutional flows and the Swiss regulatory framework
Institutional demand via US spot ETFs, historically the engine of Bitcoin’s rallies, has notably stalled: after encouraging net inflows in early July, a massive $265.4 million outflow was recorded on July 31. Meanwhile, Strategy has temporarily slowed its systematic purchases in favor of building up its dollar reserves — a marginal but meaningful signal.
In Switzerland, FINMA has tightened enforcement of the FATF Travel Rule, lowering the reporting threshold from CHF 5,000 to CHF 1,000, while the OECD’s Crypto-Asset Reporting Framework (CARF), adopted on January 1, 2026, requires systematic transmission of international clients’ tax data. These measures strengthen the sector’s long-term legitimacy but create short-term operational friction for marginal capital inflows.
Two scenarios for the weeks ahead
Base case: compression and attrition
The higher-probability outcome remains persistent compression between 61,500 and 66,956 USDT, sustained by unfavorable seasonality and institutional wait-and-see behavior around split risk. A break of the 61,500 USDT support would open the door toward the 58,000 USDT backstop, while confirmation of a “Death Cross” on the daily chart would push any structural recovery into the final quarter of the year.
Bull case: upside breakout
A more optimistic path would require a close above the 66,956 USDT wall, triggering a short squeeze, combined with a peaceful resolution of BIP-110 and a normalization of macro liquidity conditions. A monthly August close above $63,000 would open the way toward a rapid reclaim of $71,000.
Either way, how the current compression zone resolves will likely dictate market dynamics for the rest of the second half of 2026.
Disclaimer: this article is provided for informational and educational purposes only. It does not constitute financial advice, an investment recommendation, or a solicitation to buy or sell digital assets. Cryptocurrency markets are highly volatile, and any investment decision should be based on independent analysis and, where appropriate, guidance from a licensed financial advisor.

