


Bitcoin is moving through one of its tensest compression phases of the year as July 2026 draws to a close. Squeezed between a heavy institutional sell wall near $67,000 and a fiercely defended buy floor close to $62,000, the asset sits at the center of a standoff blending restrictive monetary policy, geopolitical tension, ETF mechanics and derivatives market engineering. This analysis combines the latest macroeconomic data with a multi-timeframe technical read (daily, 4-hour, 15-minute) and order-book heatmap mapping to draw a complete picture of the current market structure.
A macro backdrop under heavy strain
Risk-asset valuations remain tightly linked to the cost of capital. In late July, the US Federal Reserve held its benchmark rate between 3.50% and 3.75% for a fifth consecutive meeting, a status quo delivered with resolutely hawkish rhetoric. Three committee members even pushed for an immediate 25-basis-point hike, a sign that the inflation fight is far from over. That stance mechanically strengthened the dollar and pushed ten-year Treasury yields higher, raising the opportunity cost of holding a non-yielding asset like Bitcoin.
Layered on top of this monetary constraint is a deteriorating geopolitical backdrop: renewed US strikes in Iran reignited fears of a wider Middle East escalation, pushing crude oil toward $90 a barrel and fueling inflation expectations. The direct consequence was a wave of risk-off selling across Asian markets — South Korea’s Kospi index dropped 11% — before spreading into crypto, hitting AI-linked altcoins and Layer 1 infrastructure tokens particularly hard, some losing up to 12% within days.
| Macro indicator | Status (late July 2026) | Theoretical impact on BTC |
|---|---|---|
| Fed benchmark rate | 3.50% – 3.75% (unchanged) | Negative |
| 10-year Treasury yields | Rising post-FOMC | Negative |
| Crude oil | ~$90/barrel | Negative (inflation pressure) |
| Kospi index | -11% (contagion) | Negative |
Spot ETFs: choppy flows shaping market microstructure
Spot Bitcoin ETFs have become the main transmission channel between traditional liquidity and crypto order books. Between mid-May and early June, the market endured thirteen consecutive days of net outflows, draining $4.4 billion from the ecosystem — the longest withdrawal streak since their 2024 launch. July reversed course with six consecutive days of net inflows (roughly $930 million), before Fed-related uncertainty triggered renewed outflows. Overall, the month closed with a net positive flow of $204.7 million for Bitcoin, versus $342.9 million for Ethereum.
| US spot ETF dynamics | Metric (July 2026) |
|---|---|
| Total assets under management | ~$80.9B |
| Cumulative net inflows (all-time) | +$51.36B |
| Monthly net flow BTC | +$204.7M |
| Monthly net flow ETH | +$342.9M |
The ETF creation/redemption mechanism forces authorized participants to act directly on the spot market: a discount on ETF shares pushes these intermediaries to redeem shares for underlying Bitcoin from the custodian, then sell it on the open market — transferring Wall Street’s selling pressure straight into sometimes thin crypto order books, an effect amplified by the structurally reduced post-halving coin issuance. Meanwhile, continued accumulation by corporate entities such as MicroStrategy — holding 843,775 bitcoins at an average cost of $75,476 as of late July — acts as a liquidity sink that tightens available supply on exchanges.
Derivatives and leverage: the weight of “Max Pain”
The late-July options expiry proved decisive in explaining the price stagnation. Open interest reached $34.13 billion, with an apparent bullish skew toward calls (66% of total open interest, put/call ratio at 0.57). That skew is misleading, though: the “Max Pain” level — the price at which the largest volume of options expires worthless — sits precisely around $64,000. To stay delta-neutral, market makers are mathematically compelled to buy as price falls and sell as it rises, effectively pinning the price around this level and dissipating any attempt at a clear trend.
On the perpetual futures side, the drop below $63,000 triggered over $510 million in cascading liquidations across the broader crypto market, including $75 million on Bitcoin long positions alone — roughly 165,500 traders liquidated within 24 hours. The long-position ratio nonetheless remains elevated at 64%, while the Crypto Fear & Greed Index sits at 28 (fear territory), suggesting the purge mostly flushed out the most over-leveraged speculative players.
Daily chart: caught between distribution and a bottoming attempt
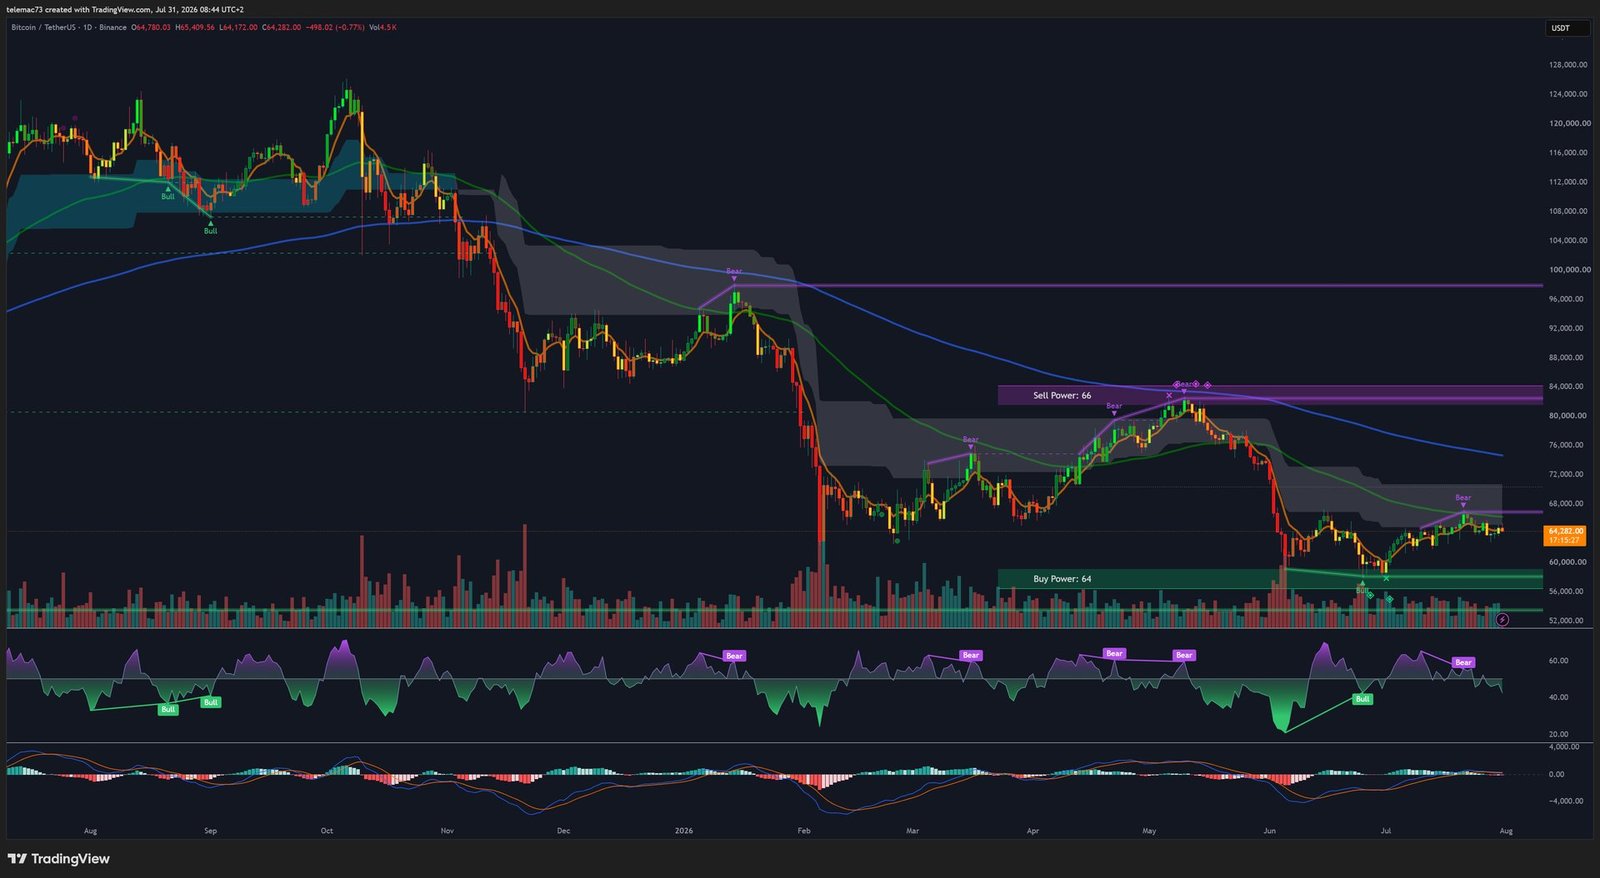
The daily chart illustrates a market caught between a prolonged correction from all-time highs above $70,000 and a laborious bottoming attempt. Price, around $64,282 at the time of analysis, is trying to rebuild a pattern of higher highs and higher lows, though the structure remains technically fragile. The key macro support sits between $62,500 and $63,300, confluent with the 200-week moving average ($62,457): a confirmed daily close below this threshold would open the door to $59,000, or even $54,000. On the upside, the key resistance spans $67,000 to $68,000; reclaiming it would validate a structural bullish trend reversal.
| Key technical level (daily) | Price (USD) | Read |
|---|---|---|
| Macro resistance | 67,000 – 68,000 | Institutional distribution zone |
| Pivot / control point | ~64,300 | Equilibrium, Max Pain influence |
| Immediate support | 62,500 | Accumulation zone |
| 200-week SMA | 62,457 | Trend demarcation line |
| Capitulation zone | 59,000 | Target in a panic scenario |
The daily RSI sits in neutral territory, just above 50, without a marked divergence. MACD recently printed a bullish crossover while still in negative territory, suggesting fading downside momentum — but its failure to durably clear the zero line confirms the market remains in an accumulation phase rather than a confirmed trend.
4-hour view: a compression triangle under close watch
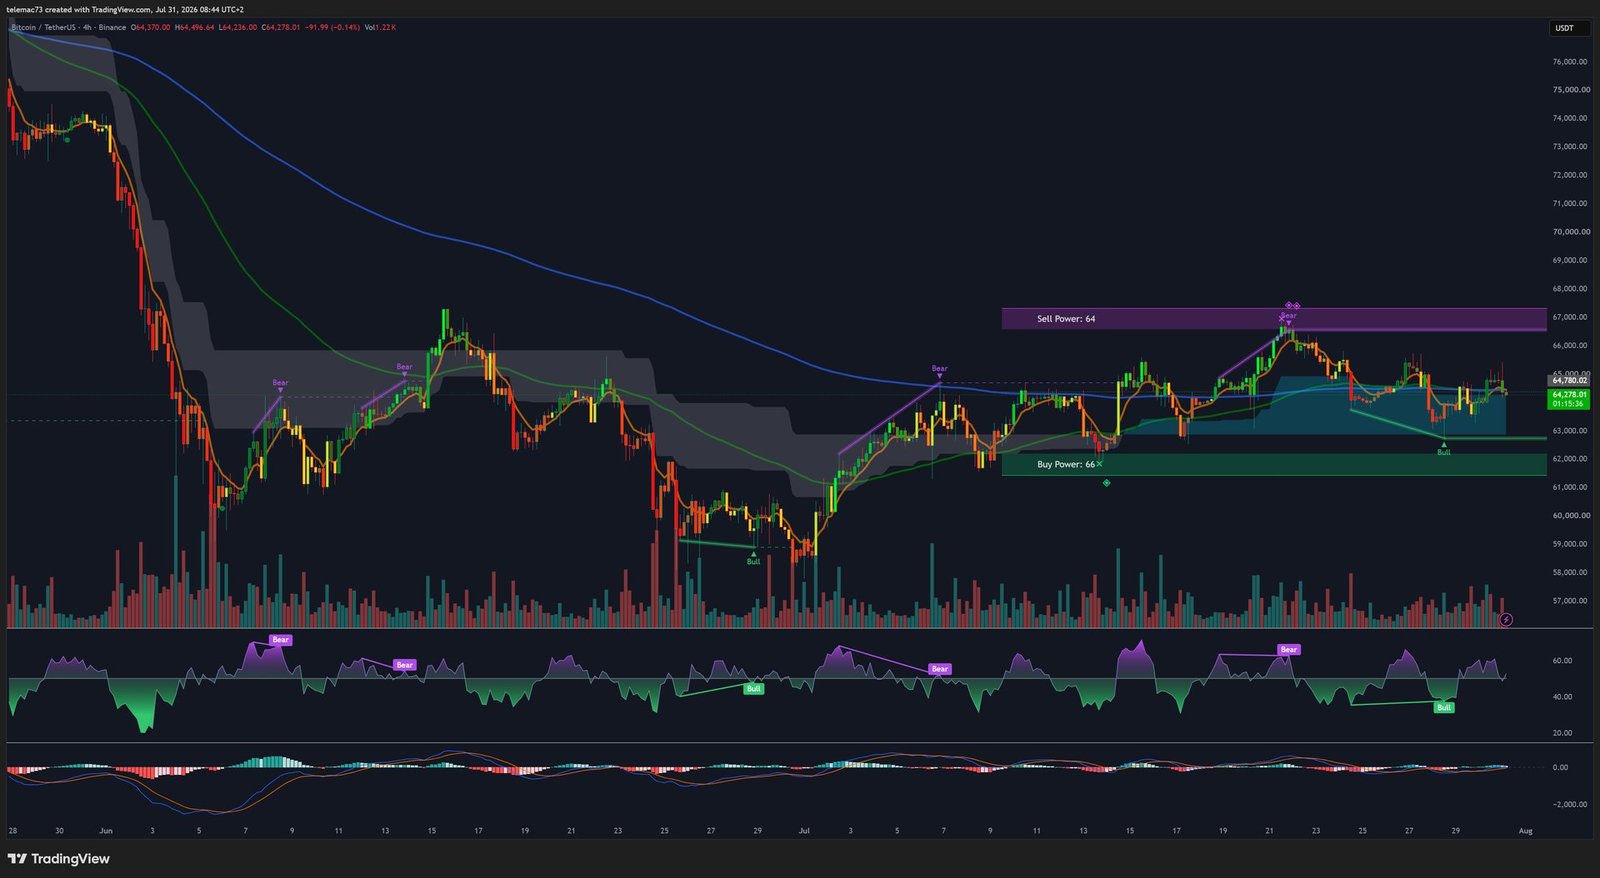
On the 4-hour timeframe favored by swing traders, Bitcoin — frozen around $64,370 — is locked inside a compressing geometric structure. A descending trendline caps successive rallies while a rigid horizontal support aligns the lows, sketching a descending compression triangle that could resemble a bearish continuation pennant. However, repeated recent fakeouts in both directions point more toward a noisy horizontal range than a clean directional pattern.
Medium-term moving averages have flattened and intertwined, a classic signature of trendlessness. The 4H RSI consistently fails to break above 70 (rejected around 60) while being firmly defended below 40, reflecting a market lacking clear directional force in either direction. MACD is flatlining around zero: historically, such momentum compression precedes a violent release of energy, in one direction or the other.
15-minute zoom: liquidity hunts and hidden divergences
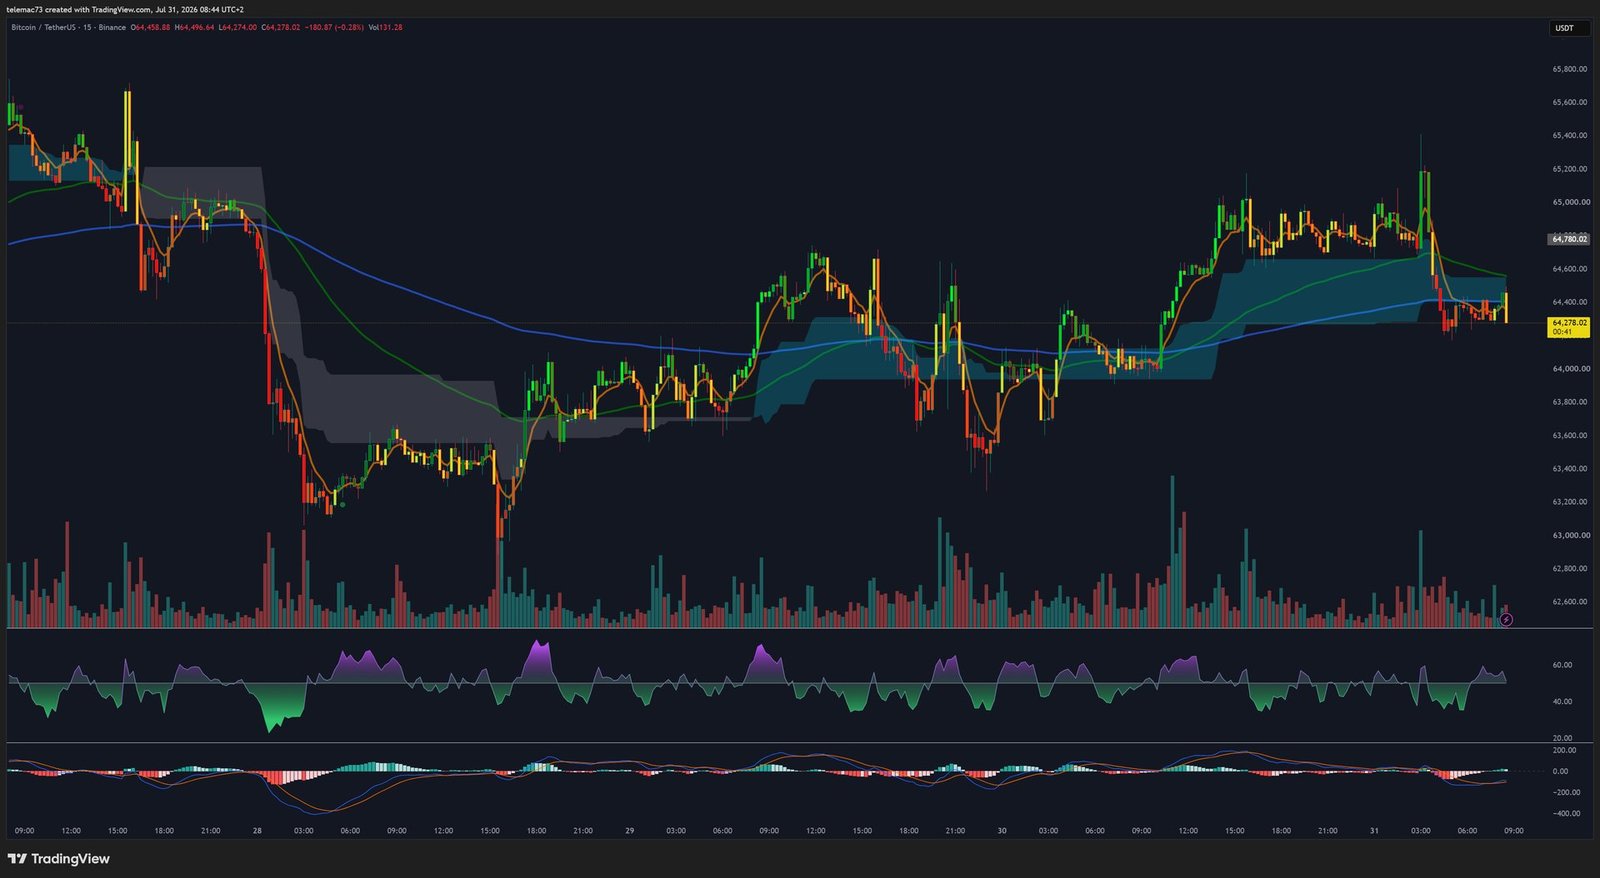
At the intraday scale, the market is dominated by algorithmic noise and impulsive reactions to macro headlines. A sharp collapse from $65,000 down to the $63,300 support swept highly-leveraged longs, before an aggressive V-shape recovery pushed price back toward $64,700 — the signature of a liquidity sweep orchestrated by large institutional players absorbing retail panic selling.
That bullish impulse has since faded for lack of follow-through volume, and price is now drifting sideways-to-lower, punctuated by micro bear flags. The 15-minute RSI reveals recurring hidden bullish divergences: price prints higher lows while the oscillator prints lower lows, suggesting genuine selling pressure is exhausting itself despite the apparent weakness. MACD, in constant crossovers around zero, confirms an environment dominated by stop-hunting.
Order book and heatmap: the walls framing price
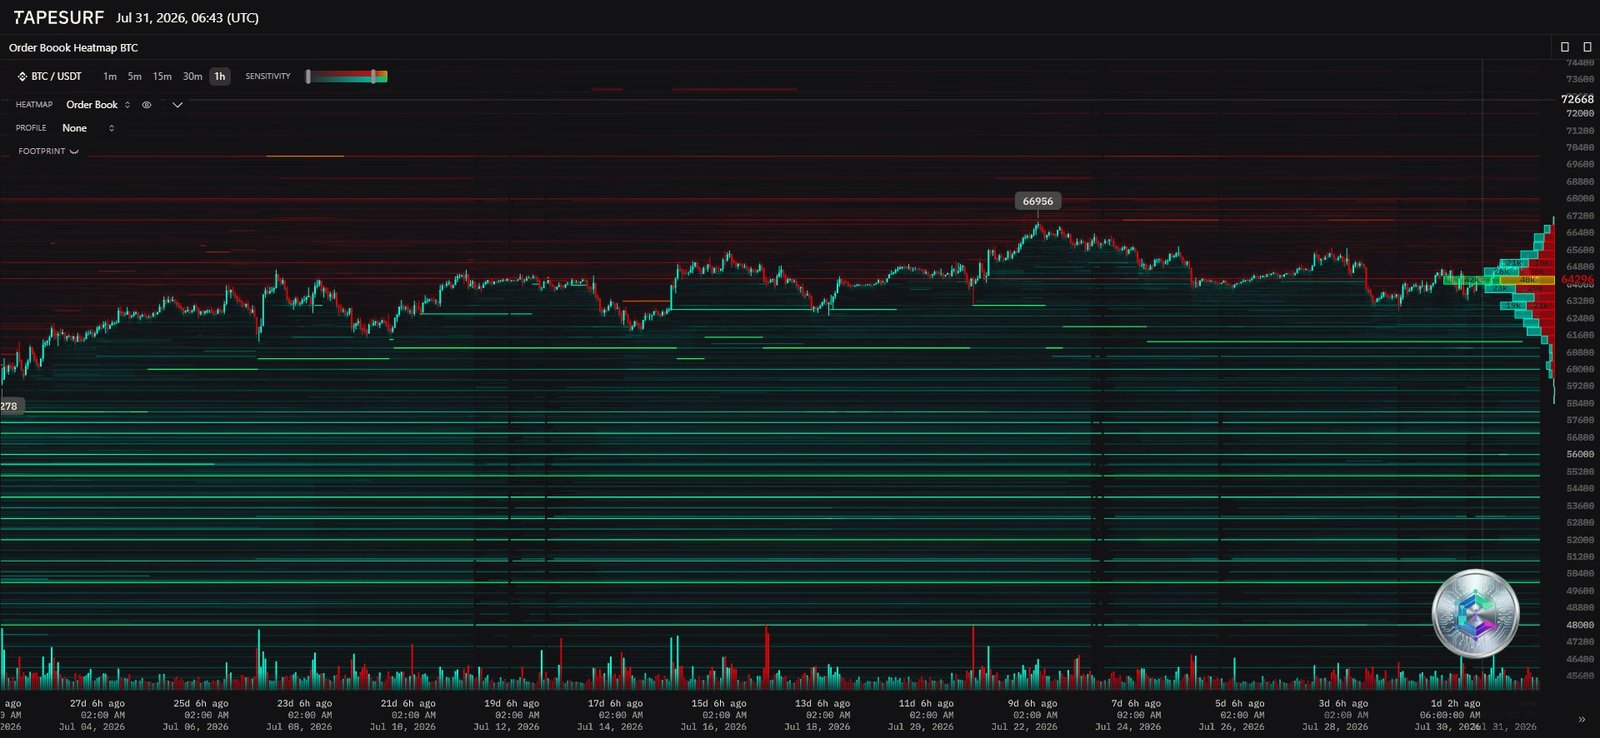
The order book heatmap offers a complementary read to candlestick charts by visualizing the depth of pending limit orders. The equilibrium price hovers around $64,296, framed by a massive sell wall at $66,956 — converging exactly with the resistance zone identified across other timeframes — and a buy-side shield that thickens between $63,500 and $62,000, explaining the earlier V-shaped rejection.
While some of these walls could reflect spoofing — orders placed then pulled within milliseconds to steer the market — the persistence of the red line at $67,000 and its alignment with historical resistances suggest genuine institutional distribution intent at this level. The volume profile’s point of control sits precisely around $64,300, confirming the market has found its short-term fair value between these two liquidity cliffs.
Key takeaways
Bitcoin’s current equilibrium around $64,300 looks more like an illusion of stability than a genuine directional consensus. It is artificially maintained by options engineering (the Max Pain effect), the pull of the volume point of control, and neutralized by a Fed that continues to dampen risk appetite. The compression visible across every timeframe — daily, 4-hour and 15-minute — reflects an accumulation of kinetic energy that will sooner or later need to release.
A confirmed break below $62,000 would invalidate the short-term bullish structure and open the way toward lower levels. Conversely, a decisive reclaim of $67,000, absorbing institutional sell-side liquidity, would be the technical preamble to a move toward higher highs. In the meantime, disciplined position sizing and careful leverage management remain essential.
Disclaimer: This article is provided for educational and informational purposes only. It does not constitute investment advice, a recommendation to buy or sell, or an inducement to carry out any financial transaction. Cryptocurrency markets are highly volatile and carry a risk of capital loss. Do your own research and consult a qualified financial advisor before making any investment decision.

