


July 24, 2026 — Bitcoin is navigating an especially turbulent July, marked by a rare convergence of macroeconomic shocks, massive liquidations, and regulatory uncertainty. Yet the asset shows remarkable resilience, stabilizing around $65,000 after bouncing sharply from a capitulation low near $55,800. Here’s a breakdown of a market under pressure, caught between historic selling forces and a strong return of institutional capital.
A paradoxical macro backdrop
Escalating geopolitical tensions in the Middle East pushed oil prices above $100 a barrel early in the month, reviving inflation fears and triggering a sharp rise in U.S. bond yields. This environment initially weighed on Bitcoin, pushing it below $63,000 as risk-parity strategies mechanically trimmed exposure to volatile assets.
But the more significant development of late July lies elsewhere: the spectacular collapse of U.S. tech stocks, the so-called “Magnificent Seven,” which shed nearly $797 billion in market capitalization over just a few sessions amid growing concerns over the profitability of massive AI infrastructure spending. Against expectations, Bitcoin did not follow this decline, holding steady around $65,400. This divergence fuels a broader thesis: Bitcoin may be starting to decouple from the tech-driven speculative cycle and assert itself as an alternative reserve asset.
In the background, U.S. federal debt, approaching $40 trillion, continues to reinforce institutional appetite for strictly supply-capped assets like Bitcoin, increasingly viewed as a hedge against monetary dilution.
A historic supply shock absorbed without breaking the market
The first half of July brought together several bearish events rarely seen at the same time. The German government liquidated roughly 40,000 BTC seized in judicial proceedings, worth $2.2 to $3 billion, mostly through over-the-counter transactions. Despite the discretion of these sales, the psychological impact triggered a cascade of liquidations among leveraged traders, dragging prices down to $55,800.
At the same time, the defunct Mt. Gox exchange began repaying creditors via Kraken, reviving fears of large-scale selling from holders sitting on more than a decade of gains. Miners, under pressure following the latest halving, sold nearly 30,000 BTC in June alone, pushing their reserves to their lowest level in a decade — a classic signal of a bear-cycle bottom.
Faced with this massive supply, whales and institutional investors deployed an aggressive accumulation strategy, absorbing roughly 270,000 BTC in just two weeks — an injection of about $16.7 billion into the market. This wealth transfer, from so-called “weak hands” to “strong hands,” has significantly reduced the liquid supply available on exchanges.
ETF flows turn positive again
After eight consecutive weeks of net outflows between May and June — more than $8 billion pulled from U.S. spot Bitcoin ETFs — the trend abruptly reversed in mid-July. Six consecutive sessions of net inflows drained roughly $930 million in fresh liquidity, with $727 million concentrated in the five days before July 21. Total assets under management across these ETFs now stand at $80.9 billion, with cumulative net inflows of $51.8 billion since their January 2024 launch.
One caveat remains: some year-to-date flows are still running $4.8–5.2 billion in deficit, and the execution lag inherent to ETFs means the real impact of these recent inflows on the spot price could continue to unfold over the coming weeks.
The CLARITY Act: a regulatory sword of Damocles
The market remains suspended on the fate of the “CLARITY Act,” the bill meant to establish the first unified regulatory framework for crypto-assets in the United States, with a critical deadline set for August 10, 2026. The text would impose strict decentralization criteria on DeFi protocols and would open the door for non-bank issuers to launch stablecoins, provided they are backed by high-quality collateral.
The bill’s progress is nonetheless hampered by significant ethics controversies, particularly around personal income derived from crypto activities by several political figures. A legislative deadlock before the August 10 deadline could revive regulatory uncertainty and weigh on market sentiment.
Derivatives and liquidity: the “Max Pain” mechanics
This Friday, July 24, the market faces the expiration of 19,000 Bitcoin options contracts, representing $1.2 billion in notional value. The Put/Call ratio stands at 0.89, signaling a moderately bullish institutional sentiment — in contrast to Ethereum, whose 1.25 ratio reflects persistent distrust. The “Max Pain” point, calculated at $64,500, largely explains the price stagnation around this level over the past 48 hours, as options sellers have an interest in seeing the market close near this threshold.
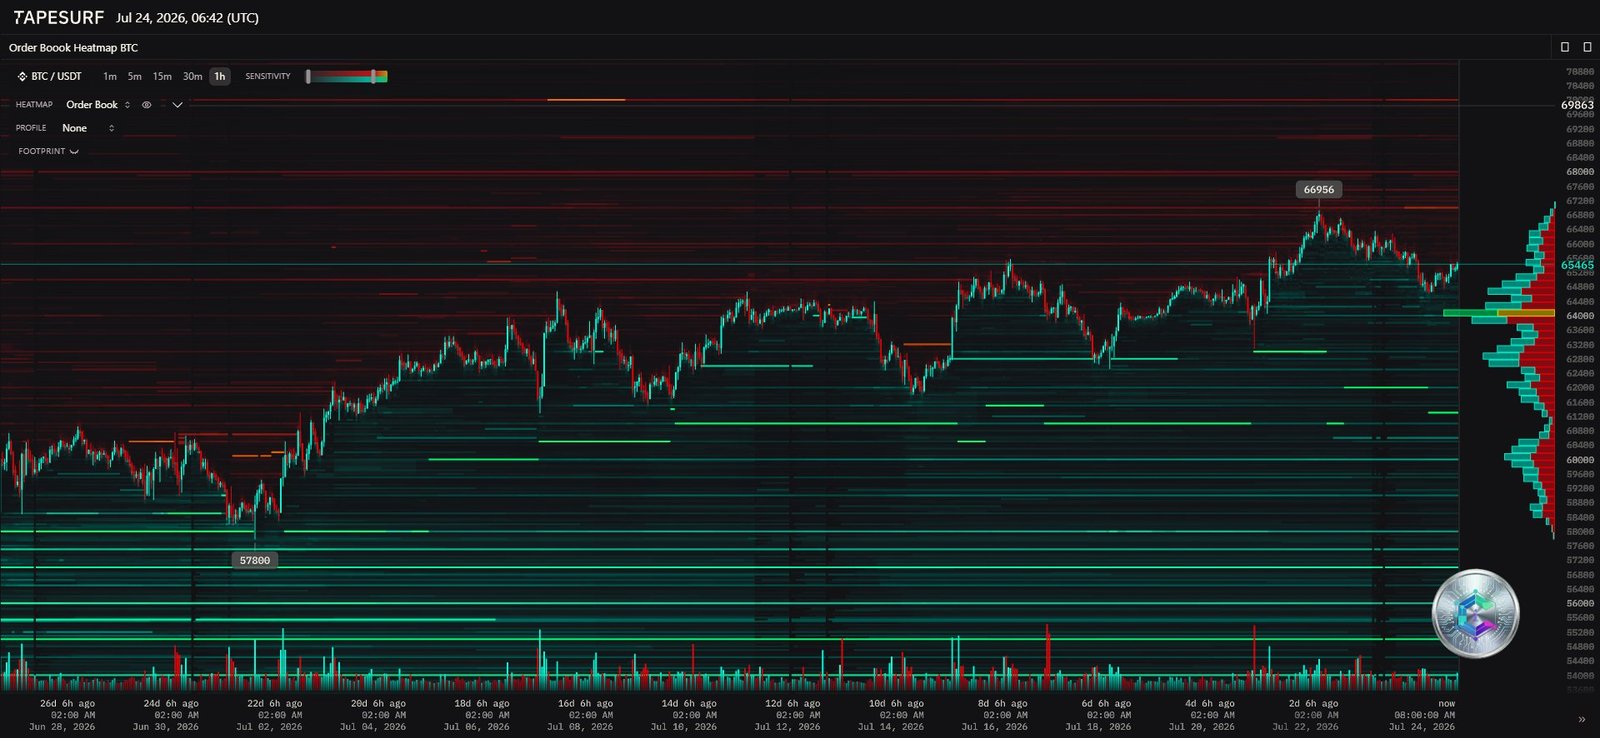
The order book heatmap reveals a dense resistance zone between $67,000 and $69,800, where significant sell orders and liquidation thresholds of numerous short positions are concentrated. Conversely, a massive intermediate support forms around $63,000, with a deeper defensive wall anchored at $57,800. The proximity of the current price to these low-friction zones suggests rapid liquidity-hunting moves once the options expiry has passed.
Multi-timeframe technical analysis
Daily chart: the structural trend
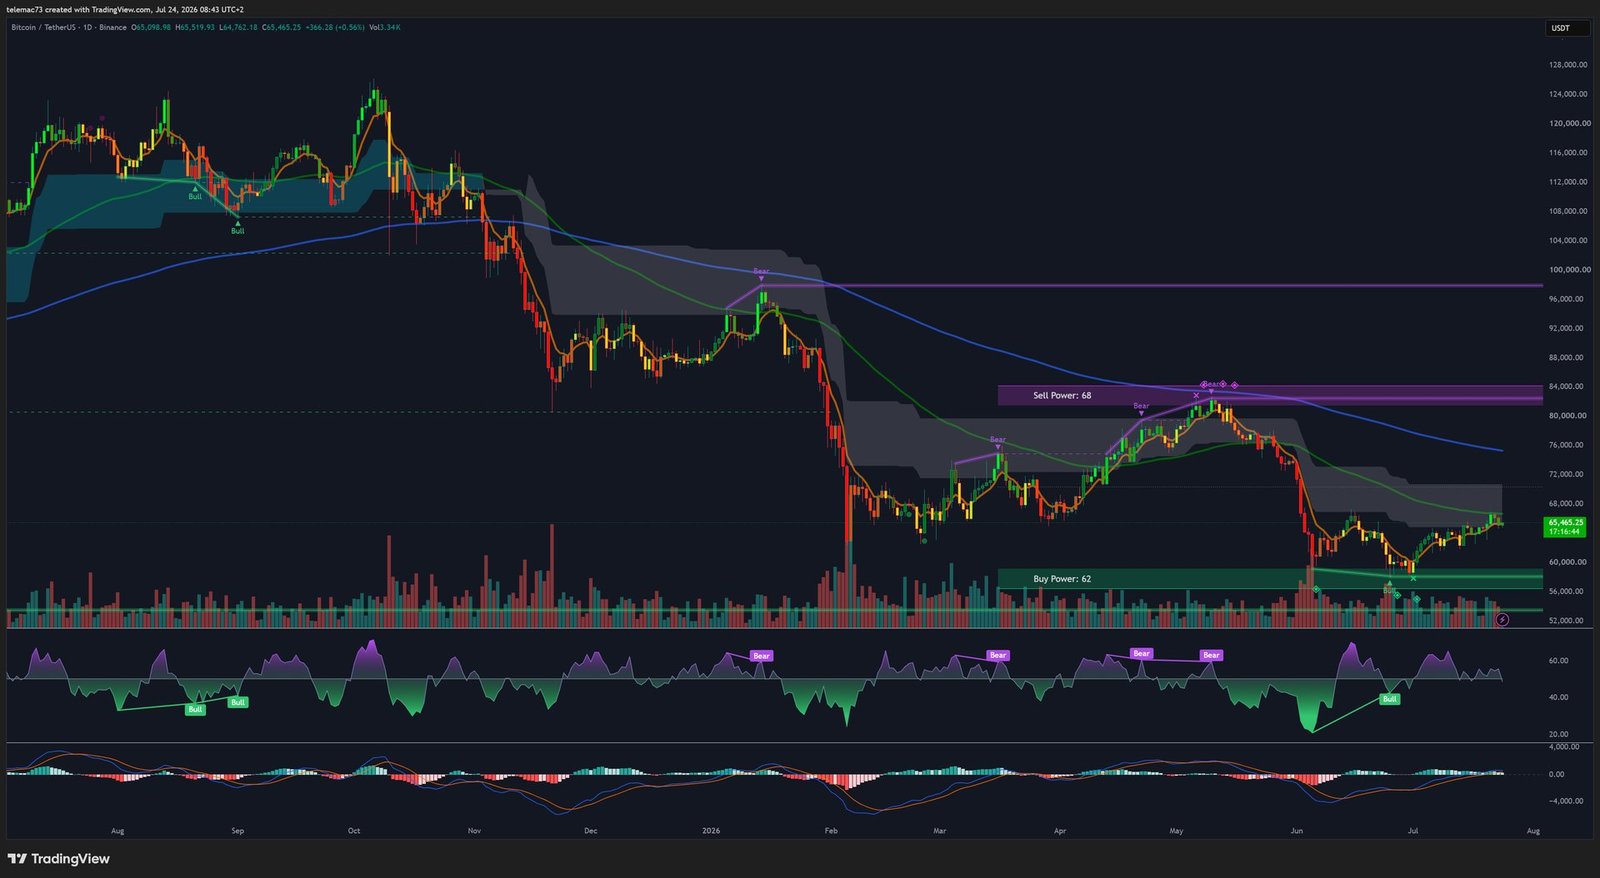
After a steep drop from highs above $70,000 down to the $53,000 zone, Bitcoin formed a powerful “V”-shaped rebound, bringing the price back to $65,465. This categorical rejection of lower levels potentially validates a quarterly “Higher Low.” The daily RSI, which had plunged into extreme oversold territory, has recovered into a neutral-to-bullish zone (55-60), while the MACD shows a clean bullish crossover — a signal traditionally read as a buy signal coming out of capitulation.
4-hour chart: the medium-term dynamic
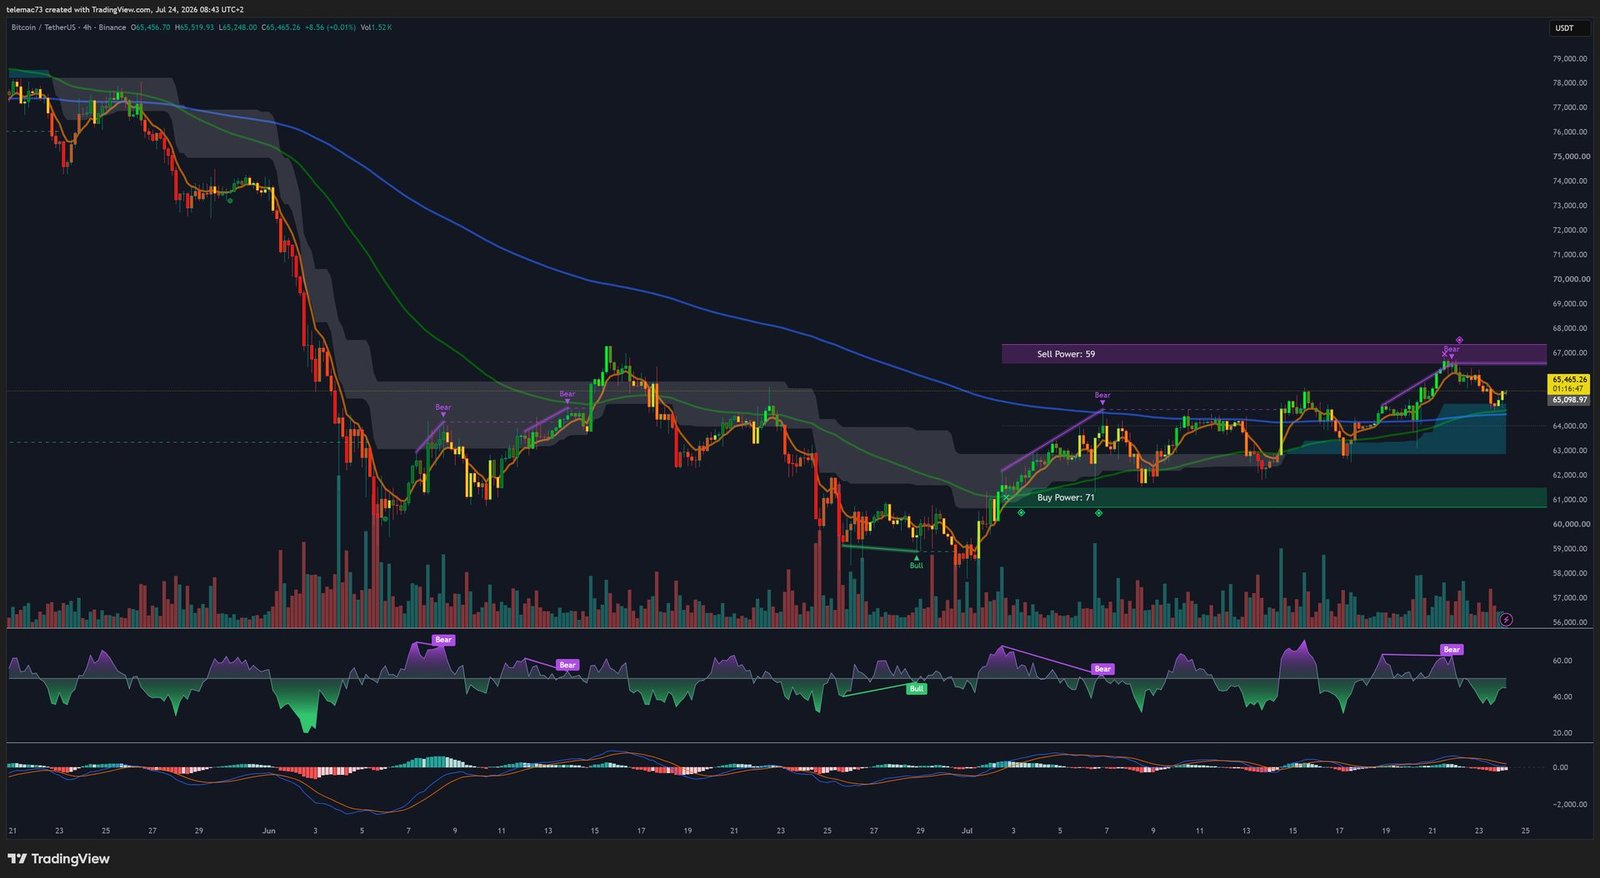
Since the $53,000 zone, price has been consolidating in a slightly descending bull flag or symmetrical compression triangle — a classic continuation pattern following a powerful rally. Immediate resistance sits around $66,200, while the triangle’s support is firmly defended near $63,500. A minor bearish divergence on the 4H RSI suggests a healthy pause ahead of a possible breakout attempt.
15-minute chart: intraday microstructure
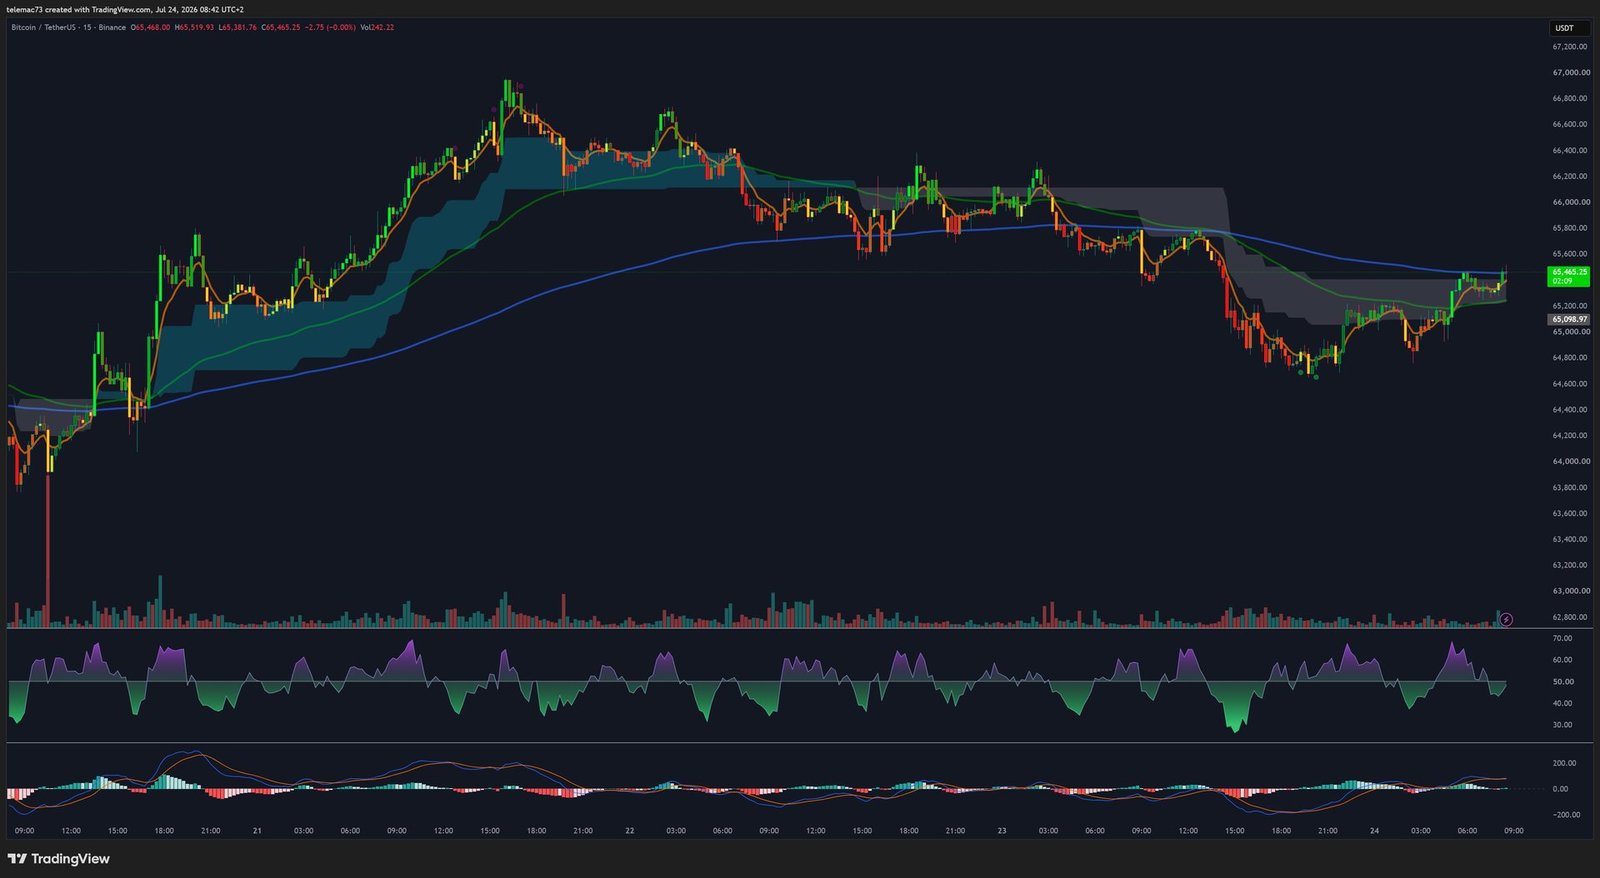
On a very short-term basis, the market is trading in a tight, erratic corridor, typical of the wait ahead of options settlement. Volatility bands are extremely compressed, favoring scalping strategies at the expense of leveraged directional positions. The first decisive close outside this envelope, accompanied by expanding volume, should dictate the directional impulse for the upcoming session.
Two scenarios for the coming weeks
Bullish scenario (high probability): once the options expiry passes, a breakout of the 4H bull flag, confirmed by a MACD crossover on the daily chart, could trigger a short squeeze pushing prices through the $67,000-$69,800 resistance zone. Turning $68,000 into support would open the path toward $70,000-$73,000, a scenario reinforced by successful passage of the CLARITY Act.
Retracement scenario (low to moderate probability): if the current impulse turns out to be a bull trap supported by shallow liquidity, a sharp macroeconomic deterioration or a political deadlock around the CLARITY Act could send prices back toward the $63,000 pivot support, or even down to the $57,800 liquidity wall, with an extended consolidation phase through the rest of Q3.
On prediction markets, a Polymarket contract with over $15.7 million in trading volume assigns a 78.5% probability that Bitcoin stabilizes above $67,500 by the end of July, while other platforms like Robinhood point to a strong consensus for prices holding structurally above $64,000-$65,000 in the near term.
Conclusion
Bitcoin’s market is navigating July 2026 with extraordinary resilience, absorbing billions of dollars in forced selling while potentially beginning to decouple from the tech-driven speculative cycle. The technical purge appears complete across multiple timeframes, and the return of institutional capital through ETFs reinforces this dynamic. Resolution of the CLARITY Act by August 10 remains the key variable that will determine the direction of the next quarter.
Disclaimer: this article is provided for strictly informational and educational purposes. It does not constitute financial advice, an investment recommendation, or a solicitation to buy or sell digital assets. Cryptocurrency markets are volatile and carry significant risk of capital loss. Always do your own research and consult a qualified financial advisor before making any investment decision.

