


Solana (SOLUSDT) trades around $72.46 on the daily chart, after a string of lower highs and lower lows. The MACD below zero, the RSI at 42 and the price position below all major moving averages (MAs) outline an intact bearish trend, despite a few hesitant short-term signals.
🔑 Key takeaways
- Daily: lower-highs/lower-lows structure, price below SMA20 ($75.09), SMA50 ($75.07) and SMA200 ($85.41)
- Daily MACD below zero (-0.375); last bearish crossover on 12/07 (22 candles ago)
- Daily RSI14 at 42.39 — neutral, with confirmed bearish divergence on swing highs
- 4H: MACD just crossed bullish (02/08) but stays below zero — unconfirmed reversal signal
- Catalysts: MSOL ETF (+$19M on 31/07), KSNET (330K Korean merchants) vs bearish technical pressure
Daily structure: bearish underlying trend
Solana’s daily chart displays a clear lower-highs/lower-lows structure since the 04/07 peak at $83.98. The swing-high sequence — $83.98 → $79.04 → $78.88 → $77.50 → $75.29, then the current $72.46 — confirms a progressive loss of buying momentum.
Swing lows follow the same logic: $76.29 → $74.10 → $73.39 → $73.44 → $72.32. The spot price at $72.46 trades essentially on top of this last low, making it a critical invalidation level in the short term.
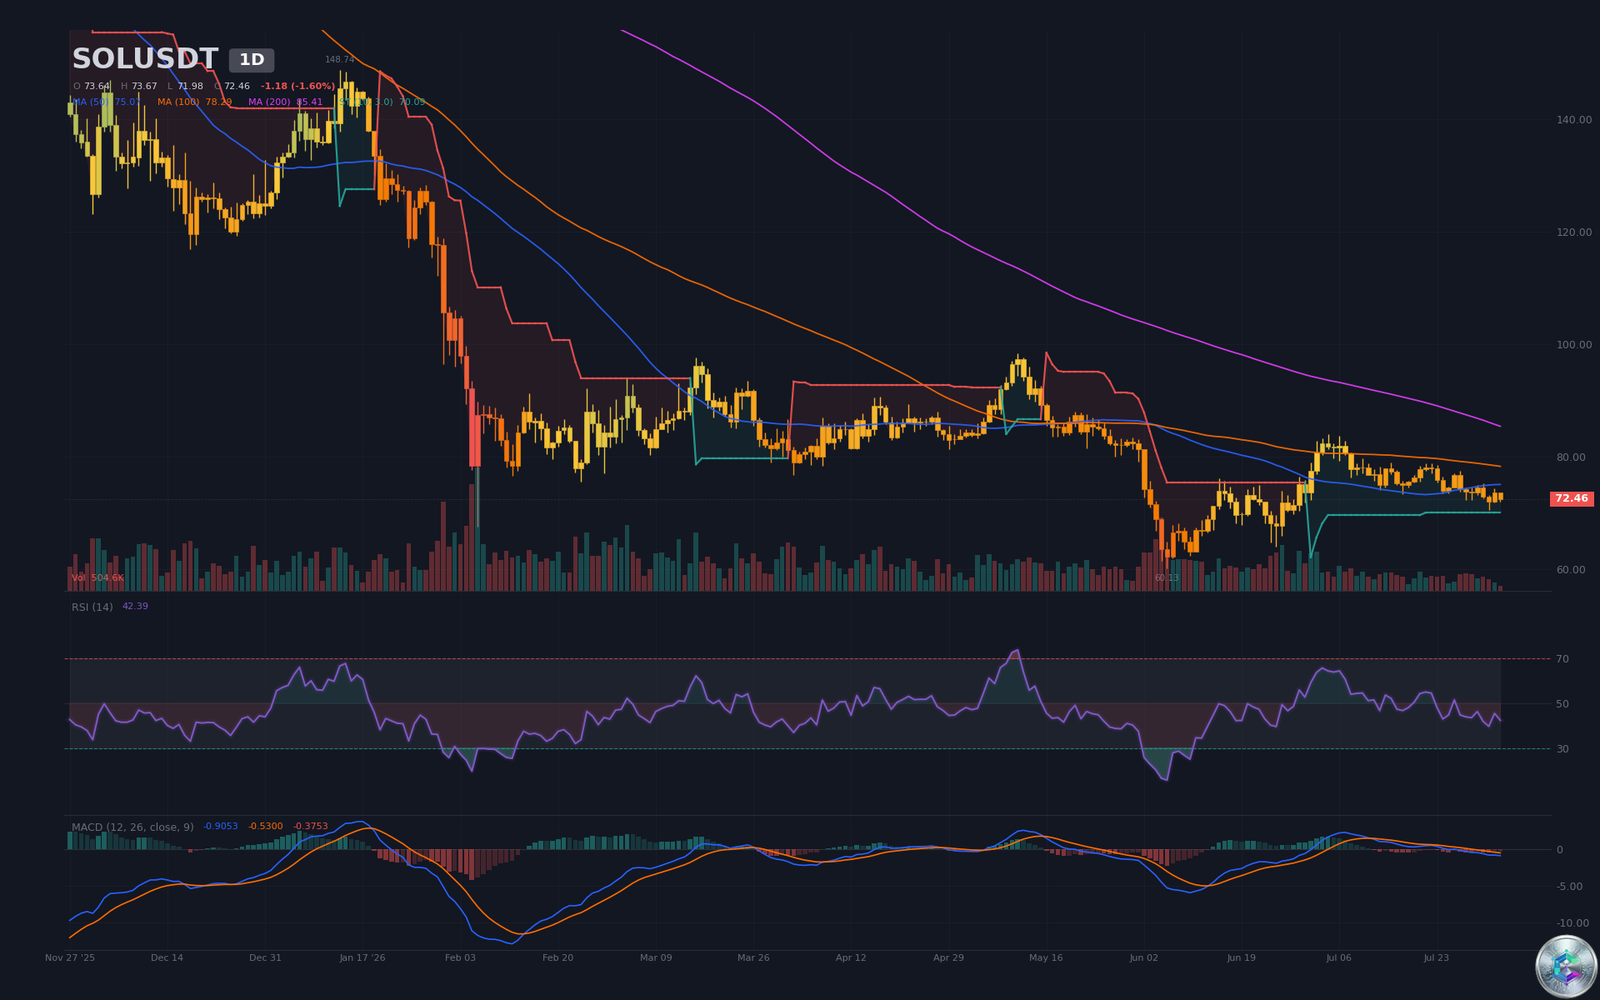
The RSI14 at 42.39 stays in neutral territory, but the bearish divergence on swing highs is now confirmed: the 31/07 peak at $75.29 posted an RSI of only 41.92, versus 64.39 at the $83.98 top. The MACD (line -0.905 / signal -0.530 / histogram -0.375) has remained below zero since the bearish crossover on 12/07 (22 candles ago) — underlying momentum remains skewed to the sell side.
“As long as Solana trades below SMA20 ($75.09) and SMA50 ($75.07), the bearish bias remains the priority on the daily.”
cryptoinfo.ch analysis, August 2026
4H momentum: fragile reversal below resistance
On the 4-hour chart, the spot price at $72.50 remains trapped in a short-term bearish dynamic. 4H swing highs — $77.50 → $74.59 → $74.53 → $75.29 → $73.66 → $74.33 — reproduce the LH/LL pattern seen on the daily. The 4H RSI14 at 43.28 stays neutral, after touching 28.90 during the spike to $70.58 on 01/08 (a brief oversold excess quickly absorbed).
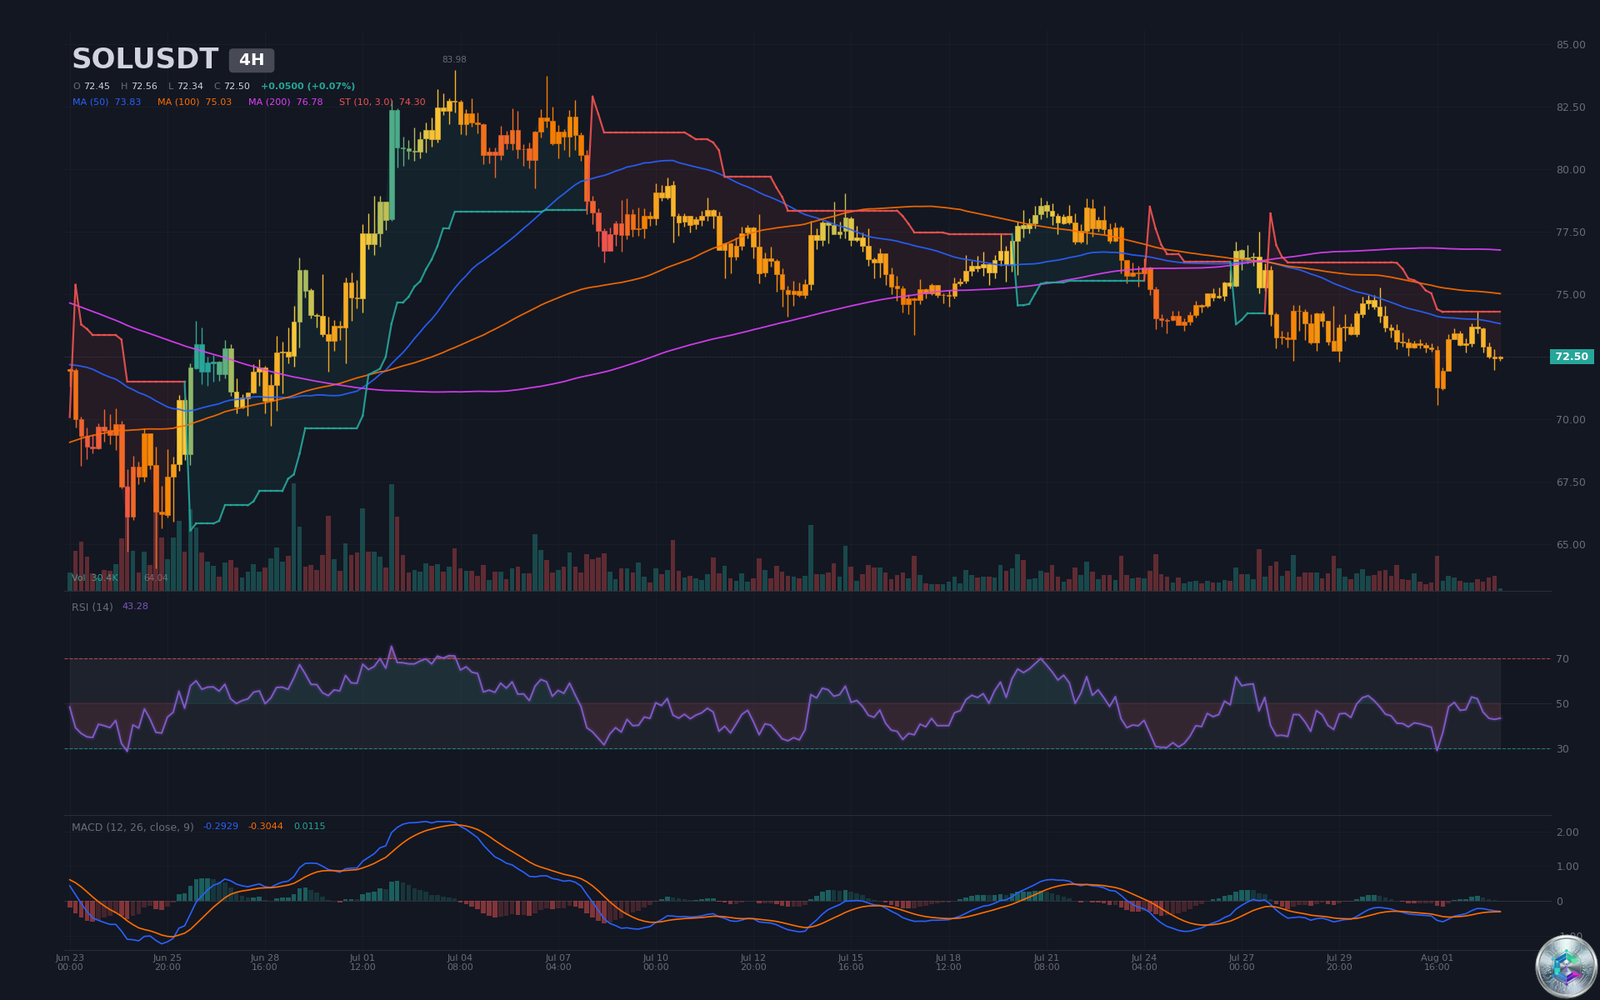
The 4H MACD delivers an ambiguous signal: the line (-0.293) just crossed above the signal (-0.304) with a positive histogram of +0.011, but the entire setup stays below the zero line. This bullish crossover on 02/08 at 04:00 (8 candles ago) is an early reversal signal that needs volume and a break of $73.66 to confirm.
The 4H death cross (50/200 MA bearish crossover) formed on 27/07 at 12:00, only 42 candles ago. Price trades below the 4H SMA20 ($72.90), SMA50 ($73.83) and SMA200 ($76.78). 4H volume — 30,404 vs 175,566 average (ratio 0.17) — reflects a near-total absence of buying participation, which invalidates any rebound not backed by flows.
S/R zones to watch on the 4H
- Immediate resistance: $73.66 (last swing high) then $74.33
- 4H pivot zone: $72.41 (P), $72.85 (R1), $72.02 (S1)
- Critical support: $71.58 (4H S2) then $70.58 (period low)
Short-term entries: 15-minute price action
On the 15-minute chart, Solana is gradually extracting itself from a capitulation zone. The bearish candle on 03/08 at 08:30, which marked a low at $71.98 on a volume of 28,718 (forced selling), was immediately absorbed: price recovered above $72.40 in the following hours, drawing a higher low ($71.98 → $72.39) characteristic of a short-term base.
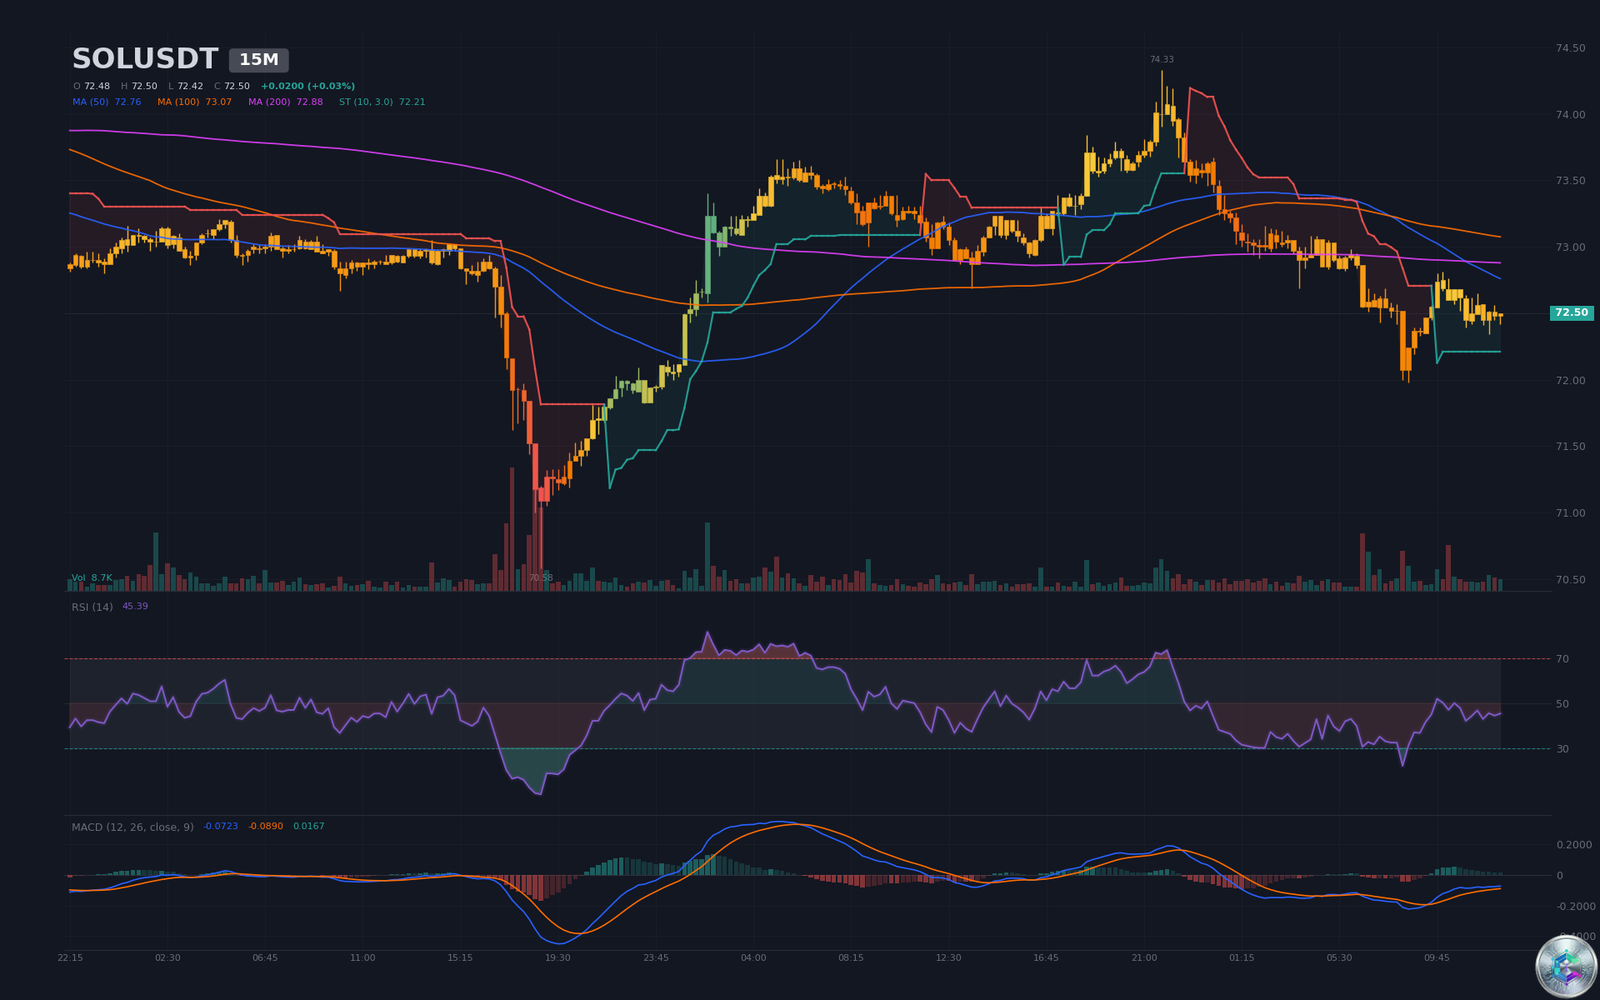
The 15M RSI14 at 45.39 has exited oversold territory (low at 30.05 at 02:15) without tagging any bullish excess. The 15M MACD shows a positive histogram of +0.017 since the bullish crossover on 03/08 at 09:30 (12 candles ago). However, price stays below SMA50 ($72.76) and SMA200 ($72.88), and a new 50/200 bearish crossover formed on 03/08 at 11:00 (6 candles ago). The 15M structure therefore remains fragile.
Key levels and confluence
The convergence of the three timeframes places Solana in a bearish 3/5 setup (LL/LH structure, price below all Daily/4H MAs, Daily MACD below zero), counterbalanced by an early bullish signal on 4H/M15 that is unconfirmed by volume. Here is the full level map:
| Type | Level ($) | Distance vs spot | TF | Comment |
| Major resistance | 85.41 | +17.87% | Daily | SMA200 — cycle resistance |
| Resistance | 75.07 | +3.60% | Daily | SMA50 — major pivot |
| Resistance | 74.66 | +3.04% | Daily | R1 pivot |
| Resistance | 73.66 | +1.66% | 4H | Last 4H swing high |
| Resistance | 73.30 | +1.16% | Daily | Pivot P |
| Spot price | 72.46 | 0.00% | Daily | Last close |
| Support | 72.26 | -0.28% | Daily | Daily S1 pivot |
| Support | 71.58 | -1.22% | 4H | 4H S2 pivot |
| Support | 70.90 | -2.15% | Daily | Daily S2 pivot |
| Support | 70.58 | -2.60% | 4H/M15 | Period low |
| Extreme support | 60.13 | -17.02% | Daily | 250-day low |
Fundamental catalysts
On the news side, several catalysts temporarily ease selling pressure without reversing the technical dynamic:
- 31/07 — Morgan Stanley’s MSOL ETF attracted $19.06M on its second trading day (CryptoRank/HTX), the largest SOL ETF inflow since mid-May
- 31/07 — The Solana Foundation signed an MoU with KSNET to integrate Solana Pay across 330,000 Korean merchants processing $4B/month (HTX/CoinEdition)
- 31/07 — A Daily triangle apex is forming between ~$98 (May) and ~$60.29 (June): the 0.382 Fibonacci at $74.79 is the last line of defense before a potential breakdown toward $60
- 02/08 — Polymarket prediction markets: probability of <$70 in August priced at 75%, versus 48% for >$80 (AMBCrypto)
- 02/08 — Media narrative tilts heavily bearish: “Can Solana hold $60?” (AMBCrypto), “Must reclaim $75 or drop to $60” (Coinpaper)
Conclusion and trading scenarios
Solana’s Daily structure remains the dominant variable: a lower-highs/lower-lows trend, a MACD below zero for three weeks, and price below all major MAs. The primary scenario (60% probability) favors selling rallies into the $72.85 – $73.30 zone (4H SMA20 / Daily P pivot), with a stop beyond $74.20 (above the 4H swing high $73.66 + 1×4H ATR of $0.81). Targets sit at $70.90 (Daily S2, R:R ≈ 2.1:1) then $70.58 (4H/M15 low, R:R ≈ 2.4:1).
The alternative scenario (40% probability) — a bullish reversal — would require a validated 4H break of $73.66 with volume above the 175,566 average, followed by a retest. Targets would then be $74.66 (Daily R1) then $75.07 (Daily SMA50). The Polymarket prediction market prices this reversal at only 48% for >$80 by end of August, consistent with the technical read. As long as $73.66 holds, sellers keep the upper hand.
Sources
- CryptoRank — MSOL ETF inflows 31/07/2026
- HTX Markets — KSNET partnership Solana Pay 31/07/2026
- CoinEdition — Triangle apex pattern 31/07/2026
- AMBCrypto — Can Solana hold $60? 02/08/2026
- Coinpaper — Must reclaim $75 or drop to $60 02/08/2026
- Polymarket — Solana <$70 probability 02/08/2026
This article is published for informational and educational purposes only. It does not constitute investment advice. Do your own research (DYOR) before any decision.

