


Ethereum trades around $2,563 on the ETHUSDT pair in the first week of October, down 4.96% on the latest daily candle and 8.69% below the period high of $2,806.80 set on September 21, 2026. Price action remains dominated by an algorithmically confirmed double top below the $2,626 zone, immediately relayed on the 4H by a severe oversold phase (14-period RSI at 24.51) contained within a symmetrical triangle whose apex is projected around October 12. On the 15-minute, a falling wedge and a regular bullish divergence sketch an intraday technical bounce, without invalidating the broader downtrend. ETH is thus working through a post-ETF buyer purge whose resolution will set the trajectory of the altcoin complex over the next two weeks.
The dominant flow over the past five days remains the persistent divergence between Bitcoin and Ethereum on US spot ETFs. According to Cointelegraph (October 7, 2026), Bitcoin ETFs returned to net inflows of $119M on Tuesday, reversing the prior day’s $90M of outflows, while Ethereum ETFs extended a six-session streak of withdrawals totaling $408M, including $202M on Tuesday and $51M on Monday. This mechanical imbalance compresses Ethereum’s spot market share. The Block and Cointelegraph (October 7) report more than $550M of liquidations over 24 hours, including $487M of long positions, as Bitcoin briefly breached $84,000 before stabilizing around $83,900.
On the macro side, CNBC (October 7) confirms the US 10-year yield hit 5.35% on Tuesday, its highest level since 2002, sustained by inflation concerns. The October 2 NFP print — 29k versus 90k consensus, with the unemployment rate at 4.2% — revived the stagflation theme, reinforced by the Fed which, according to Decrypt (October 6), raised rates to 3.75%. The calendar thickens with the FOMC minutes tonight at 20:00 Zurich time followed by the US CPI m/m on Wednesday October 14, two direct catalysts for ETH volatility. Idiosyncratic catalysts remain mixed: BitMine has set a 5% ceiling on ETH supply accumulation (up to $334M in annual staking revenue per Cointelegraph, October 7), the Glamsterdam upgrade is being deployed on the Sepolia testnet, but The Block and Decrypt (October 6) report the shutdown of L2 Abstract on December 15 after “tens of millions” in losses, illustrating the brutal consolidation of the L2 landscape. In Russia, Sberbank will launch BTC/ETH/USDT products on December 1 (Cointelegraph, October 7) — a vector of structural demand over time. Macro and ETF flows therefore contradict and extend the short-term technical signal.
Multi-Timeframe Technical Analysis
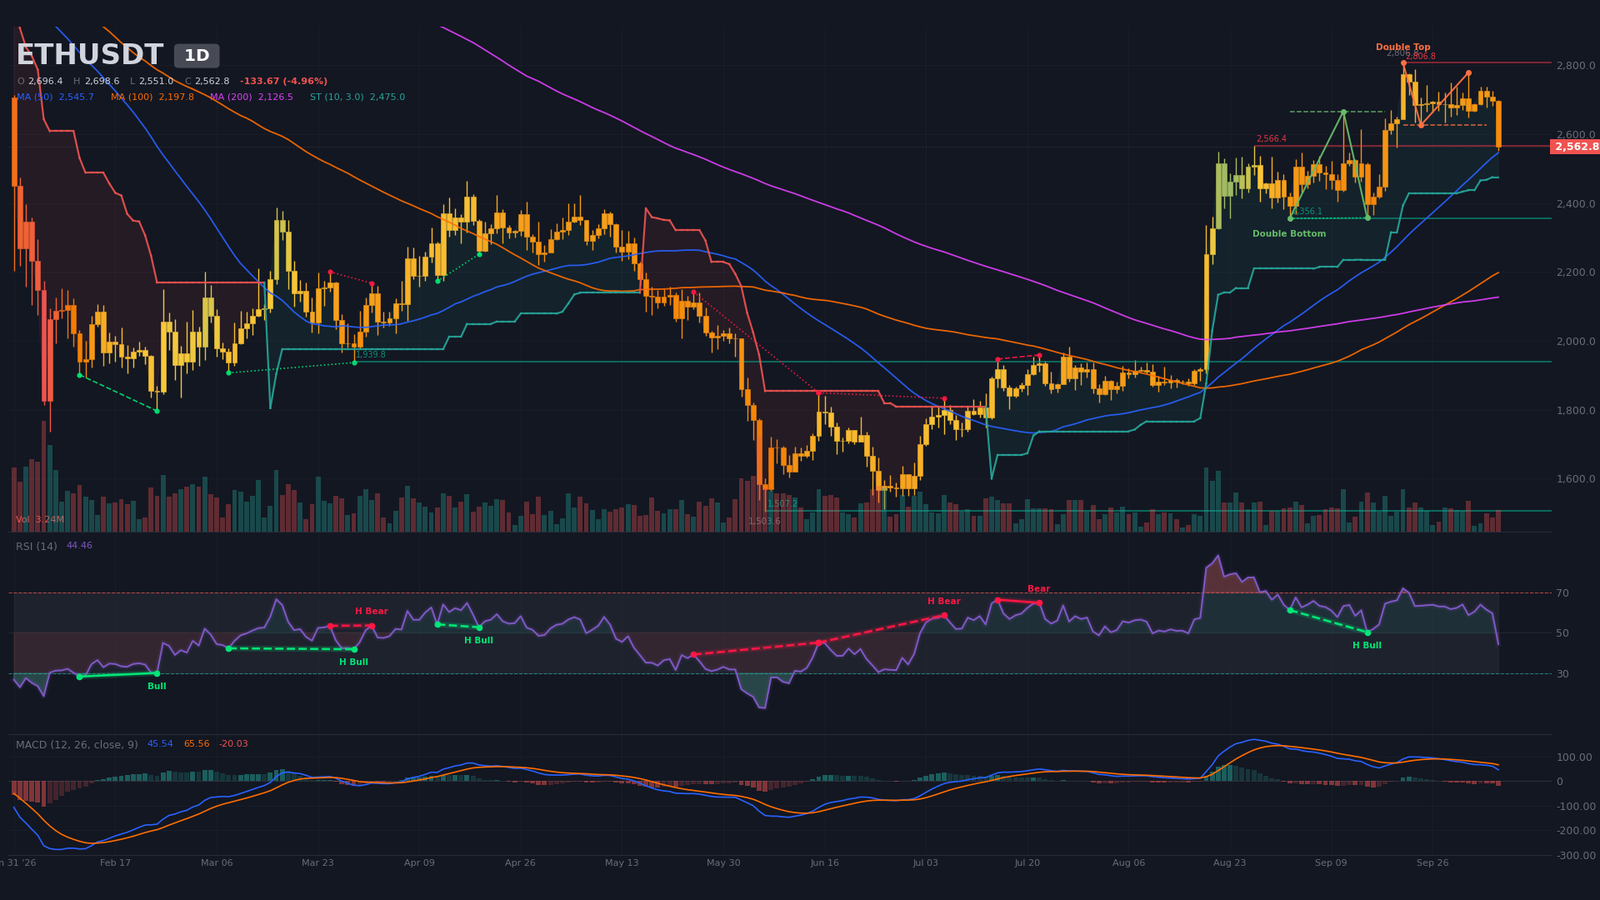
Daily Timeframe (1D): Confirmed Double Top Below Resistance
The daily structure remains marked by an algorithmically confirmed double top: successive peaks at $2,779 (October 2) and $2,806.80 (September 21) connected by a neckline at $2,626. The theoretical target of this bearish pattern sits at $2,459.10. The price, closing the October 7 candle at $2,562.80, has just tested that target and is butting against the algorithm resistance at $2,566.40 (1 touch, +0.14% distance), serving as the immediate pivot. The moving average picture confirms the diagnosis: the price trades below the SMA20 ($2,682.90), remains above the SMA50 ($2,545.70) and especially the SMA200 ($2,126.50), preserving the very long-term bullish structure. The SMA50/SMA200 Golden Cross of August 31, 2026 remains the mother structure.
The 14-period RSI at 44 stays neutral, after a series of eight readings between 58 and 64 — a simple loss of momentum, not a trend reversal. The MACD validated a bearish crossover on September 28, with a negative histogram at -20.03 expanding. The 14-period ATR at $86.18 (3.36% of price) and daily volume of 3.23M against a 20-period average of 3.15M (ratio 1.03) confirm a distribution phase below resistance, with above-average volume on the bearish candle — typical of a selling climax. The daily SuperTrend remains bullish ($2,475), suggesting the current purge is trend consolidation rather than an installed reversal. Finally, a recent hidden bullish divergence (September 2-15, price 2,355 → 2,357, RSI 61.3 → 50.3) had supported the rally leg toward $2,806.
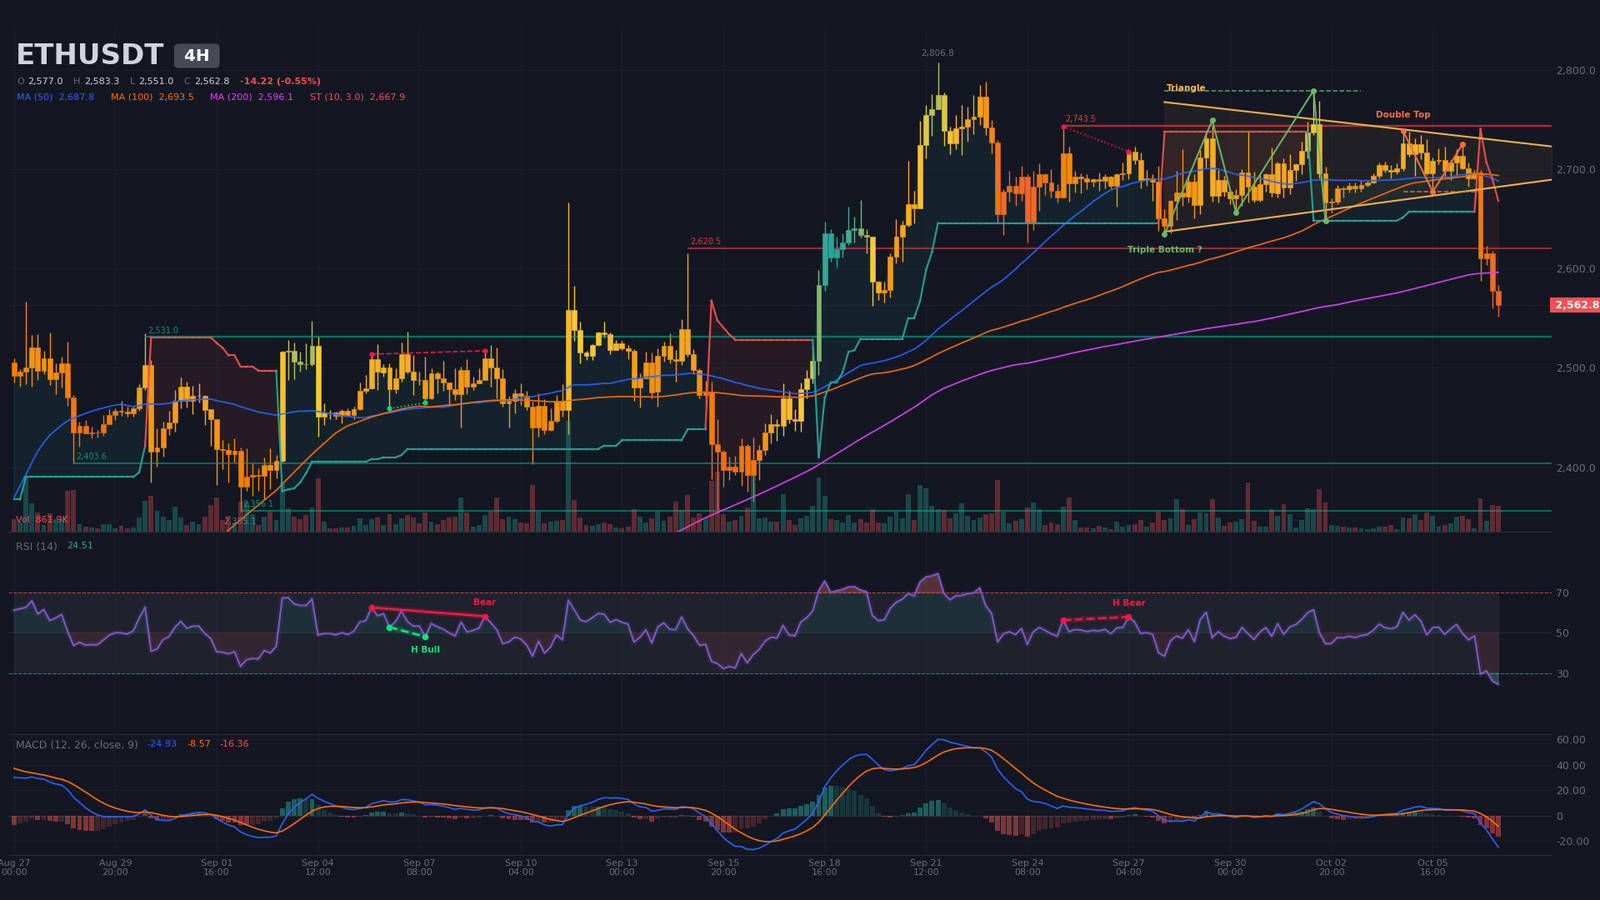
Intermediate Dynamics (4H): Oversold and Symmetrical Triangle
The 4-hour structure reveals a controlled capitulation phase within a symmetrical triangle: upper bound $2,733 (algorithmic resistance $2,743.50 at 3 touches), lower bound $2,677.20 (support $2,531 at 3 touches serving as backup floor), apex estimated October 12 at 17:27 Zurich time. The October 7 04:00 UTC candle broke the lower bound downward with volume of 1.11M against 421k average (ratio 2.05). The oversold state is severe: 14-period RSI at 24.51 after nine consecutive readings below 32, the lowest in the analyzed window. This level has historically preceded technical rebounds, but the MACD remains negative (-24.93 / -8.57, histogram -16.36) with a bearish crossover dated October 6. The price has pierced all three moving averages (SMA20 $2,683, SMA50 $2,687.80, SMA200 $2,596.10), mechanically fueling trend-following strategies.
The algorithmic detection of a 4H double top (neckline $2,677, target $2,622.10) overlaps with the triangle and confirms the bearish target. Conversely, an unconfirmed bullish triple bottom (neckline $2,779, target $2,912) remains hypothetical, invalidated until $2,725 is reclaimed. The 4H SuperTrend has turned bearish at $2,667.90 — the price must breach this level to invalidate the short-term dynamic.
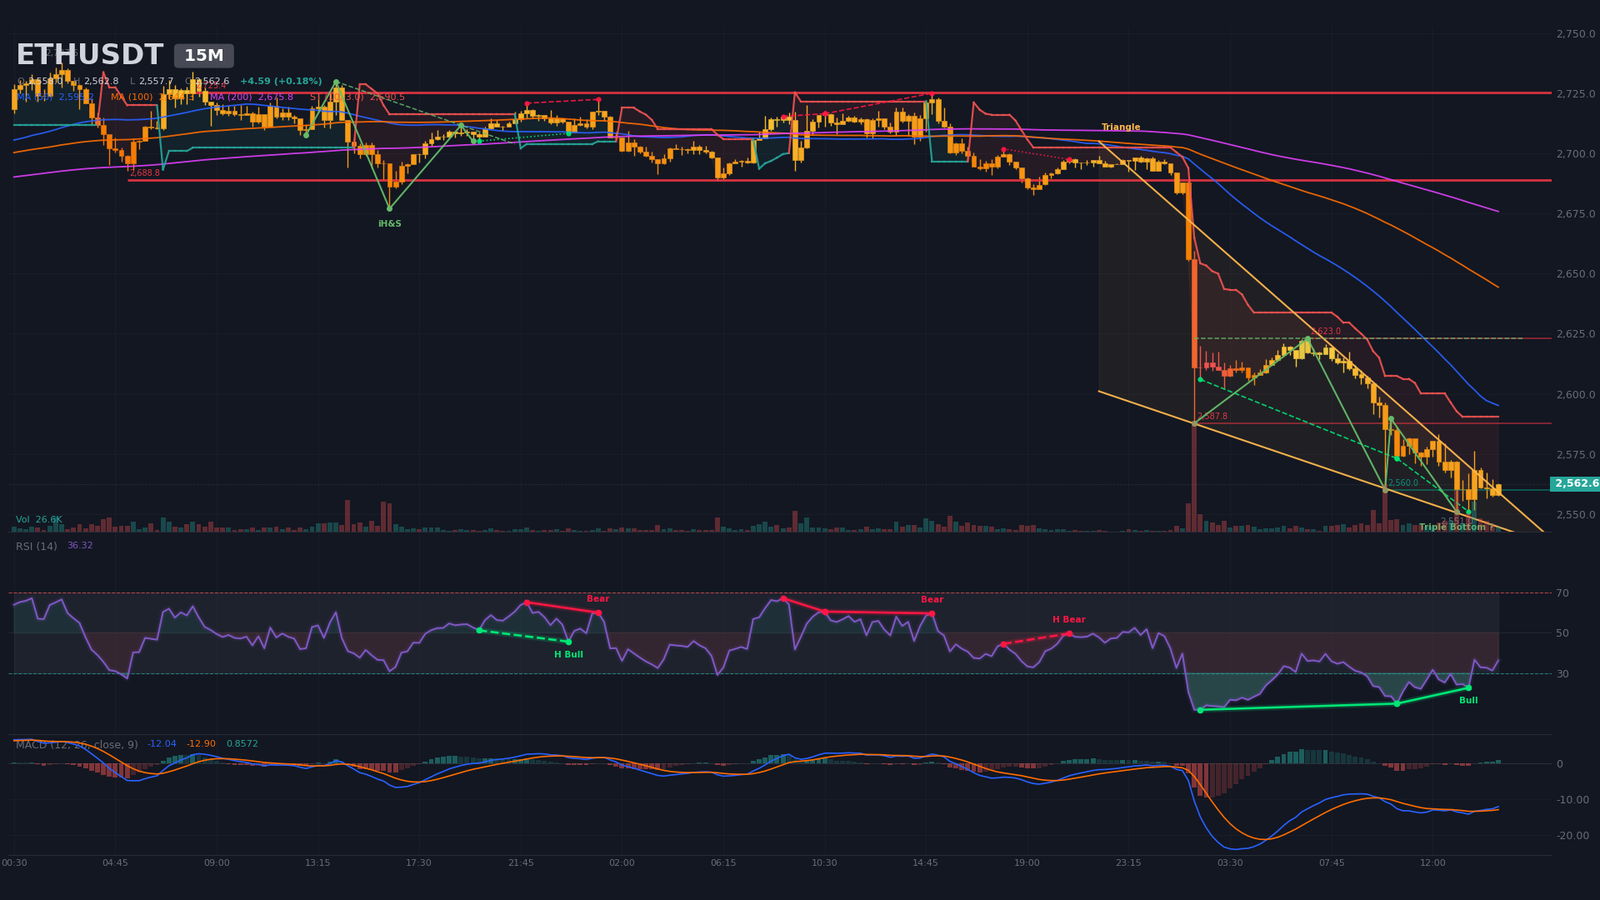
Intraday Structure (15m): Falling Wedge and Divergences
On the 15-minute, the structure is a descending wedge bounded by $2,574.30 on the top and $2,550.50 on the bottom, with an apex projected at 17:27 today. The current candle (14:45) sits in the terminal portion of this wedge, with the price at $2,562.60. The 14-period RSI at 36.32 has exited extreme oversold, and the MACD validated a bullish crossover at 13:45 (histogram turned positive at +0.86) — the first buyer momentum signal since the drop. Two closely spaced regular bullish divergences (10:30 → 13:30 and 02:15 → 10:30) on the successive lows at $2,573 and $2,551 confirm seller exhaustion. The detected bullish triple bottom (unconfirmed, neckline $2,623, target $2,679.70) and the confirmed inverse head-and-shoulders of October 5 (neckline $2,711.70, target $2,755.10) point to a technical target near $2,680. M15 quantified bounds: $2,551 – $2,574 for the wedge, resistance $2,588 – $2,623, support $2,551 – $2,560.
Multi-Timeframe Synthesis
| Timeframe | Dominant trend | RSI (14) | MACD | Chart pattern |
|---|---|---|---|---|
| Daily (1D) | Bearish (distribution) | ~44 (neutral) | Bearish crossover 09/28, expanding histogram | Confirmed double top, neckline $2,626 |
| 4 hours (4H) | Bearish (compression) | ~25 (oversold) | Below zero, bearish crossover 10/06 | Symmetrical triangle, apex 10/12 |
| 15 minutes | Neutral bullish (technical bounce) | ~36 (exiting oversold) | Bullish crossover 10/07 13:45, positive histo | Descending wedge in terminal phase |
Mapping of Technical Levels and Pivots
The method combines classic daily pivots (base: last completed candle), extensions from major swing highs/lows (09/21 and 10/02), liquidity concentrations on the order book side (1–4% walls) and estimated liquidation zones. The short-term central pivot sits in the $2,588 – $2,600 zone, articulated around the 4H algorithmic resistance at $2,620.5 and the 4H double top neckline at $2,677.
| Level | Price (USD) | Category | Technical basis |
|---|---|---|---|
| R3 | $2,733 – $2,744 | Major resistance 3 | 4H symmetrical triangle upper bound ($2,733) + 4H algorithmic resistance ($2,743.50, 3 touches) |
| R2 | $2,701 – $2,721 | Major resistance 2 | Classic daily pivot ($2,701.30) + 10/01 04:00 swing high ($2,721.40) |
| R1 | $2,666 – $2,677 | Immediate resistance | 4H double top neckline ($2,677) + 4H P pivot ($2,584.80 extended by 4H SuperTrend $2,667.90) |
| P | $2,588 – $2,600 | Central pivot | 15m algorithmic resistance ($2,587.80) + wedge top ($2,574.30) + compression midpoint |
| S1 | $2,551 – $2,560 | Immediate support | 15m window low ($2,551) + bid wall $2,558.80 ($28.8M) |
| S2 | $2,459 – $2,480 | Major support 2 | Daily double top target ($2,459.10) + daily SuperTrend ($2,475) + 4H algorithmic support ($2,356 extended) |
| S3 | $2,419 – $2,444 | Major support 3 | Main estimated liquidation pocket ($243.4M at $2,433.7, -5.03%) |
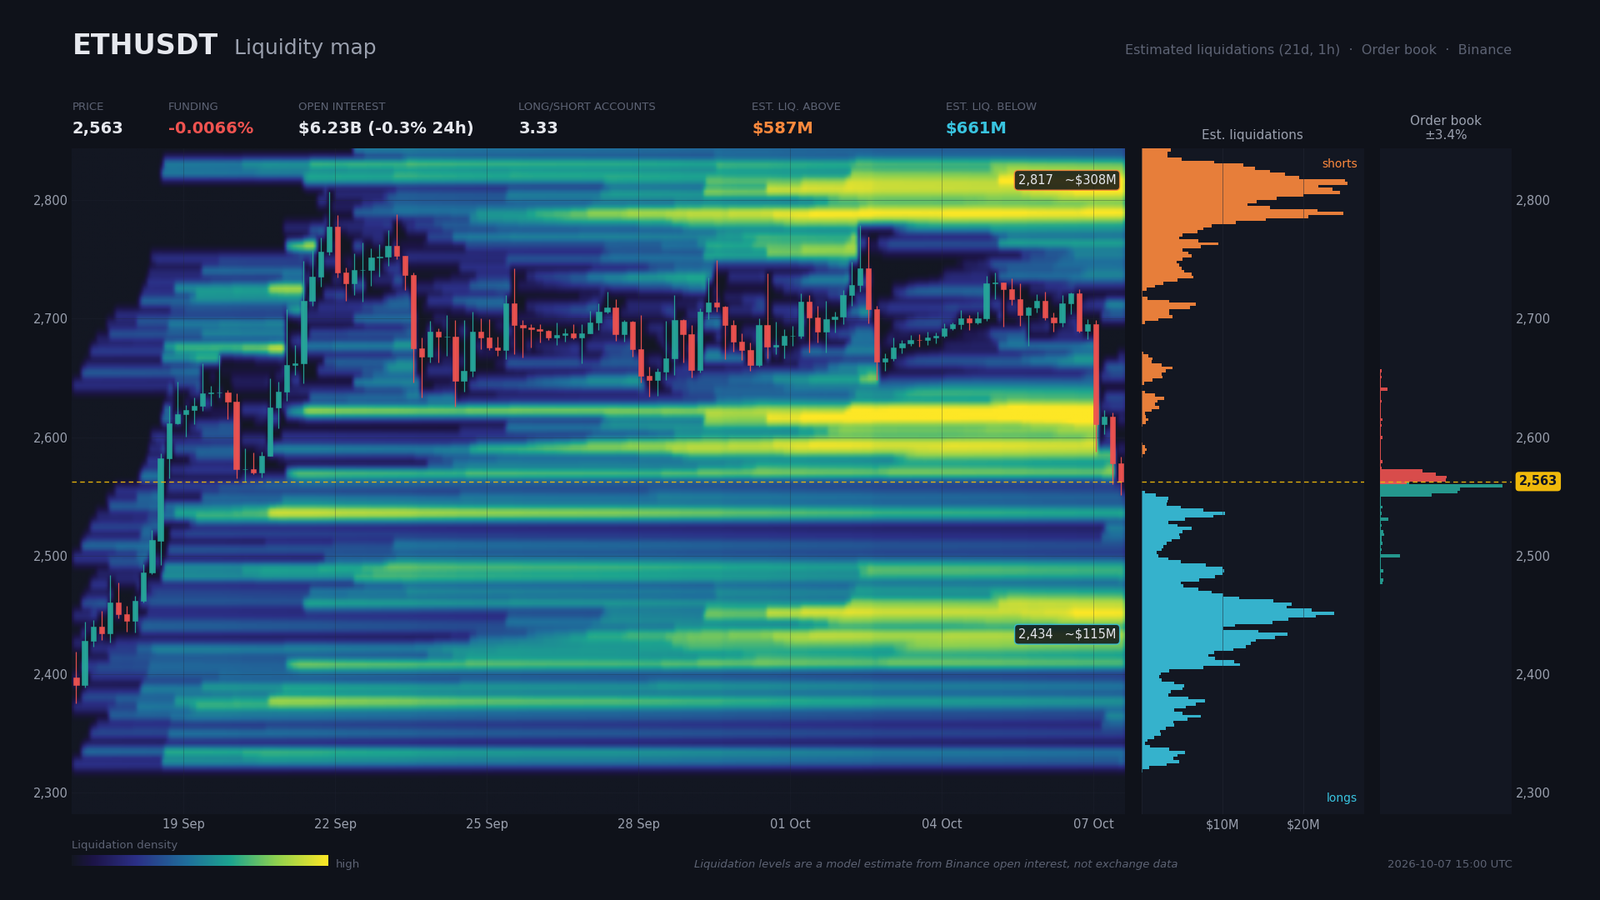
Order Book and Liquidity Heatmap
The aggregated spot + perp order book on Binance is buyer-imbalanced at +18.2% on the ±2% window: $90.9M of bids against $62.9M of asks. Bid walls cluster just below the price: $2,558.80 ($28.8M, -0.15%), $2,556.20 ($18.9M, -0.25%), $2,553.60 ($18.2M, -0.35%) and $2,551.10 ($12.2M, -0.45%). Ask walls are more diffuse and more distant: $2,563.90 ($15.4M), $2,566.40 ($15.6M), $2,569 ($13.1M) and $2,571.50 ($9.9M). Coverage is only 3.41% — beyond that, only the estimated liquidation reading reveals hidden liquidity.
Derivatives show a negative funding rate at -0.0066% (annualized -7.2%): short positions pay longs, a configuration historically compatible with a short squeeze if the price breaks $2,580. Open interest stands at $6.23B, down -0.35% over 24h and -0.52% over 7 days — the market is actively deleveraging, which amplifies cascade risk but limits squeeze size. The global long/short ratio at 3.325 (top traders 1.644) remains heavily skewed toward retail longs; the 24h taker buy/sell at 0.855 confirms a net but moderate selling pressure. Estimated liquidation zones (model estimate, not exchange data) place $586.6M of shorts above the price, mainly clustered in the $2,779.60 – $2,817.90 zone ($308.2M, +9.91%, peak at $2,816.60), and $661.1M of longs below, mainly between $2,419.60 – $2,440 ($114.9M, -5.03%, peak at $2,433.70) and $2,442.60 – $2,455.40 ($113.6M, -4.63%). The asymmetry is slightly bearish: more long dollars to hunt in a breakdown than shorts to squeeze on a bounce, suggesting a price magnet toward $2,434 if $2,551 breaks.
Calendar: Catalysts to Watch
Tonight’s FOMC minutes and the October 14 CPI are the two events capable of pulling Ethereum out of its current compression structure. The macro sequence over the next two weeks hinges on the US inflation read and labor market stress indicators.
- Wed. October 7, 20:00 (Zurich) — FOMC minutes: any hawkish nuance revives selling pressure on risk, a dovish read supports the technical bounce.
- Fri. October 9, 16:00 — UoM Consumer Sentiment prelim.: consensus 47.6 (prior 48.1) — barometer of expected inflation.
- Wed. October 14, 14:30 — CPI m/m: prior 0.4% — main catalyst of the fortnight, likely to unlock the daily compression.
- Wed. October 14, 03:30 – 05:00 — Chinese inflation, trade balance, exports/imports YoY: Asian demand proxy.
- Thu. October 15, 14:30 — Jobless claims: precision read on the labor market after the disappointing October 2 NFP.
Three Scenarios for the Coming Weeks
The current compression resolves over a five-to-ten-session horizon, with a macro catalyst (FOMC minutes, US CPI) likely to arbitrate between the three paths below. Probabilities are calibrated to the technical structure and the ETF flow bias, and total 100%.
Scenario A — Technical Bounce Then Bearish Resumption (probability 55%)
Catalyst: tonight’s FOMC minutes at 20:00 read as neutral or dovish. Trigger: reclaim of $2,588 then $2,600. Path: $2,600 (daily R1) → $2,667 (4H double top neckline / 4H SuperTrend) → $2,720 (daily R2). Invalidation: 4H close above $2,733 (triangle upper bound). Execution zone: $2,551 – $2,575 (bounce off bid walls and 15M wedge lower bound). Stop: below $2,521 (1×4H ATR ≈ $32). R:R ≈ 2.3 toward $2,667.
Scenario B — Liquidity Sweep Toward $2,434 (probability 30%)
Catalyst: US CPI on 10/14 or hawkish FOMC minutes. Trigger: break of $2,551 on 4H closes. Path: $2,531 (algorithmic support) → $2,480 (daily SuperTrend) → $2,434 (estimated liquidation pocket, $114.9M). Invalidation: reclaim of $2,580 within 24h. Execution zone: $2,480 – $2,500 on retest of daily SuperTrend. Stop: above $2,600 (1×daily ATR ≈ $86). R:R ≈ 1.8 toward $2,434.
Scenario C — Bullish Recovery Toward $2,755 (probability 15%)
Catalyst: dovish FOMC minutes + lower-than-expected CPI on 10/14. Trigger: daily close above $2,733 (triangle bound). Path: $2,733 → $2,755 (15M inverse H&S target) → $2,912 (4H triple bottom target). Invalidation: return below $2,667 on 4H close. Execution zone: breakout above $2,733 with pullback. Stop: below $2,645 (1×4H ATR). R:R ≈ 2.5.
Synthesis and Conclusion
ETHUSDT is purging a post-ETF excess phase within a mature bearish structure: confirmed daily double top, 4H triangle in terminal phase, 15M wedge suggesting a very short-term technical bounce. The flow context ($408M of ETF outflows over 6 sessions, $550M of crypto liquidations) and the steepening of the US curve (10-year at 5.35%) support the main scenario of a compression resolving to the downside, but the daily hidden bullish divergence of September 2-15 and the bullish daily SuperTrend preserve the risk of a daily reversal as long as $2,475 holds.
The dominant strategy is to sell bounces toward $2,666 – $2,677 with invalidation above $2,733 on 4H close, and to monitor a sweep below $2,551 as a catalyst for scenario B. Protection level: $2,733 on 4H close to invalidate any tactical short exposure.
Sources
- Bitcoin ETFs Gain $119M Despite Bitcoin Price Drop — Cointelegraph, 07/10/2026
- BitMine sets 5% Ether supply ‘hard cap’ as accumulation target nears — Cointelegraph, 07/10/2026
- Russia clears first crypto exchanges, custodians under new law — Cointelegraph, 07/10/2026
- One of the worst parts of the stock market this year is looking like a bargain — CNBC, 07/10/2026
- Stocks made a record high. Two big bearish trades point to skepticism — CNBC, 07/10/2026
- Crypto liquidations hit $550M as Bitcoin price dips below $84K — Cointelegraph, 07/10/2026
- Bitcoin briefly slides below $84,000 as crypto long liquidations reach $487 million — The Block, 07/10/2026
- Pudgy Penguins-backed Ethereum L2 Abstract to shut down after losing ‘tens of millions’ — The Block, 06/10/2026
- Pudgy Penguins’ Ethereum Layer-2 Abstract Is Shutting Down — Decrypt, 06/10/2026
- Moody’s gives Sky Protocol B3 rating as institutional interest in USDS grows — The Block, 07/10/2026
- Ethereum ETFs Outpace Bitcoin ETFs in 2026 Inflows — 24/7 Wall Street, 04/10/2026
- Ethereum ETFs Snap 7-Day Inflow Streak as Bitcoin Funds Keep Buying — BeInCrypto, 30/09/2026
- SEC maps out crypto custody in new proposal that furthers its digital assets agenda — CoinDesk, 01/10/2026
- SEC Targets Crypto Custody Rules in Major Regulatory Shift — Investing.com, 02/10/2026
- Jito’s JTX plans mobile app this fall, eyes perps integration later this winter — The Block, 07/10/2026
Disclaimer: This article is for educational and informational purposes only. It does not constitute investment advice, a recommendation to buy or sell, or an invitation to trade any financial asset. Cryptocurrency markets are extremely volatile; any investment decision should be based on your own research (DYOR) and, where appropriate, the advice of a licensed financial adviser.

