


At the end of July 2026, Bitcoin (BTC) sits at a critical crossroads. On one hand, on-chain indicators point to a “deep value” zone favorable for long-term accumulation. On the other, short-term technical structure is struggling to break through major algorithmic resistance amid a parched global liquidity backdrop. Trading between $63,000 and $65,700, the market is compressed like a spring, and every key level is being defended with remarkable intensity.
This analysis combines multi-timeframe chart reading (daily, 4-hour, 15-minute), liquidation heatmaps, derivatives flows, and on-chain metrics to assess directional probabilities for the coming weeks.
The Federal Reserve and geopolitical headwinds
The Federal Reserve’s decision announced on July 29, 2026 was the central catalyst behind recent price action. The Fed held its benchmark rate unchanged in a 3.50%–3.75% range for the fifth consecutive meeting. While largely priced in by markets, the tone and the vote split were perceived as decisively hawkish.
Three of the twelve policymakers dissented in favor of an immediate 25 basis-point hike, sending shockwaves through bond markets: the 10-year US Treasury yield pushed above 4.50%, mechanically reinforcing the dollar (DXY above 100). The Fed Chair reaffirmed an unwavering commitment to bringing inflation back to the 2% target, pushing back expectations of monetary easing. This rigidity is compounded by massive AI-related infrastructure spending, which continues to underpin strong structural demand for energy and semiconductors.
Geopolitically, renewed US military strikes on Iran, in retaliation for attacks on American bases in Jordan, pushed crude oil (WTI) toward $90 a barrel. This dynamic further constrains the Fed’s room to maneuver and reaffirms the inverse correlation between dollar strength and Bitcoin, as elevated real rates compress speculative risk premiums. Despite this challenging backdrop, underlying adoption keeps progressing: according to WazirX, crypto deposits outpaced withdrawals by 2x to 6x in H1 2026, with millennials dominating the user base (50.8%) and stablecoins representing a growing 38.5% of transaction volume.
Market microstructure: order books and liquidation heatmaps
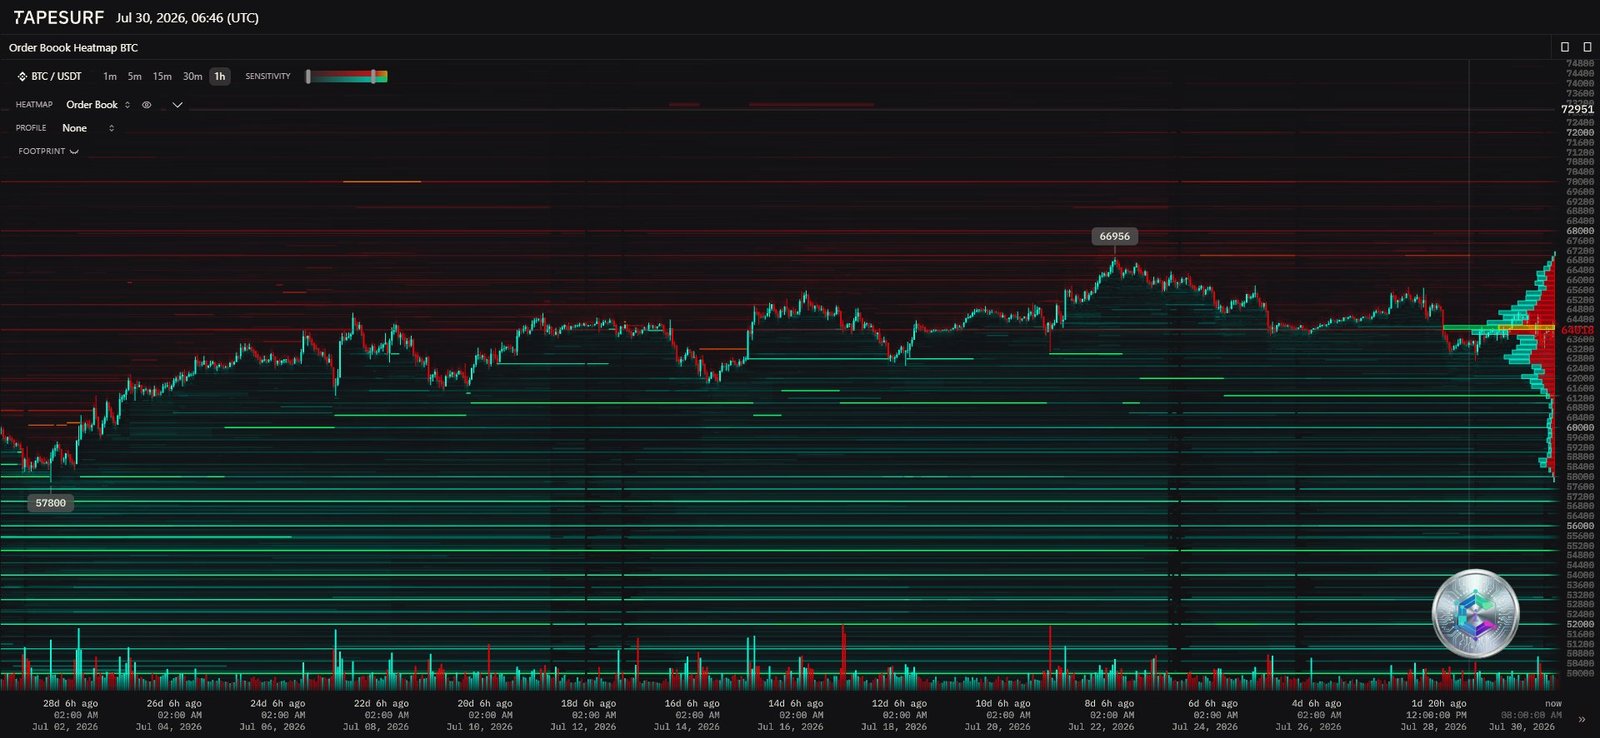
Examining market microstructure — order book depth and liquidation heatmaps — offers an X-ray view of current friction zones. The market recently underwent massive liquidity sweeps, with over $1.1 billion in liquidations across the crypto space during an abrupt drop toward $64,100. This purge violently flushed out over-leveraged long positions, restoring a fragile balance.
Coinglass liquidation heatmaps reveal a notable directional asymmetry: a massive concentration of leveraged short positions has built up in the $70,000–$72,000 band. In the derivatives ecosystem, these liquidity clusters act as magnets for price, incentivizing market makers to push prices toward these levels to trigger short-squeeze cascades.
The path toward those highs, however, remains blocked by colossal liquidity barriers. Binance order book analysis reveals a massive institutional $43 million “sell wall” positioned precisely at $65,000, explaining the repeated rejections observed every time price attempts to break through this ceiling. On the demand side, liquidity pockets sit below $63,000 and, more deeply, near $59,600, marking the next algorithmic support levels in the event of capitulation.
Derivatives markets: CME futures, options, and Gamma exposure
Bitcoin futures listed on the Chicago Mercantile Exchange (CME) show several unfilled price gaps — anomalies with a historical fill rate above 90%. A bearish gap formed in the $59,500 zone, creating downward gravitational pull, while a larger and older gap remains open around $73,000, serving as a long-term technical target for bullish expansion scenarios.
A Purdue University study published in May 2026 identified a major structural anomaly: the annualized carry cost of CME Bitcoin futures exceeds that reconstructed from IBIT ETF options by 2.581 percentage points, a premium of roughly $25.8 million per year for a billion-dollar position. This persistent inefficiency, difficult for arbitrageurs to close due to strict margin constraints imposed by clearinghouses, confirms strong and cost-inelastic institutional demand for pure directional exposure via CME.
On the options side, the implied volatility index (DVOL) underwent a sudden crush, falling from 40% to 35.93%. These historically low levels suggest an extreme compression phase ahead of a violent directional move. Market makers’ Gamma exposure (GEX), currently deeply negative around $64,000, mathematically forces them to sell as price falls and buy as it rises, amplifying local volatility. The “Max Pain” point for the late-July expiries sits precisely around $64,000. Structurally, a $5 billion open-interest cluster is concentrated on $70,000–$72,000 calls on Deribit, reflecting strong institutional conviction in a bullish breakout by year-end.
On-chain analysis: the foundations of a cyclical bottom
Glassnode on-chain data indicate the market is going through one of the most prolonged “deep value” phases in Bitcoin’s history. For five months, spot price has traded below two critical structural thresholds: the True Market Mean (around $76,600), the average acquisition price of active investors, and the Short-Term Holder Cost Basis (around $72,200), the break-even level for recent buyers.
Over 95% of short-term holders are therefore sitting on unrealized losses, a setup that creates constant overhead supply between $66,800 and $68,000, as every rally is seen as a break-even exit opportunity. Should the market repeatedly fail to reclaim the True Market Mean, the aggregate Realized Price (around $53,000) would act as the network’s ultimate support.
Long-term holders (LTH) have recently accelerated distribution, with realized losses reaching $280 million per day — the highest level since December 2022. This capitulation reflects psychological exhaustion, though late-July reports show this distribution pace easing, with early signs of net accumulation returning among wallets holding 100 to 1,000 BTC. On the institutional side, US spot Bitcoin ETFs recorded massive outflows (nearly 71,000 BTC in Q2), and Strategy Inc’s “STRC” preferred shares suffered a severe discount. The MVRV Z-Score, ranging between 0.41 and 1.32 depending on methodology, remains at levels characteristic of deep undervaluation, far from the readings above 7 that signal late-cycle euphoria.
Multi-timeframe technical analysis
Daily timeframe: consolidation and Death Cross threat
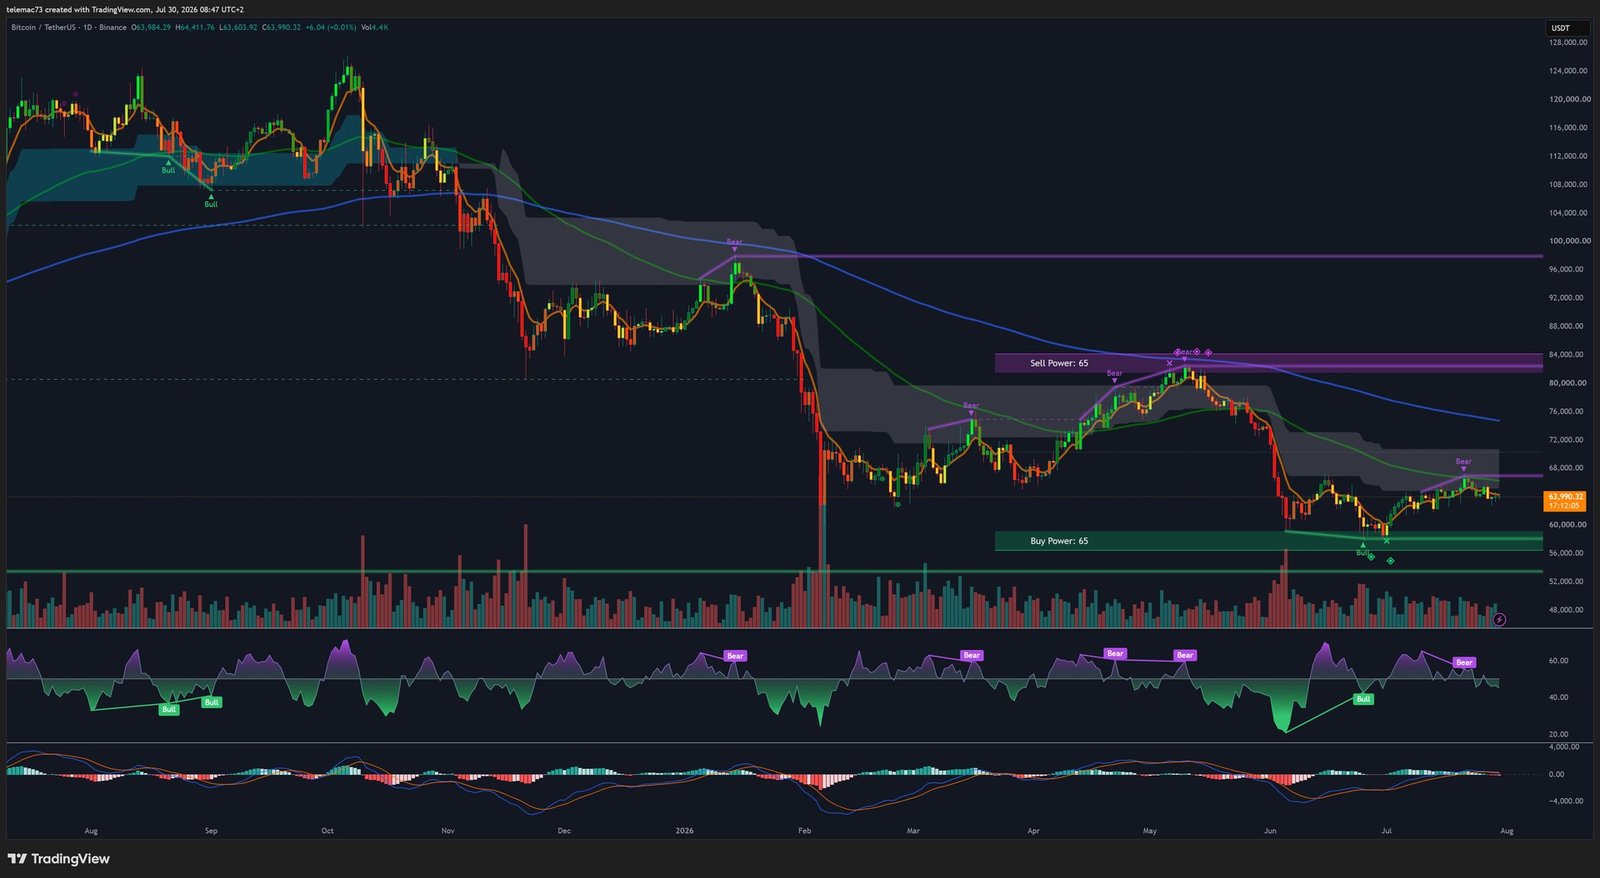
On the daily chart, Bitcoin remains stuck in a broad consolidation structure, interpreted either as an inverse head-and-shoulders pattern or as a falling wedge / large compression triangle. Technical aggregators are flashing an overall “Strong Sell” signal, largely due to deteriorating moving averages.
| Period | SMA | EMA | Signal |
|---|---|---|---|
| MA 5 | $63,803 | $63,874 | Sell / Neutral |
| MA 10 | $63,901 | $63,953 | Sell / Neutral |
| MA 20 | $64,074 | $63,973 | Sell |
| MA 50 | $63,819 | $64,019 | Sell |
| MA 100 | $64,183 | $64,262 | Strong Sell |
| MA 200 | $64,745 | $64,372 | Strong Sell |
The tight proximity between the MA50 (around $63,834) and the MA200 (around $64,745) raises the specter of a “Death Cross,” a traditionally anxiety-inducing signal. The 14-day RSI reads neutral, between 46.26 and 52.98, while the MACD oscillates without clear direction around the zero line, confirming an absence of trend. The ATR signals a sharp volatility contraction, typical of a compression phase ahead of a directional move.
4-hour timeframe: bull flag and seller exhaustion
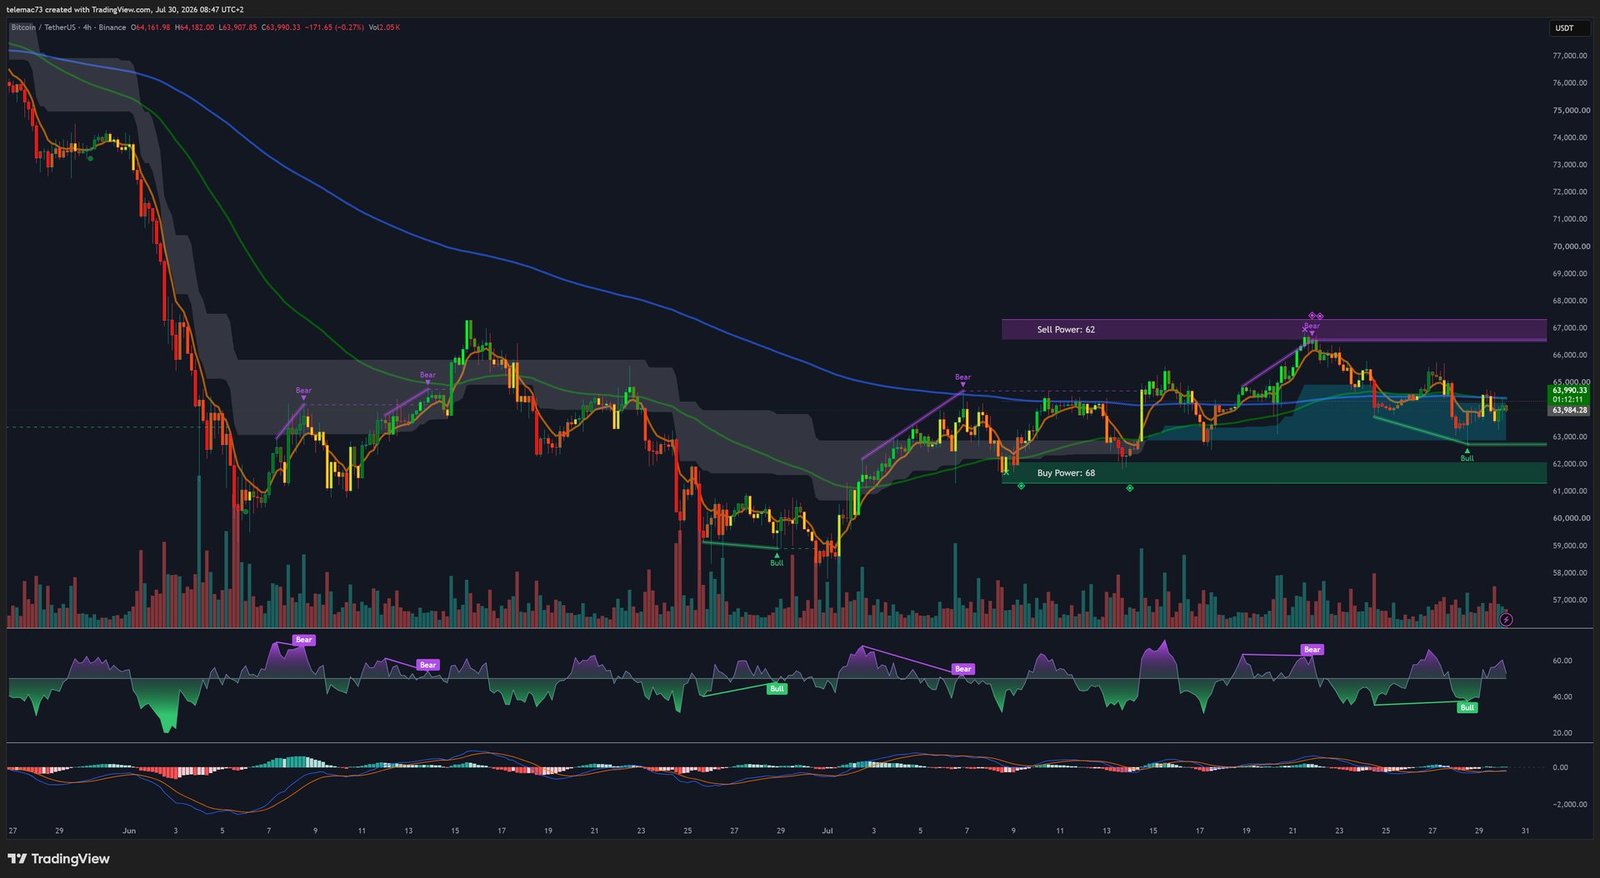
On the 4-hour chart, the structure is far more dynamic. After printing a low below $62,000 during the recent leverage flush, BTC has carved out a series of higher lows, forming a bull flag just below the pivotal $64,700 resistance. The MA9 crossed above the MA21, validating a short-term bullish bias, though the Parabolic SAR briefly flipped above price during the rejection at $65,700. During liquidity sweeps, the H4 RSI plunged to an oversold extreme of 28, signaling severe local seller exhaustion; price then bounced off the lower Bollinger Band. Holding support near $64,150 remains vital for bulls; a confirmed break above the flag’s upper boundary would open the path toward $67,000.
15-minute timeframe: liquidity hunts and bull traps
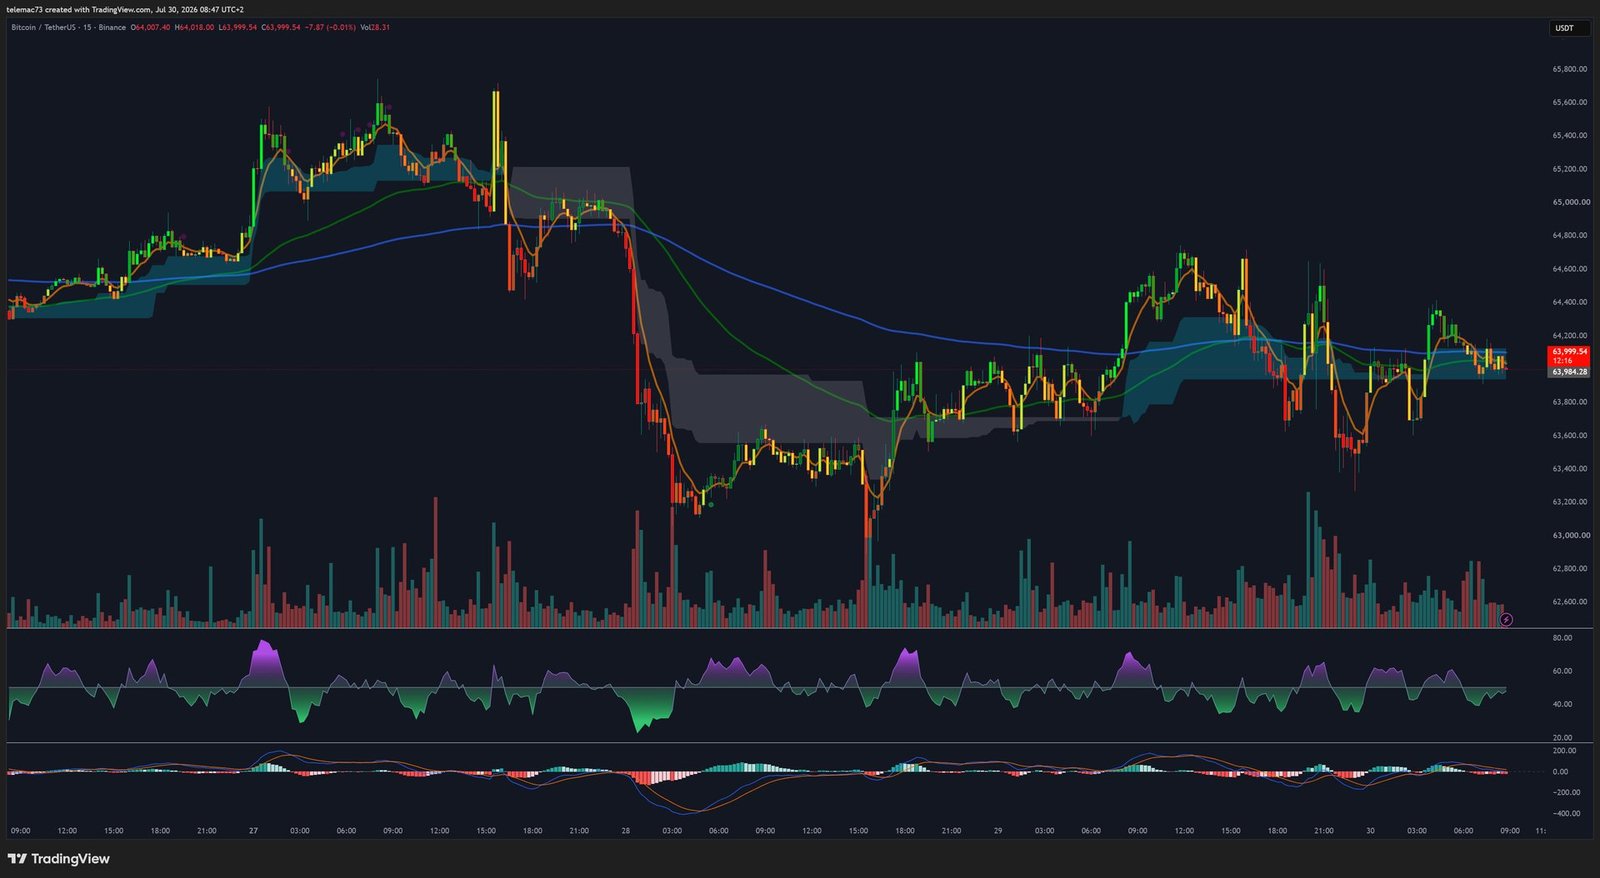
On very short timeframes, price action is the playground of high-frequency algorithms executing targeted liquidity sweeps. The most notable event of recent sessions was a sharp impulsive spike propelling price to $65,700 (a one-month high), followed by a brutal rejection that instantly pulled price back to $63,900 — a classic “bull trap” caused by a head-on collision with the $43 million sell wall. The cyclical RSI had fired three consecutive overbought signals ahead of this correction, predictively signaling the reversal. Price subsequently stabilized around its VWAP, measured at $65,450.
Pivot point matrix and key strategic levels
Pivot points calculated for the late-July 2026 daily close converge remarkably around the $63,965 zone, indicating this level currently acts as the short-term equilibrium point.
| Methodology | S3 | S2 | S1 | Pivot |
|---|---|---|---|---|
| Classic | $63,725 | $63,804 | $63,965 | $64,125 |
| Fibonacci | $63,804 | $63,865 | $63,965 | $64,064 |
| Camarilla | $63,923 | $63,938 | $63,965 | $63,997 |
| Woodie’s | $63,726 | $63,804 | $63,965 | $64,126 |
- Major resistance zone ($66,800): upper boundary of the daily compression triangle; a confirmed breakout would open the path to a short squeeze toward the $70,000 options cluster.
- Immediate resistance zone ($64,700): current ceiling combining the MA200, negative Gamma exposure, and the spot sell wall.
- Immediate support zone ($62,500): defensive floor of the H4 bullish structure; losing it would trigger a cascade of stop-losses.
- Macro support zone ($59,500): structural support of last resort, matching the lower CME gap and institutional panic-buying zones.
Synthesis and directional scenarios
The combination of macroeconomic, on-chain, derivatives, and technical data outlines two probabilistic scenarios for the coming weeks.
Scenario 1 — Bullish breakout via compression release (moderate-to-high probability)
An easing of geopolitical tensions combined with US inflation stabilization would allow bond yields to plateau and reignite inflows into US spot ETFs. Price would then absorb the $65,000 wall; a daily close above the MA200 would neutralize the Death Cross threat and trigger trend-following algorithms. Short sellers trapped below $66,800 would get liquidated, market makers’ Gamma exposure would flip, and the market would be magnetically pulled toward the $70,000–$72,000 options cluster.
Scenario 2 — Prolonged rejection and final flush (moderate probability)
Short-term holders, trapped below their $72,200 cost basis, would use every rally toward $66,000 to sell, creating an inexhaustible supply. Repeated failure to break the $64,700 resistance would exhaust spot demand, formally validating the Death Cross and generating a massive sell signal. The critical $62,500 support would give way, triggering a drop toward the bearish CME gap at $60,000, or even an incursion toward the Realized Price around $53,000–$54,000 should LTH capitulation accelerate again.
The Bitcoin ecosystem is currently compressed like a spring. Fundamentally, network valuation sits at an exceptionally attractive level for patient capital, but the precise timing of any recovery remains hostage to a punitive macroeconomic backdrop and a complex derivatives structure. Watching how price interacts with the $63,965 pivot and the MA200 will determine the asset’s trajectory for the final quarter of the year.
Disclaimer: this article is provided for educational and informational purposes only. It does not constitute investment advice, a recommendation to buy or sell, or a solicitation to trade digital assets. Cryptocurrency markets are highly volatile and carry significant risk of capital loss. Do your own research and consult a qualified financial advisor before making any investment decision.

