


After climbing nearly 25% over the course of August 2026, Bitcoin enters the first week of September in direct contact with a major structural resistance zone. The asset is currently trading in a range between $80,800 and $81,500, just beneath a decisive technical confluence: the 50-week moving average, the distribution peak of the first half of 2026, and the average cost basis of U.S. spot ETF holders, sitting around $82,500.
The medium-term structure remains bullish, supported by the reclaim of the major daily moving averages and the successful breakout from a bullish flag pattern on the 4-hour chart. However, the daily RSI is showing pronounced overbought conditions, and the order book reveals a leverage imbalance that leaves the market vulnerable to any break below key polarity levels. Here is a full breakdown of the levels, the technical structure, and the scenarios to watch for the rest of the month.
Key levels to watch
| Level | Price (USDT) | Technical characterization | Strategic role |
|---|---|---|---|
| Major resistance 3 | $91,719 | 2026 yearly highs, parabolic extension threshold | Macro expansion target |
| Major resistance 2 | $85,000 | Psychological level, 81% Polymarket consensus | Post-breakout acceleration target |
| Major resistance 1 | $81,000 | 50-week MA confluence and spot ETF cost basis | Quarterly directional pivot |
| Intraday pivot | $80,800 | Equilibrium point of the 15-minute compression | Maintains immediate momentum |
| Major support 1 | $77,000 | Polarity flip zone, flag breakout point | Bullish momentum invalidation threshold |
| Major support 2 | $75,000 | Arbitrage level, 72% Polymarket pullback odds | Institutional absorption zone |
| Structural support | $68,500 | Short-term holder (STH) cost basis | Overall profitability frontier |
| Macro floor | $57,800 | Summer capitulation low, 200-week MA | Structural support of last resort |
Multi-timeframe technical breakdown
Daily chart (1D): moving-average confluence and RSI overheating
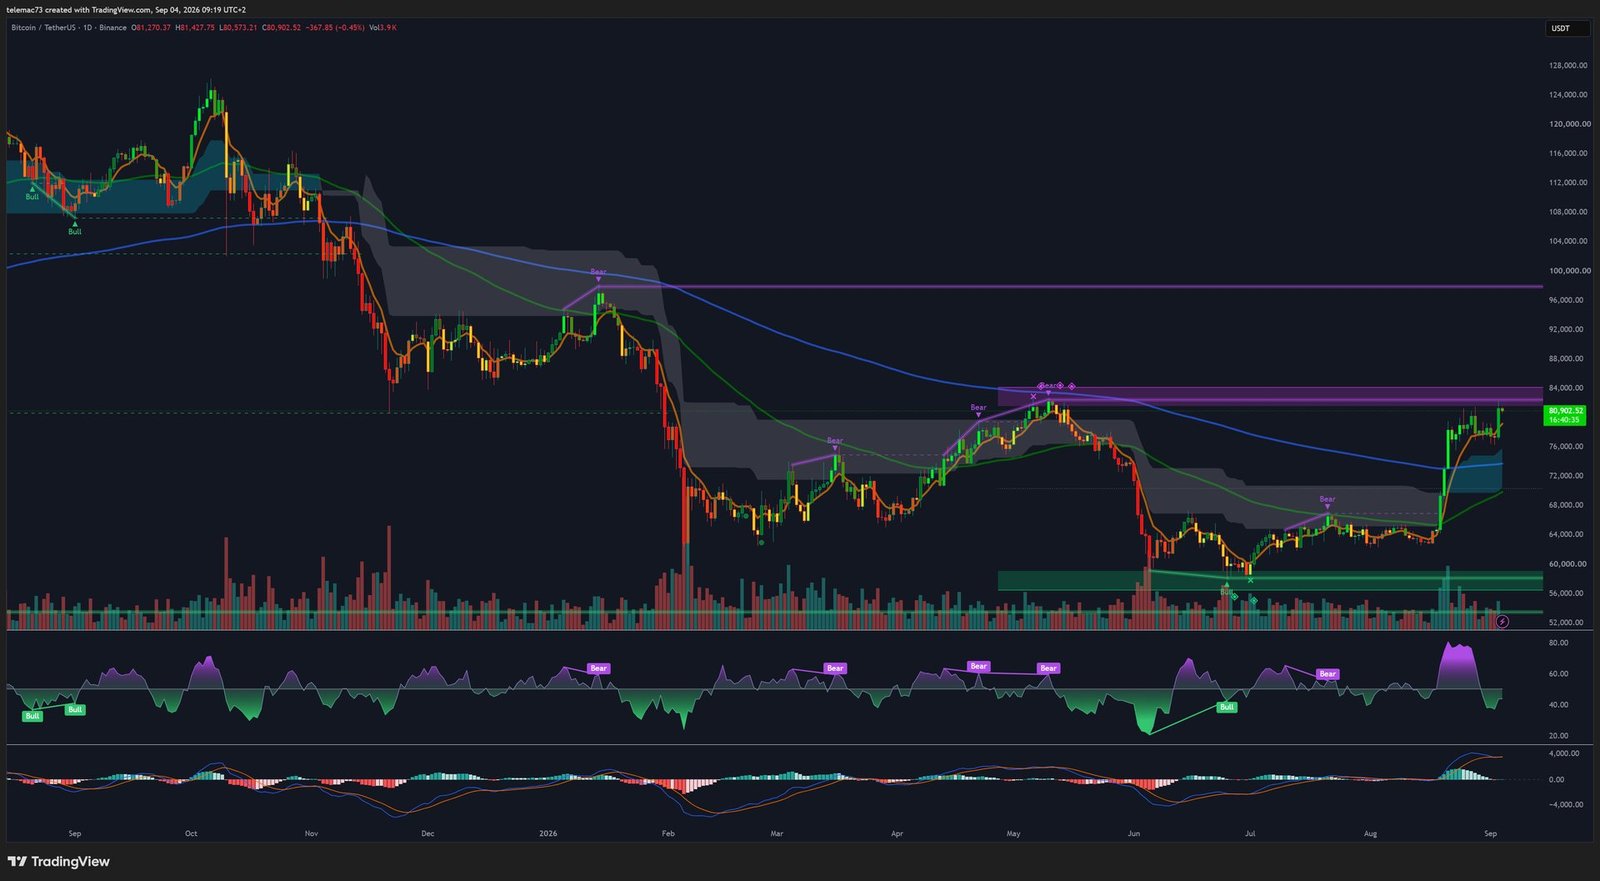
The daily chart confirms a clear improvement in the underlying directional structure. Bitcoin left its summer accumulation phase, between $57,800 and $64,000, through a high-volatility impulsive move that pushed prices roughly 20% above the 50-day simple moving average and 46% above the 200-day moving average. This widening gap confirms an expanding trend regime, reflected in a Golden Cross on the daily trend-following indicators.
This push brings price into contact with the 50-week moving average, around $81,000, which coincides with the distribution peak of Q1 2026. A confirmed weekly close above this ceiling would be the necessary condition to distinguish a durable macro recovery from a simple technical bounce. The oscillators, however, are sending mixed signals: the 14-period RSI climbed into the 80–82 zone in early September, its highest reading of the year — a sign of strong buying pressure, but one that historically limits the potential for a straight-line advance. The MACD, by contrast, confirms the strength of the underlying flow through a continued expansion of its positive histogram.
4-hour chart: bullish flag validation and compression
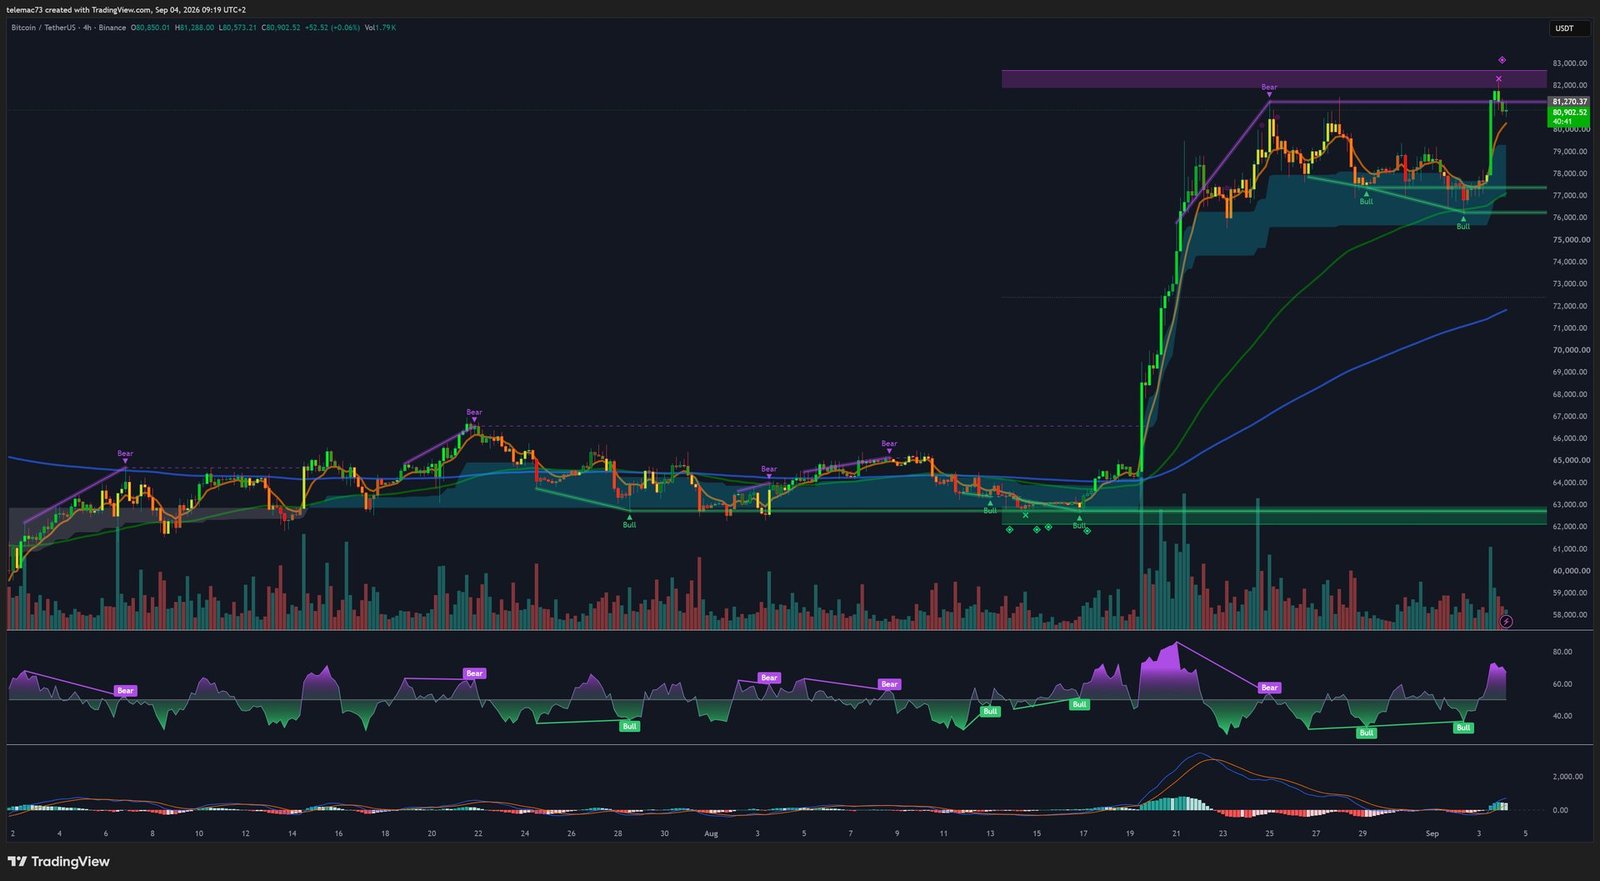
The 4-hour timeframe illustrates the transition between the vertical impulse of late August and the current positioning beneath resistance. After the initial acceleration off the $64,000 level, price consolidated between $77,000 and $81,000 within a steady descending channel on declining volume, forming a textbook bullish flag. Its resolution came via an impulsive breakout accompanied by a volume pickup, propelling Bitcoin to a high wick of $81,500.
The fast exponential moving averages (EMA 9 and EMA 21) now act as dynamic support, having held price during the last technical pullback toward $77,300. The 4H RSI currently oscillates between 68 and 74, with a slight flattening on recent highs even as price printed a marginally higher high at $81,500 — a mild bearish absorption divergence worth watching. On the MACD, the bullish crossover triggered by the flag breakout remains active, though the histogram shows early signs of decelerating as price approaches the $82,000 liquidity zone.
15-minute chart: intraday microstructure and supply absorption
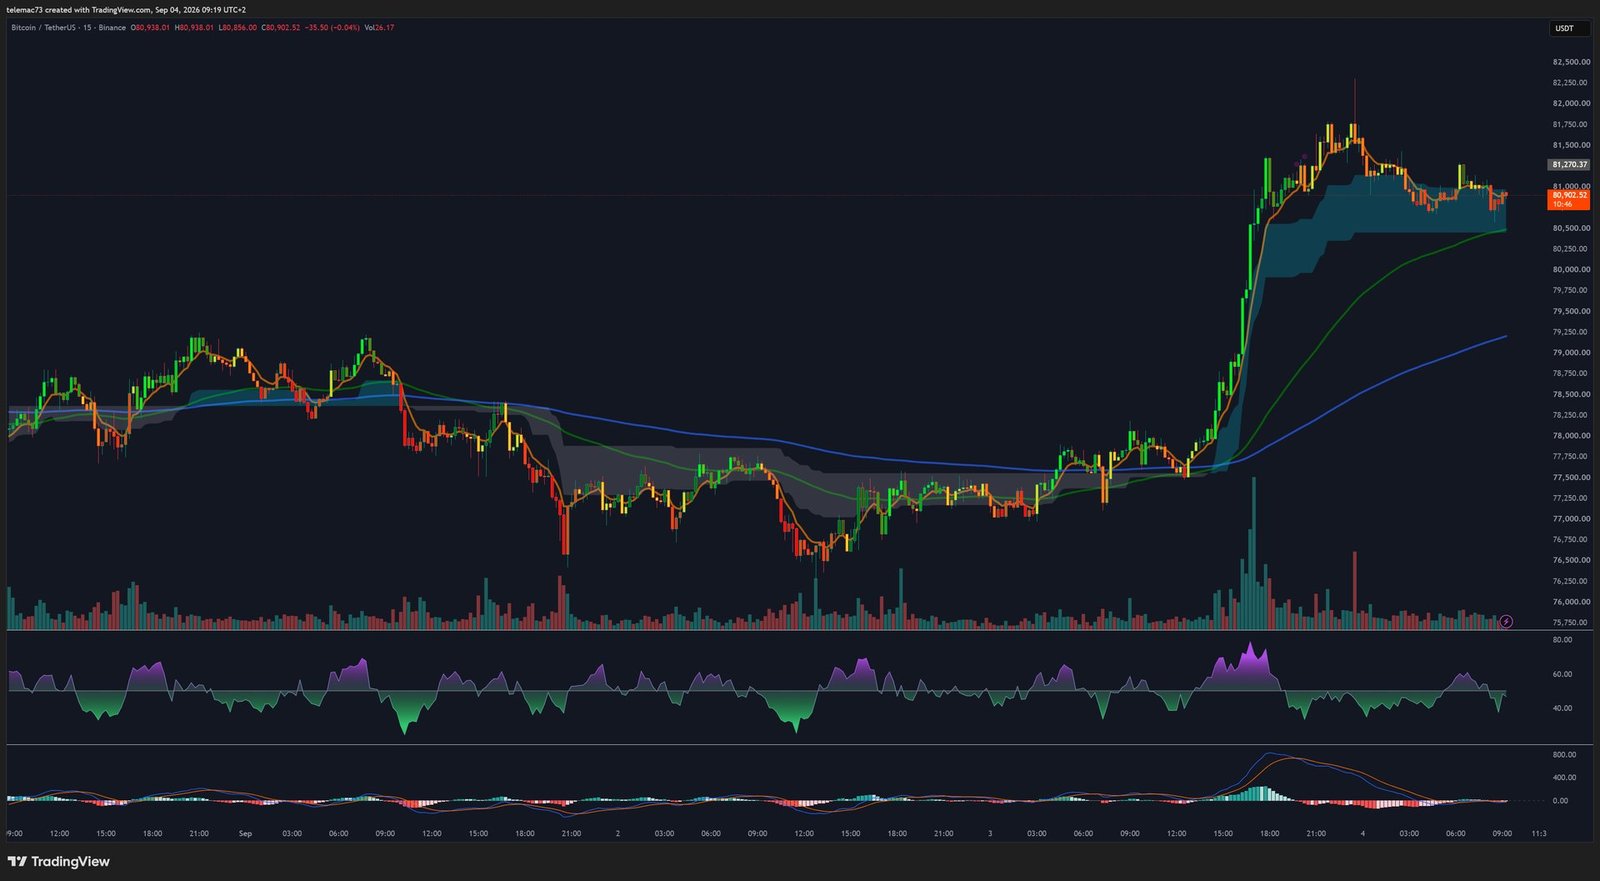
The high-frequency view depicts an orderly stabilization phase within a tight horizontal corridor bounded by $80,800 and $81,500. After testing $81,500, the market did not experience an abrupt liquidation but rather a constructive drift, forming a local compression triangle.
The 15-minute RSI, which had peaked above 85 during the bullish acceleration, has fully reset to a neutral zone between 50 and 55 — a sign of ongoing passive absorption of profit-taking by institutional buyers positioned on limit orders. On the intraday MACD, a bearish crossover has pulled the lines back toward zero, though the histogram is already starting to flatten, underscoring the exhaustion of immediate selling pressure. The $80,800 intraday pivot remains the reference level: holding it maintains pressure against the top of the compression range, while a breakdown would open the door to a short-term correction toward $79,800.
Order-book depth and liquidation risk
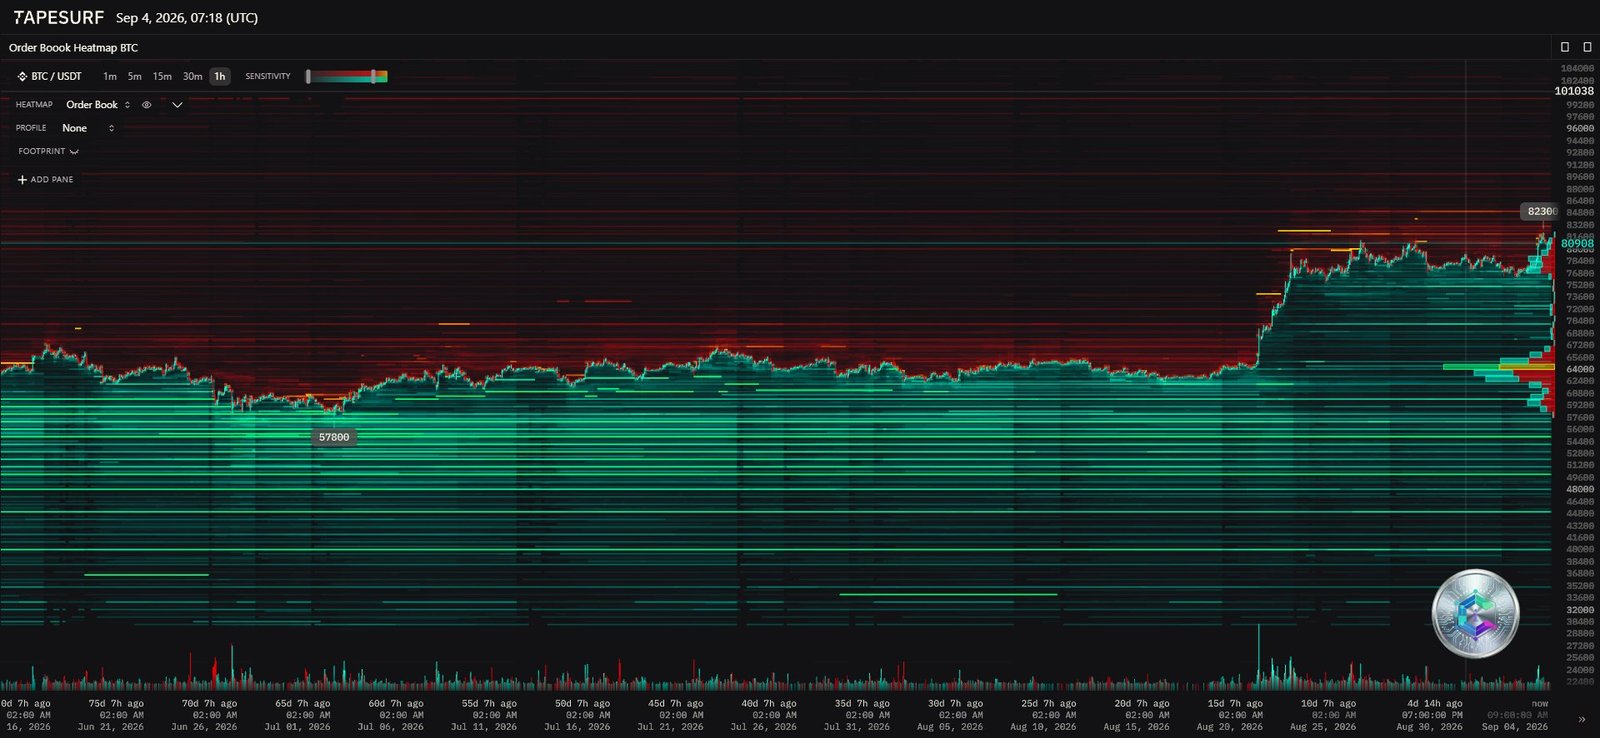
Order-book depth data combined with the liquidity heatmap provide valuable clarity on passive order structure and leveraged position balance.
| Price zone (USDT) | Order density and type | Associated structural factors |
|---|---|---|
| $85,000 | Major sell-side limit order clusters (asks) | Macro profit-taking and psychological thresholds |
| $82,000 | Dense sell-side liquidity wall | 50-week MA confluence and $82,500 spot ETF cost basis |
| $80,800 | Current trading zone | Spot buy-volume absorption against passive orders |
| $77,000 | Dense buy-side limit order wall (bids) | Old flag top and polarity support |
| $64,000 | Secondary passive accumulation shelf | Liquidity re-injection zone, 200-week MA anchor |
| $57,800 | Historical liquidity foundation line | Summer 2026 capitulation floor |
The heatmap highlights a massive sell-side liquidity wall between $82,000 and $83,000. This concentration of passive supply reflects two converging factors: on one hand, the $82,500 threshold represents the average break-even level for the entire base of U.S. spot ETF subscribers, who may see it as an opportunity to unwind positions at no loss after months of underperformance; on the other, this barrier coincides with the top of the weekly descending channel. Beyond $83,000, sell-side depth thins out temporarily before densifying again in steps, at $85,000 and then up toward $101,000. Conversely, buy-side liquidity has solidified between $77,000 and $78,000, forming the buyers’ main line of defense — the old summer resistance now flipped into support.
Positioning in derivatives markets shows a substantial asymmetric fragility. Top-tier traders display a strongly bullish bias, with 111 points more long exposure than average. On Binance alone, $3.0 billion in long positions are exposed to liquidation on a downturn, versus $1.80 billion in short positions above current prices — a liquidation-asymmetry ratio of 1.67. In other words, the acceleration potential of a long-liquidation cascade exceeds by more than 60% the available fuel for a short squeeze. Any weakness dragging prices below the $77,000 band could therefore trigger a sharp drop driven by forced liquidations.
Macro backdrop and institutional flows
| Factor | Data point | Effect on market structure |
|---|---|---|
| Fed policy | Waller favors holding rates; hike odds cut to 50% | Falling bond yields, renewed risk appetite |
| ADP employment report | 38,000 jobs added vs. 47,000 expected | Economic cooling confirming the end of the tightening cycle |
| US spot ETF net flows | +$3.52B in August 2026; +$101.1M in recent sessions | Spot buying pressure offsetting summer distribution |
| Perpetual funding rate | ~10% annualized across major venues | No speculative euphoria, healthy spot-driven advance |
| Polymarket derivatives | 81% odds for $85,000; 32% for $100,000 | Anticipation of a range extension without a cycle break |
U.S. monetary policy has eased following comments from Federal Reserve Governor Christopher Waller, who publicly backed holding rates steady. Expectations for a September rate hike dropped from 70% to roughly 50%, a view reinforced by the ADP employment report, which showed just 38,000 private-sector jobs added in August — the softest monthly gain since January. This macro cooling has relieved pressure on the U.S. dollar and sovereign yields, a favorable backdrop for crypto asset valuations.
On the institutional side, spot Bitcoin appetite hit summer highs with a net $3.52 billion inflow via U.S. spot ETFs in August. This flow absorbed selling pressure from long-term holders, who turned net buyers again to the tune of 2,044 BTC in late August. Inflows have remained solid into early September, driven notably by BlackRock’s iShares fund. Caution is still warranted, though: across the twelve historical instances where ETFs absorbed more than $3 billion in a single month, Bitcoin closed the following month lower in seven of them. The perpetual derivatives market, meanwhile, points to a healthy balance, with funding at 10% annualized and open interest 23% below its cyclical record — evidence that the current move is driven by real spot buying rather than synthetic leverage build-up.
Strategic scenario matrix for September
| Parameter | Scenario 1: Structural breakout (35%) | Scenario 2: Pullback and polarity retest (45%) | Scenario 3: Rejection and leverage flush (20%) |
|---|---|---|---|
| Technical trigger | Confirmed daily close above $82,656 on strong volume | Failure to clear $81,500 without a break below $77,000 | Clean 4H/1D close below the critical $77,057 threshold |
| Price targets | $85,000, then extension toward $91,719 | Retest of the $77,000 zone before a move back toward $82,000 | Capitulation wick toward $68,500 |
| Invalidation criterion | Re-entry below $80,500 after an unconfirmed breakout (bull trap) | Daily close below $76,500 | Impulsive recovery and confirmed close above $83,000 |
The structural breakout scenario relies on continued net spot ETF inflows and the full absorption of institutional sell orders stacked between $82,000 and $83,000. A confirmed daily close above $82,656 would free price from the 50-week moving-average resistance and put nearly all 2026 institutional investors into unrealized profit territory, opening the path toward $85,000 and then $91,719.
The pullback and polarity retest scenario is the most robust from a chart perspective. Facing exhaustion of the impulse below $81,500 and extreme daily RSI overbought conditions, the market would enter an orderly pullback toward the old flag ceiling between $77,000 and $78,000. Buyers defending this level would reset the momentum oscillators without damaging the underlying uptrend structure.
The rejection and leverage flush scenario would be triggered by a macro disappointment or a sudden drying-up of institutional spot demand. Failure to clear $82,000 would prompt market makers to lower their support lines; a confirmed break of the $77,057 pivot would then trigger stop-loss orders left over from the flag breakout. Given the $3 billion in long leverage stacked beneath that level, a wave of forced liquidation-driven selling would mechanically drag prices toward $75,000, or even $68,500.
Strategic outlook and risk management
Multi-timeframe technical analysis, combined with order-book metrics and the macro backdrop, shows that Bitcoin is trading in a critical arbitrage zone. While the medium-term structure has regained a bullish orientation supported by the recovery of the daily moving averages, the immediate proximity of the historical $81,000–$82,500 rejection zone calls for disciplined risk management.
For short-term tactical traders, buying directly at current levels carries unfavorable risk asymmetry given the thickness of the passive sell wall and the daily RSI overheating. The setups offering the best risk/reward sit either in waiting for a confirmed breakout above $82,656 on substantial volume, or in positioning on a controlled pullback into the $77,000 absorption block. For long-term allocators, the setup remains healthy thanks to dominant spot buying flows and moderate perpetual funding rates — holding above the $77,000 structural support preserves the integrity of the uptrend born out of the $57,800 summer low.
Disclaimer: This article is intended solely for educational and informational purposes. It does not constitute investment advice, a recommendation to buy or sell, or a solicitation to trade financial assets in any way. Cryptocurrency markets are highly volatile, and any financial decision should be based on your own research and, where appropriate, the advice of a licensed professional.

