


Bitcoin (BTC) is moving through a consolidation phase that looks quiet but feels charged. Having been rejected far from its all-time highs above $120,000, the leading crypto asset now trades in a tight channel around $63,800, squeezed between a solid buyer floor and a stubborn wall of sell orders overhead. Beneath this apparent calm, the market structure — from the daily moving averages down to the order book — tells a different story: one of a system quietly building energy for a large directional move.
A macro backdrop that keeps risk appetite in check
The macroeconomic backdrop remains unfavorable for risk assets. The US Federal Reserve continues to hold its policy rate in an elevated range, while inflation keeps running above target, fueled by higher energy costs and geopolitical tensions in the Middle East. Rising US Treasury yields, combined with a strong dollar, are squeezing the liquidity available for speculative assets.
That caution shows up in mixed Spot Bitcoin ETF flows over recent weeks, as well as in treasury reallocations by some large ecosystem players toward liquid reserves. The Crypto Fear & Greed Index is stuck at 35, in “Fear” territory — a sign of broadly defensive positioning among investors.
| Macro indicator | Current value / state | Direct impact on BTC liquidity |
|---|---|---|
| Fed policy rate | 3.50% – 3.75% (held) | Continued pressure on risk assets |
| US 30-year Treasury yield | 5.24% | Stronger competition for real yields |
| Crypto Fear & Greed Index | 35 (Fear) | Predominance of long-position liquidations |
| Global crypto market cap | $2.15 – $2.18 trillion | Global volume in a compression phase |
| Spot BTC ETF flows (monthly) | Modest net flows / occasional outflows | Absence of an aggressive institutional buy catalyst |
Multi-timeframe technical structure
Daily (1D): a post-capitulation consolidation
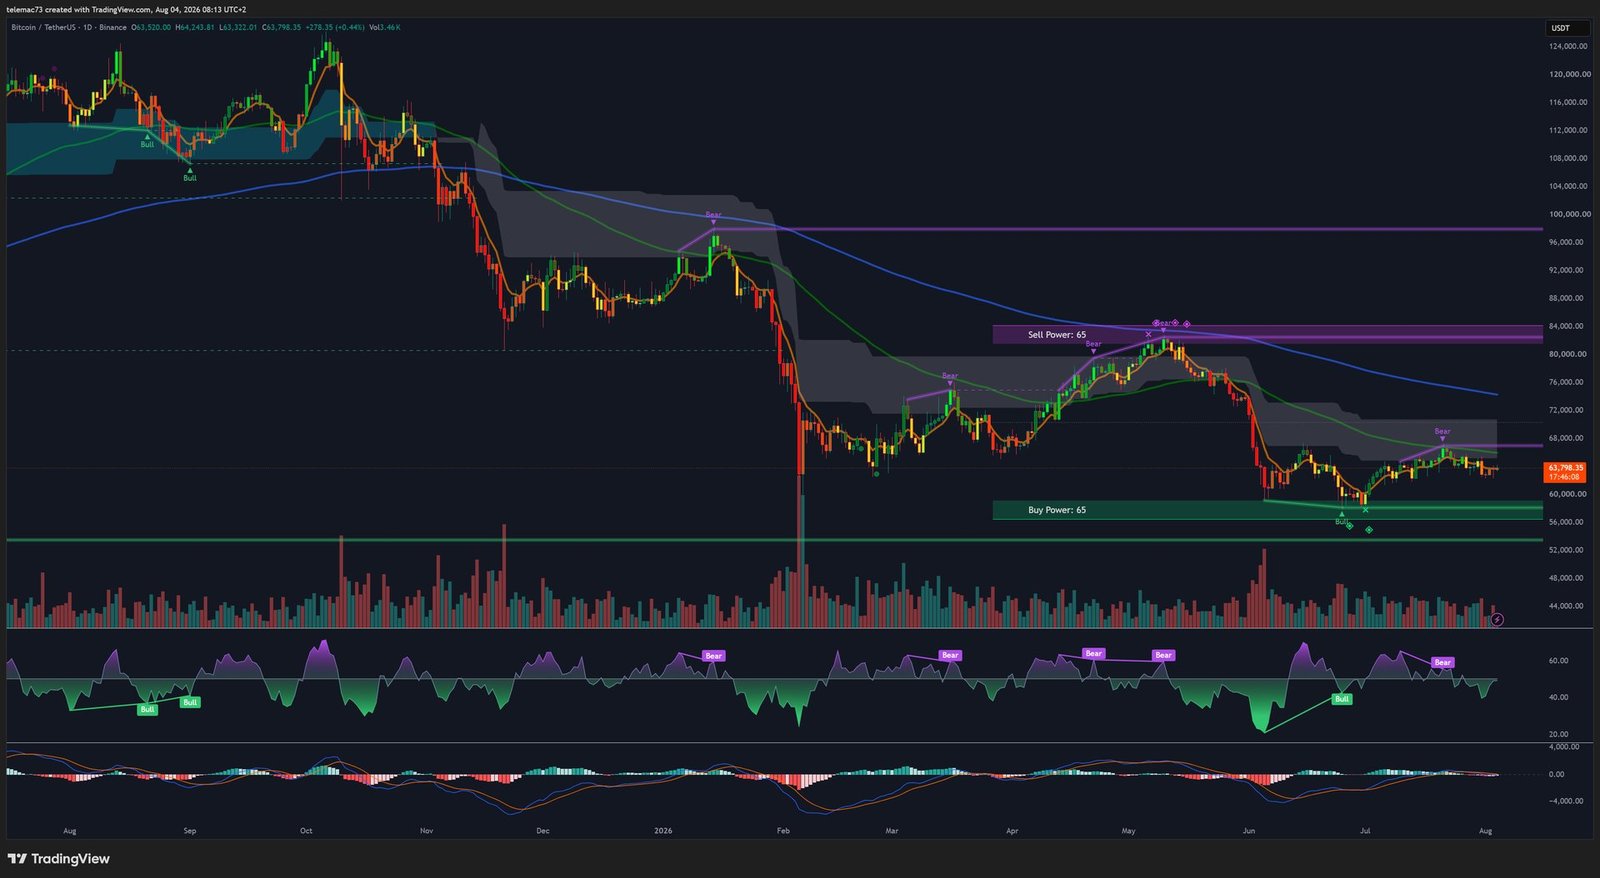
On the daily chart, the underlying structure remains bearish but is stabilizing. After the break of the major uptrend and the formation of a cyclical low in the $53,000 support zone, price has moved into a horizontal accumulation phase. The 50- and 200-day moving averages, positioned well above current price, act as an unbroken dynamic ceiling, confirming broad-based seller alignment.
The daily RSI has pulled out of extreme oversold territory to stabilize around 48, reflecting a neutralization of downside momentum without validating a structural reversal. The MACD shows a bullish crossover initiated from the lows, but its signal line remains stuck near the zero axis — a lack of buying conviction that calls for caution.
4-Hour (4H): a symmetric compression triangle
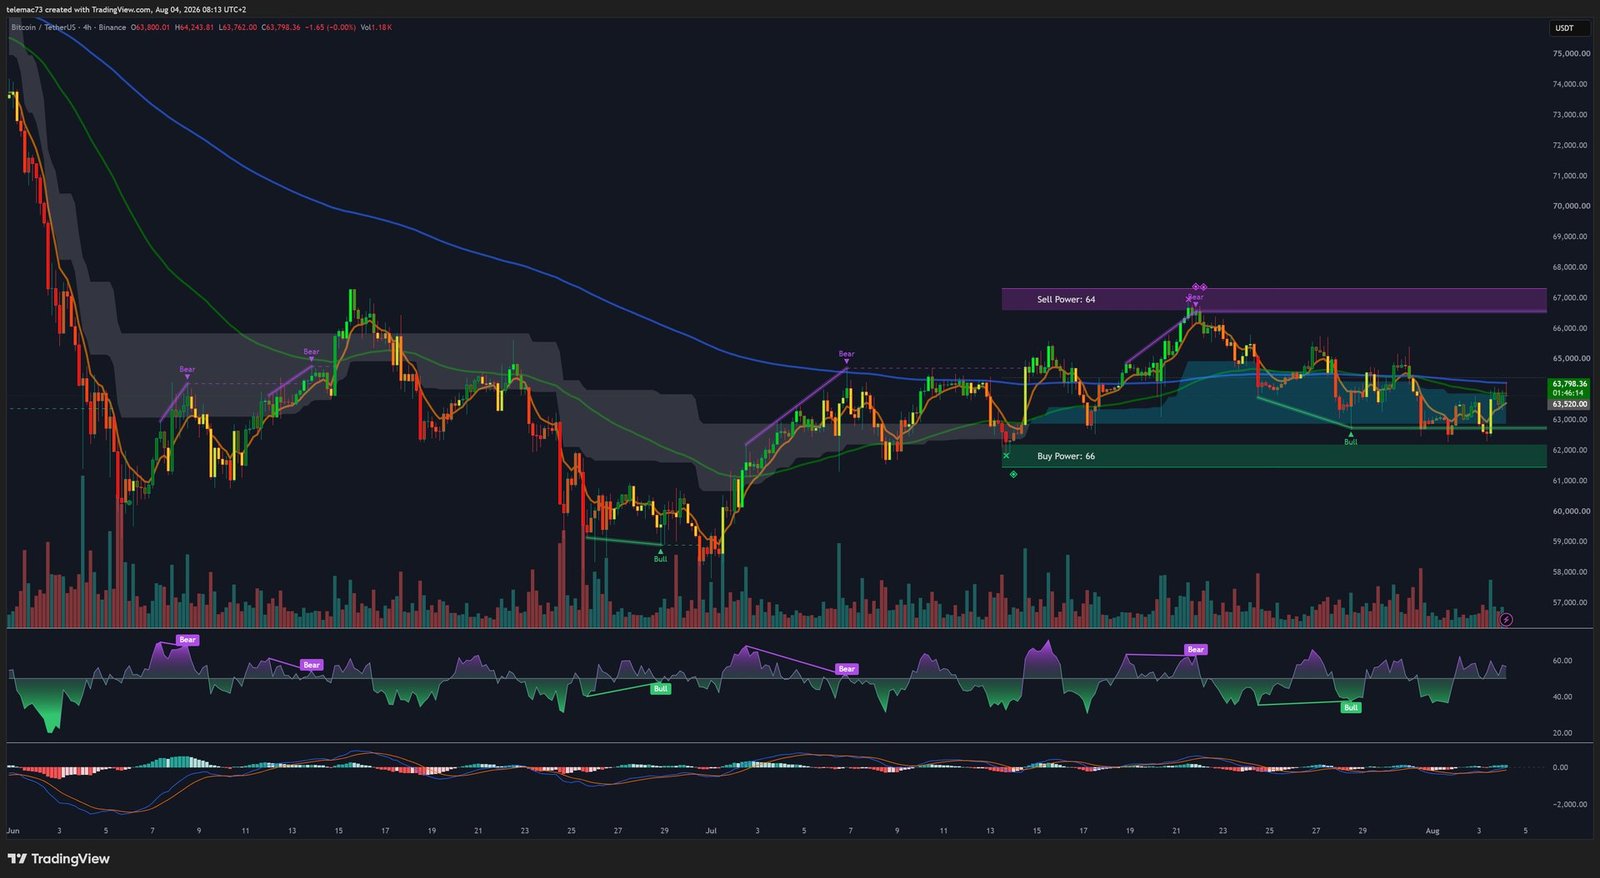
On the 4-hour timeframe, price action sits inside a symmetric compression pattern, comparable to a neutral triangle. The lower boundary rests on a buy-liquidity block between $61,500 and $63,200, while the upper boundary is defined by a descending trendline beneath the $66,500 resistance.
- A neutral RSI hovering around 50, having recently confirmed a bullish divergence near $62,000, followed by a bearish divergence under $66,000.
- A MACD oscillating around its zero line, with tightly compressed histograms reflecting a lack of clear directional momentum.
- A confluence zone formed by the exponential moving averages (EMA 21/50) near $63,800, currently acting as the immediate pivot for price.
15-Minute: the intraday mechanics
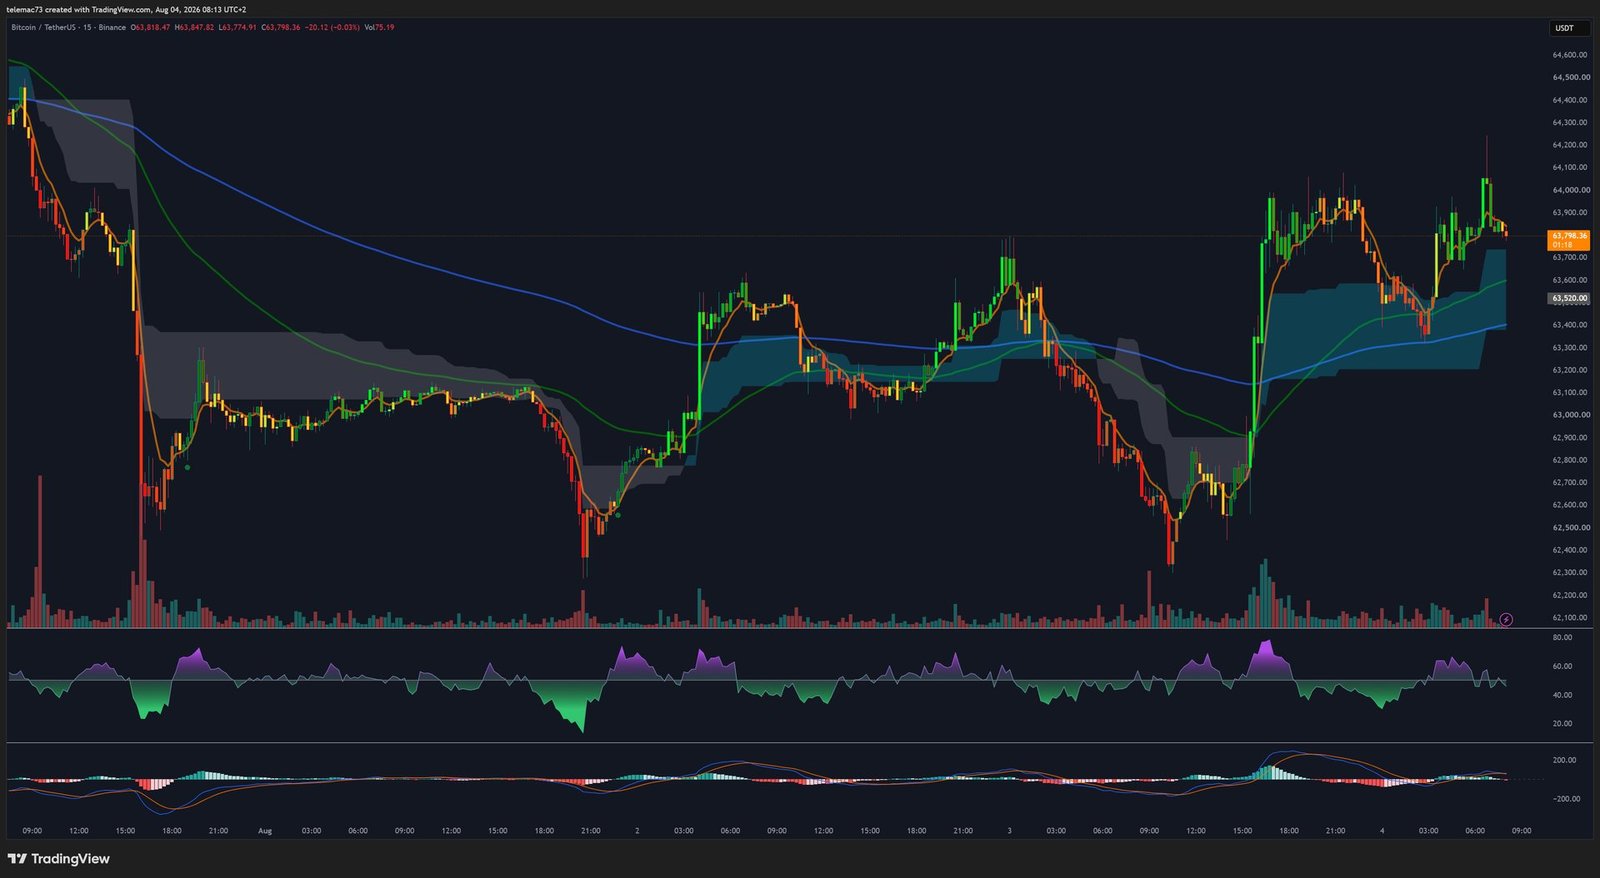
On the short-term chart, a liquidity sweep below $62,500 was followed by a fast buying impulse that pushed price back above $63,500, triggering an intraday golden cross on the short moving averages (EMA 9/21). The RSI reached overbought territory at 68 during the local peak at $64,200, before pulling back to the 52-55 range to work off excess intraday leverage. The short-term MACD shows a gradual weakening of its positive histogram, suggesting that a consolidation phase, or a modest retest of the $63,500 intraday support, may be needed before any fresh attempt toward the $64,500 resistance.
Market microstructure: what the liquidity heatmap reveals
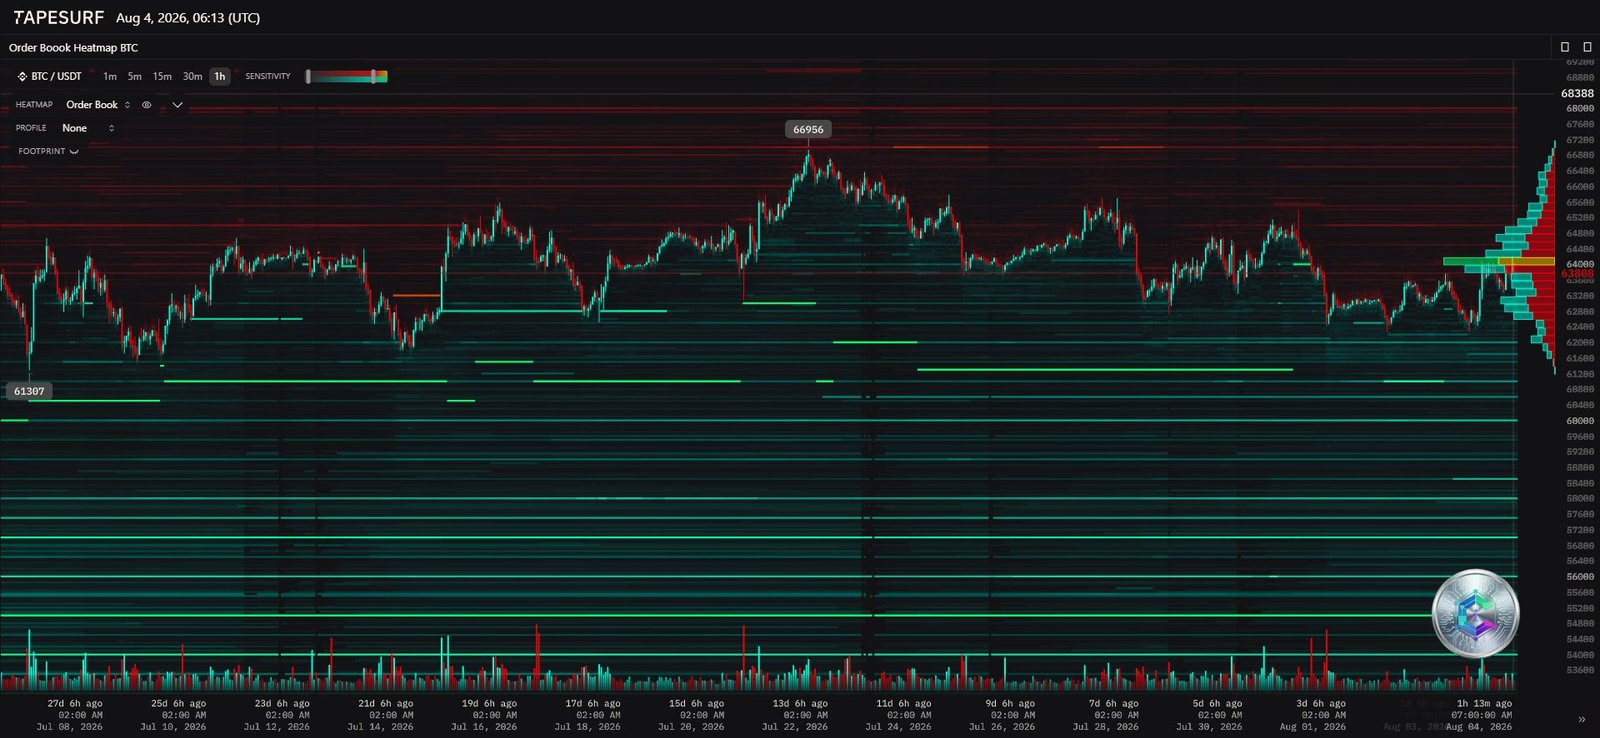
A closer look at the order book adds valuable insight into where resting limit orders and market-maker interest are concentrated. On the sell side, the densest cluster of liquidity sits above $66,000, with a critical seller node identified precisely at $66,955 — a genuine wall that coincides with the upper boundary of the 4H compression triangle.
On the buy side, liquidity is stacked in tiers: a first passive defense level at $62,000, followed by larger order blocks around $60,000 and then $58,000. The horizontal volume profile shows a high-volume node around $63,700-$64,000 — exactly where price currently trades — indicating a temporary equilibrium between buyers and sellers over the asset’s short-term fair value.
Key support, resistance and pivot levels
| Timeframe | Major support | Intermediate support | Pivot point | Intermediate resistance |
|---|---|---|---|---|
| Daily (1D) | $53,000 | $60,000 | $74,000 | $83,000 |
| 4-Hour (4H) | $61,500 | $63,200 | $64,700 | $66,500 |
| 15-Minute | $62,400 | $63,500 | $64,200 | — |
Indicator and oscillator matrix
| Timeframe | RSI (14) | MACD | Moving averages | Chart patterns |
|---|---|---|---|---|
| Daily (1D) | 48 (Neutral / out of oversold) | Bullish crossover below the zero line | Price below SMA 50/200 (downtrend) | Post-capitulation accumulation range |
| 4-Hour (4H) | 50 (Neutral / divergences confirmed) | Flat lines around the zero axis | Consolidation around EMA 21/50 | Compression triangle / neutral flag |
| 15-Minute | 53 (Post-overbought consolidation) | Positive signal line, declining histogram | Recent intraday golden cross (EMA 9/21) | W-shaped structure (local double bottom) |
On crossovers and divergences, the intraday (15m) chart confirmed a golden cross on the short moving averages during the bounce from $62,400, propelling price toward $64,200. By contrast, no macro golden cross (1D/4H) is in place: the longer-term moving averages remain in a downward slope, acting as dynamic resistance against any bounce attempt toward $74,000. A clear bullish divergence on the 4H timeframe correctly anticipated the bounce from $61,500, but the absence of a similar divergence on the daily suggests the current move is more of a technical breather than an irreversible trend reversal.
Strategic scenarios and invalidation levels
Bullish scenario: toward upper liquidity
To invalidate the bearish compression structure, Bitcoin needs a confirmed 4H close above the immediate $64,700 resistance, accompanied by a meaningful pickup in buying volume. The following targets then come into play:
- Target 1: a test of the major sell liquidity identified on the heatmap, at $66,955.
- Target 2: an extension into the 4H resistance zone beyond $67,500.
- Macro target: filling the liquidity void up to the daily moving averages, near $74,000.
- Bullish invalidation: a close below the $63,300 pivot would cancel this scenario.
Bearish scenario: compression breakdown and liquidity hunt
If price fails to hold the $63,800 control point and sell pressure intensifies on the back of negative ETF flows or a tightening macro backdrop, the risk of a downside break out of the triangle increases:
- Target 1: a break of the $63,300 intermediate support, triggering a retest of the $62,500 buy block.
- Target 2: liquidation of leveraged long positions below $60,000, targeting the buy-liquidity node at $58,000.
- Macro target: a retest of the major daily support zone, between $53,000 and $55,000.
- Bearish invalidation: a confirmed 4H close above $65,000 would invalidate the selling pressure.
Conclusion: a market at a crossroads
Bitcoin sits at a crossroads, compressed inside a channel of hesitation between a solid buyer-defended support around $62,000 and a massive wall of sell orders clustered near $67,000. The combined read of technical data and market microstructure suggests the market is quietly building energy for a large directional move. As long as price stays boxed between $62,500 and $65,000, neutrality prevails. An optimal tactical entry would likely require waiting for a clear resolution of this compression zone, backed by expanding volume and aligned institutional flows across derivatives and spot markets.
Disclaimer: This article is provided strictly for educational and informational purposes. It does not constitute investment advice, a recommendation to buy or sell, or an inducement to trade digital assets. Cryptocurrency markets are highly volatile and carry a risk of capital loss. Always do your own research (DYOR) and consult a qualified financial advisor before making any investment decision.

