


Following August’s bullish impulse, Bitcoin (BTC/USDT) is going through a correction and technical consolidation phase. Price is trading around $77,250, just below several key resistance levels, as the market heads into a particularly heavy macroeconomic and regulatory week. The bias remains bearish in the very short term, but the structure on the higher timeframes (4H and daily) remains defensible as long as the $75,500 – $76,000 zone holds.
Analysis based on BTC/USDT charts (Binance) on the 15-minute, 4-hour and daily timeframes, plus a liquidity heatmap, data captured on September 15, 2026 around 09:18 UTC. Levels mentioned are indicative zones, not exact tick prices, and should not be treated as buy or sell signals.
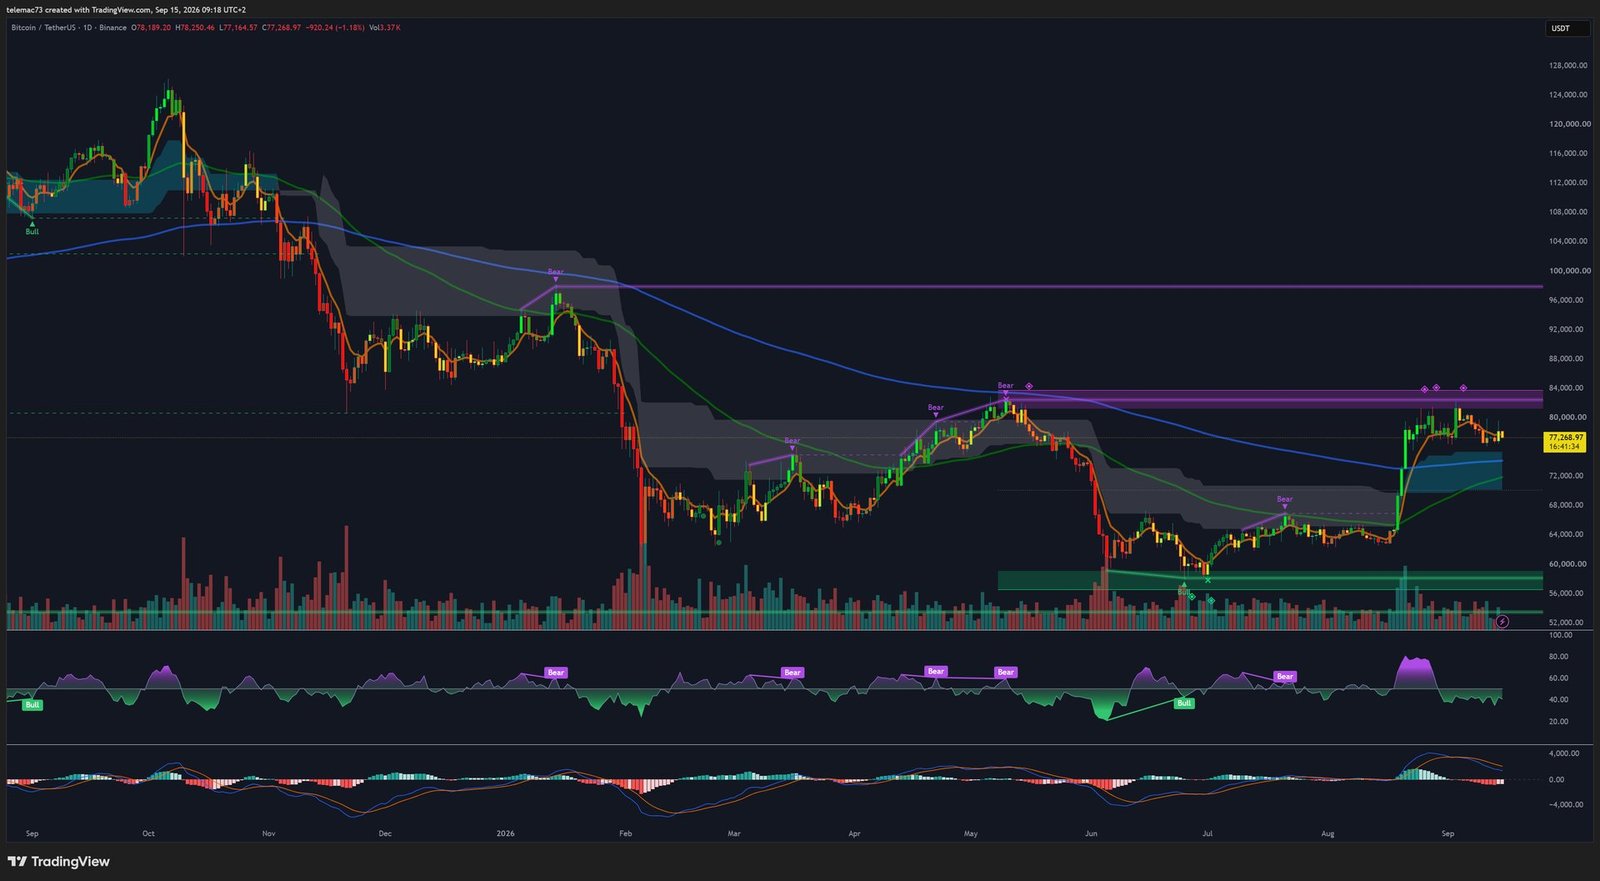
Multi-timeframe read: a market caught between conflicting signals
Comparing the different timeframes reveals a market in a decision phase: bearish intraday bias, neutral consolidation on the 4-hour chart, but a still-bullish underlying structure on the daily.
| Timeframe | Observed structure | Current bias | Signal to watch |
|---|---|---|---|
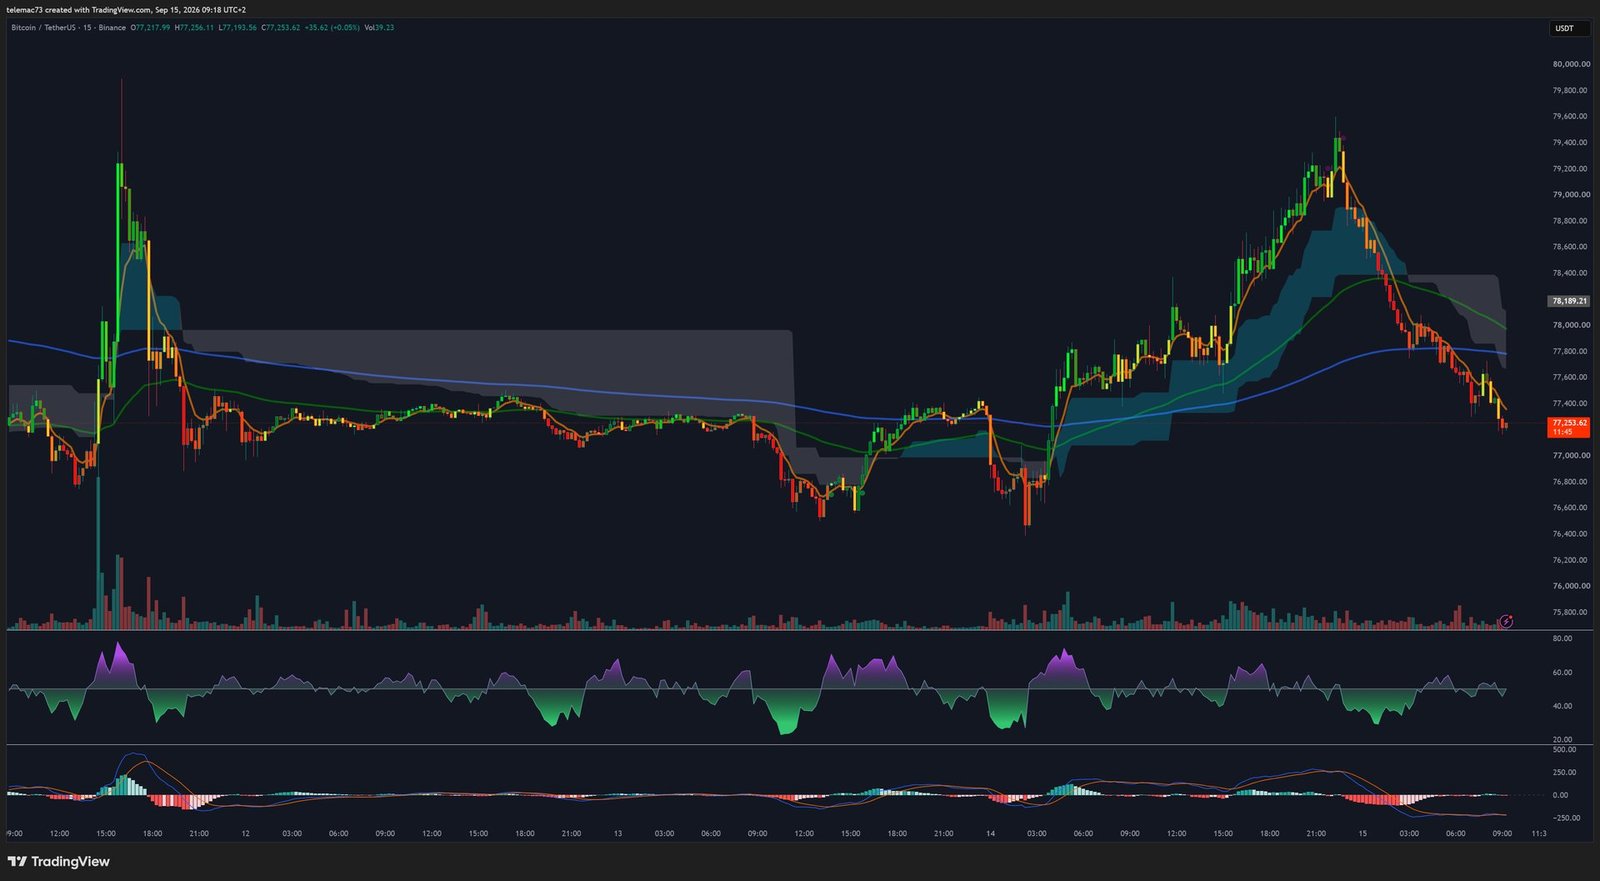
| 15 minutes | Sequence of lower highs and lower lows since the rejection near $79,400 | Bearish in the very short term | Reclaiming $77,800, then $78,200, needed to invalidate selling pressure |
| 4 hours | Sideways consolidation after the violent rally from $63,000, below a supply zone around $81,000 – $82,300 | Neutral to slightly bearish below $78,200 – $79,000 | Defense of $75,500 – $76,000 or a clean break of this zone |
| Daily | Major rebound from the June-July floor, then a pause under weekly resistance | Bullish underlying trend, but momentum cooling | Daily close above $80,000, ideally $82,000, to reignite the uptrend |
| Heatmap | Notable buy-side liquidity below price; sell walls higher up | Liquidity magnet on both sides | Possible sweep of nearby liquidity before the next directional move |
Technical levels: support, resistance and pivots
Resistance
- $77,800 – $78,200: first intraday resistance, matching the long moving average visible on the 15-minute chart and former supports turned resistance. Price has just tested it from below.
- $79,000: major technical pivot, aligned with a cloud zone / intermediate moving average and a structure-reclaim threshold. A 15-minute then 1-hour close above would meaningfully improve the rebound scenario.
- $79,400: recent distribution zone where the 15-minute local top formed, followed by aggressive selling. This level needs to be reclaimed before talking about short-term bullish continuation.
- $81,000: important 4-hour resistance, matching the former congestion zone after the large bullish move.
- $81,000 – $82,300: dominant 4-hour resistance. This zone constitutes a genuine supply zone, with a bearish divergence identified on the chart. The heatmap shows heavy liquidity here: it can act as a magnet if bullish momentum returns, but it can also trigger a sharp rejection.
- $82,000 and above: upper daily resistance, the ceiling to reclaim to consider a genuine trend resumption toward higher targets.
Support
- Current zone (~$77,250): immediate intraday support, already under pressure on the 15-minute chart. Not a very reliable support without a quick reclaim.
- ~$76,000: first genuine reaction zone, coinciding with recent 15-minute lows and the upper part of the 4-hour demand zone.
- $75,500 – $76,000: main pivot support. On the 4-hour chart, this zone marks clear demand, confirmed by several reactions and bullish divergence signals. On the heatmap, it’s also an area of dense buy-side liquidity. As long as it holds on a 4-hour close, the consolidation can remain constructive.
- Secondary support in case of a sweep below $75,500: a move here would remain technically recoverable, but would clearly damage momentum.
- Medium-term support, near the 4-hour cloud zone and visible moving averages. Losing it would turn the current correction into a deeper retracement.
- $63,000: large volume zone on the heatmap, matching the old pre-impulse base. Not the primary short-term scenario, but a major structural level in the event of a deep breakdown.
Technical indicators and signals
RSI
On the 15-minute chart, RSI is trading close to its neutral zone after bouncing from lower values. It is neither deeply oversold nor overbought, so it isn’t yet flashing a strong reversal signal. RSI spikes near overbought territory occurred near local tops, notably during the push toward $79,400, before the market rejected. Conversely, oversold zones have accompanied previous lows and rebounds. A return of the 15-minute RSI toward those levels, combined with a bullish divergence and a defense of the $75,500 – $76,000 zone, would be far more interesting for a tactical long setup.
On the 4-hour chart, RSI sits around its midline, with bullish divergences already flagged at the late-August and early-September lows. This suggests sellers have lost some momentum, without automatically confirming a resumption of the uptrend. In short, there is no immediately exploitable RSI extreme: the setup needs either a bullish divergence on support, or a clean reclaim above the $79,000 zone.
MACD
The 15-minute MACD remains weak and below its zero line following the recent bearish move, but the histogram appears to be contracting: selling pressure is slowing, without confirming a reversal. A credible MACD golden cross on this timeframe, ideally confirmed on the 1-hour chart, would carry more weight if price simultaneously reclaims $78,200 and then $79,000.
The 4-hour MACD remains in a cooling phase after the late-August rally: the lines still look tilted lower or very flat. The previous death cross has already played out much of its move, but a bullish crossover is not yet clearly confirmed. On the daily chart, momentum has faded after August’s bullish acceleration; the structure isn’t broken, but the dynamic is less favorable than at the time of the breakout from the $63,000 zone.
Moving averages and cloud
Price is currently trading below the short moving averages on the 15-minute chart (immediate bearish pressure) and against the long moving average near $79,000, which acts as dynamic resistance. It remains, however, above the slower moving averages on the 4-hour and daily charts, keeping a more positive structural bias on the higher timeframes. The market sits inside or below a 4-hour cloud zone: a decision zone, not a confirmed trend. There is no clear, recent golden cross of moving averages on the 15-minute chart; on the contrary, the short-term averages have rolled over after the top. The next positive signal would be the fast average crossing back above the medium average, alongside a reclaim of the $78,200 zone.
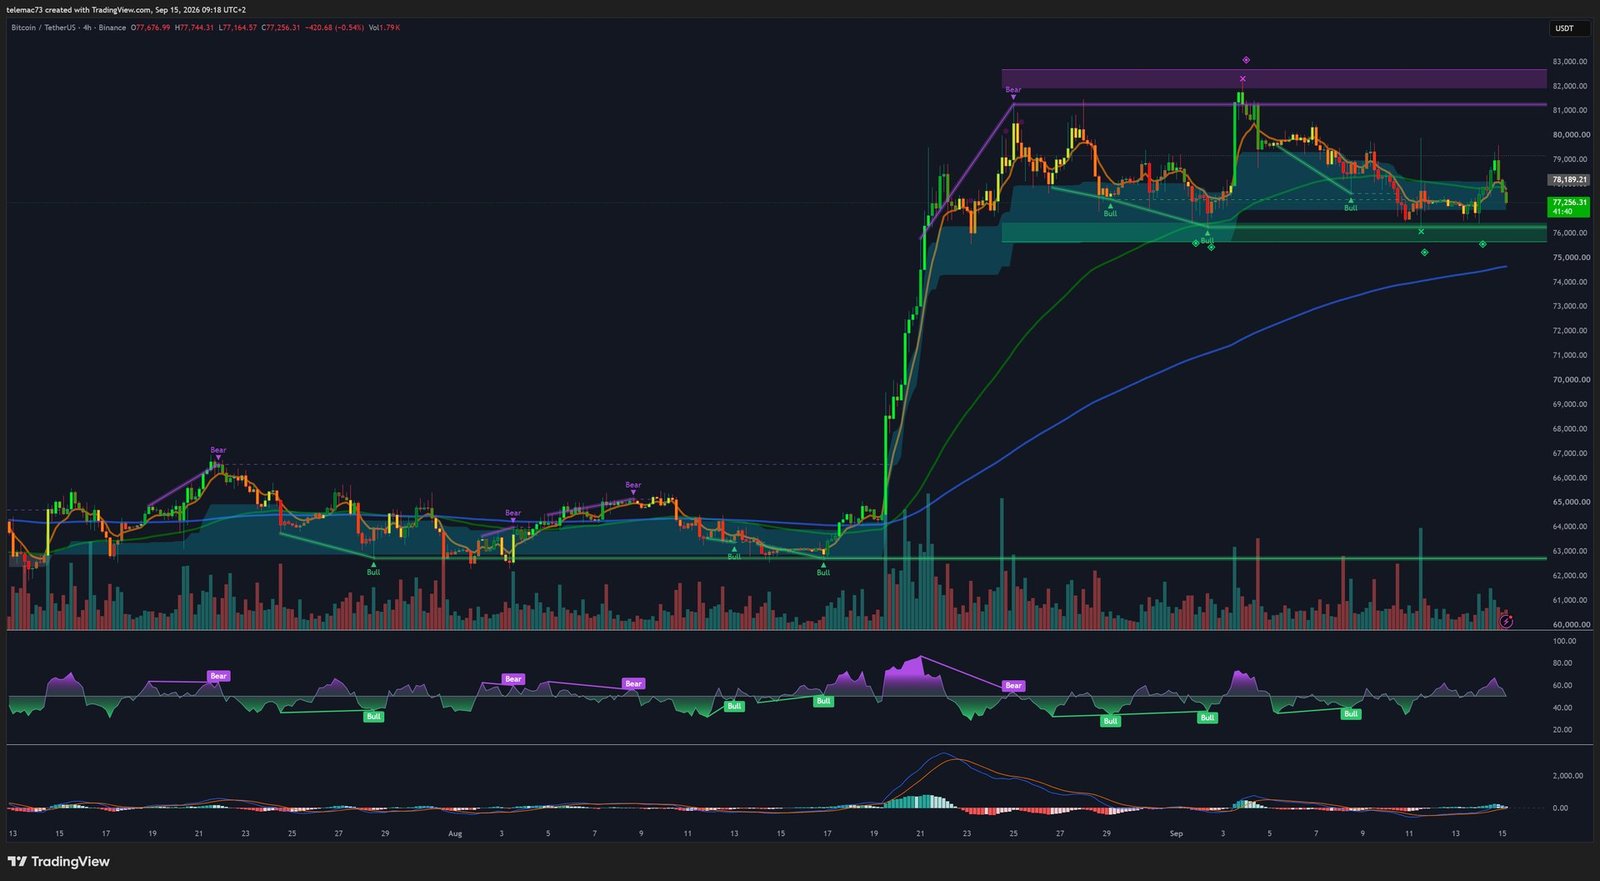
Chart patterns
Possible bear flag on the 15-minute chart
Since the rejection at $79,400, price has formed a bearish leg followed by a weak bounce and a downward drift — a setup resembling a bear flag or a short-term descending channel. A bearish confirmation would come from a breakdown with volume below $76,000, then especially below $75,500, with a theoretical target back toward the secondary support zone, potentially lower. Invalidation of this pattern would require a reclaim and hold above $78,200, followed by a break of $79,000.
4-hour compression
On the 4-hour chart, the post-rally phase resembles a compressed consolidation between demand near $75,500 – $76,000, intermediate resistance around $78,200 – $79,000, and the large supply zone at $81,000 – $82,300. It’s not yet a perfectly symmetrical triangle, but there is a visible compression of the range and declining amplitude — a break out of this structure should trigger a volatility expansion. A bullish break would be confirmed by a clean 4-hour close above $79,000 followed by acceptance, targeting $81,000, $82,300, then $82,000 and beyond. A bearish break would be confirmed by a 4-hour close below $75,500, targeting the secondary support and then the structural $63,000 zone.
Double rejection under supply
The $81,000 – $82,300 zone has already rejected price on multiple occasions. On the 4-hour chart, bearish signals and this zone show that the market recognizes it as significant supply. Another visit without volume or a firm close above it could form a triple top or a distribution pattern; conversely, a firm 4-hour/daily close above it would cancel this risk and could trigger a hunt for liquidity resting higher up.
Heatmap and liquidity
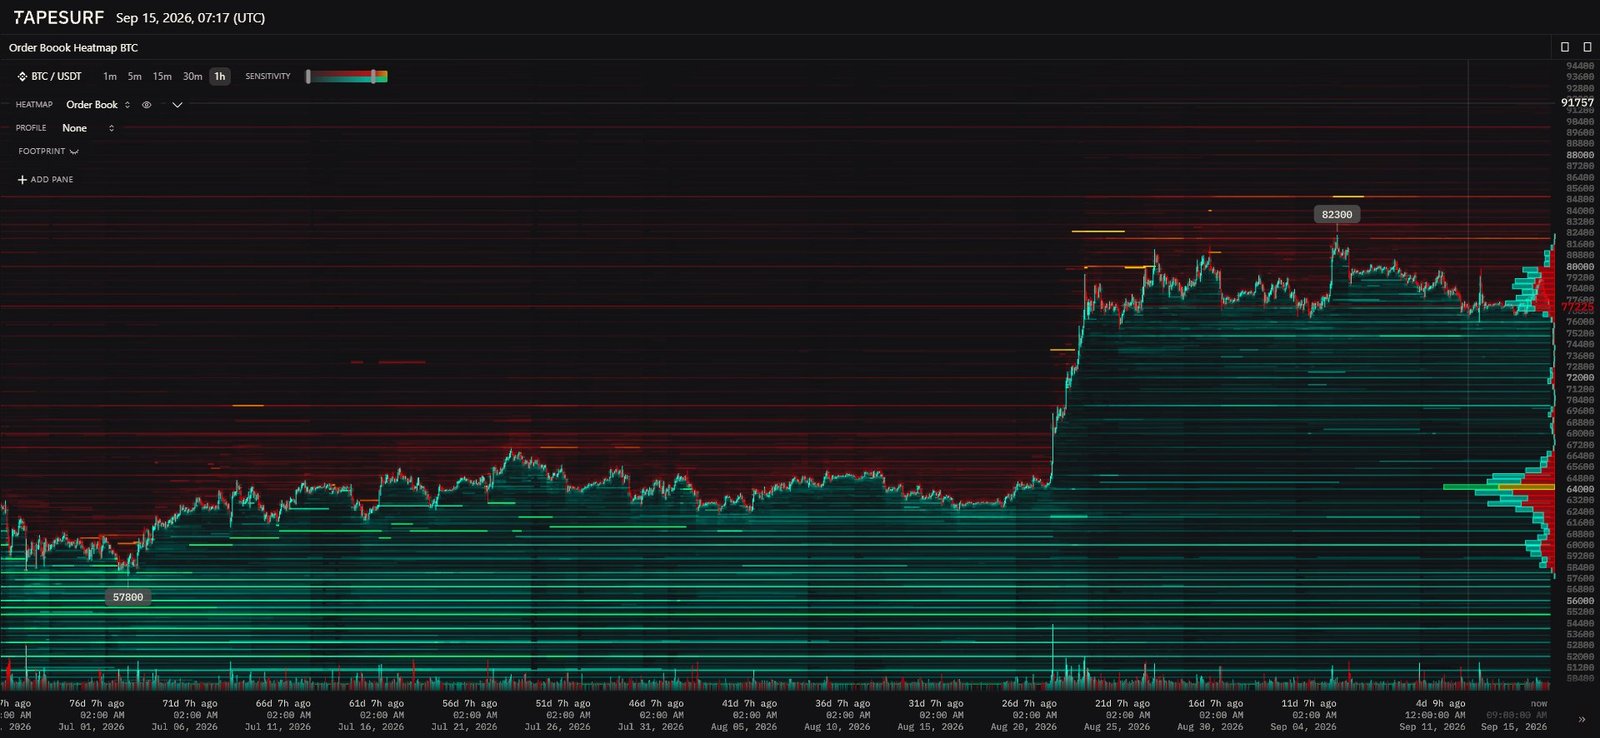
The heatmap is useful for spotting where price might go hunting for liquidity, but it doesn’t determine direction on its own — orders can be cancelled or moved at any time. Above price, there are nearby offers and former congestion zones, followed by a notably heavier sell-side concentration around the large $81,000 – $82,300 zone. Above that zone, the path opens up more, but considerable supply would need to be absorbed. Below price, a first nearby liquidity magnet aligns with the 4-hour demand zone around $75,500 – $76,000, with several additional layers of bids lower down, and a large historical volume node around $63,000, likely an important level should the correction become much deeper.
The operational takeaway from the heatmap is simple: price sits in the middle of a range with liquidity pockets visible on both sides. A sweep of $75,500 followed by a reclaim is plausible; similarly, a push above $79,000 could be attracted toward the $81,000 – $82,300 zone.
Macro catalysts: a high-risk week
This is a high-risk week for Bitcoin. The market is watching a procedural vote in the US Senate on the CLARITY Act on September 15, followed by the Federal Reserve’s monetary policy decision at the conclusion of its September 15–16 meeting. According to Reuters, rate-cut expectations were running very high in surveys, which explains part of the current caution around risk assets. US August CPI came in at 3.4% year-over-year, and BTC has recently traded near its current zone after briefly touching lower levels in prior days.
Trading scenarios
Bullish scenario (conditional probability)
This scenario becomes credible if BTC defends $75,500 – $76,000, reclaims $78,200, and then closes above $79,000 on the 4-hour chart. Targets would then extend toward $81,000, $82,300, $82,000, and beyond. Ideal confirmation would combine rising buy volume, the 15-minute RSI breaking out of its neutral zone to the upside, a bullish 15-minute MACD crossover, and an improving 4-hour MACD. A durable acceptance above the $82,000 zone would open the path toward higher targets.
Neutral scenario
The cleanest scenario ahead of the macro announcements would be an oscillation between $75,500 – $76,000 and $81,000 – $82,300, matching the current equilibrium between liquidity supports below price and intraday averages/resistance above. In that case, trading the middle of the range typically offers a poor risk/reward ratio; it’s preferable to monitor the extremes with confirmation.
Bearish scenario — not to be ignored
This scenario is confirmed by a 15-minute/1-hour close below $76,000, and especially a 4-hour close below $75,500. Targets would then extend toward the secondary support, then potentially the structural $63,000 zone. This would complete the short-term bear flag and place BTC below the main 4-hour demand zone. Below $75,500, the correction would take on a more concerning scale, with a possible return toward the large dynamic support near $63,000.
Watch plan
- Above $79,000: watch for a reclaim with volume; tactical bullish bias toward $81,000, $82,300, then $82,000.
- Between $75,500 and $79,000: neutral, noisy market; avoid mistaking technical bounces for a confirmed reversal.
- Below $75,500 on a 4-hour close: the bullish consolidation scenario is invalidated in the short term; priority shifts to the secondary support and then the $63,000 zone.
- Toward $81,000 – $82,300: don’t chase a rally without observing seller absorption and firm closes. This is the most important resistance zone in this analysis.
- During the Fed announcement and regulatory developments: reduce leverage and wait for post-announcement closes. Initial wicks can sweep stops on both sides before the real direction emerges. The combination of the CLARITY Act vote and the Fed decision makes a volatility spike particularly likely this week.
Conclusion
Technically, Bitcoin remains constructive on the daily chart as long as the $75,500 – $76,000 zone holds, but the 15-minute chart stays seller-controlled until the $78,200 – $79,000 resistance is reclaimed. Given a high-risk macro and regulatory week, caution and waiting for clear confirmations remain warranted before taking any significant position.
⚠️ Disclaimer: this article is provided for informational and educational purposes only. It does not constitute investment advice, a recommendation to buy or sell, or a financial solicitation of any kind. Cryptocurrency markets are highly volatile and carry significant risk of capital loss. Do your own research (DYOR) and consult a qualified financial advisor before making any investment decision.

