


Bitcoin is going through an unusual compression phase in early August 2026, locked in a tight consolidation corridor between $63,000 and $65,000. This setup follows a major correction from the all-time high of over $126,000 reached in October 2025. Between a restrictive monetary policy, an overheated derivatives market, and an increasingly stretched order-book microstructure, pressure is building from every direction. This analysis brings together the macroeconomic, derivatives, and chart-based dimensions to outline the most likely scenarios for the weeks ahead.
The Fed keeps the pressure on as ETF flows search for a new balance
At its July 2026 meeting, the Federal Open Market Committee held rates in a range of 3.50% to 3.75%, a fifth consecutive hold that entrenches a higher-for-longer rate environment. This continues to weigh structurally on non-yielding risk assets such as Bitcoin. Jerome Powell remained firm on what he called persistent inflation, while other committee members, such as Kevin Warsh, adopted a deliberately ambiguous stance, leaving markets waiting for the Jackson Hole symposium at the end of August.
This monetary backdrop is compounded by risk aversion fueled by geopolitical tensions in the Middle East and by the U.S. Senate’s delay of the Crypto Clarity Act, which was meant to clarify the regulatory status of digital assets. The Crypto Fear & Greed Index has slipped into “Fear” territory, hovering around 34-35, a sentiment made worse by a sharp sell-off in AI and semiconductor stocks that spilled over into crypto markets.
On the institutional side, 2026 is shaping up as a year of rotation for U.S. spot Bitcoin ETFs. After a “February Freeze” that saw roughly $4.5 billion in net outflows over eight weeks, the sector remains dominated by BlackRock’s iShares Bitcoin Trust (IBIT), which alone holds around $54.4 billion in assets under management — nearly 778,000 BTC — while the Grayscale Bitcoin Trust continues to bleed assets. In late July, a single-day net inflow of more than $233 million, led by IBIT, hinted at a tentative return of institutional capital, though the monthly trend remains negative overall.
An overheated derivatives market
In contrast to the apparent calm of the spot market, open interest on Bitcoin futures has hit a two-month high, with nearly 750,000 BTC committed — a notional value close to $48 billion. This buildup of open positions right in the middle of a consolidation zone points to a resurgence of leveraged speculative trading on venues such as Binance, Bybit, and the CME.
Funding rates on perpetual contracts remain positive but marginal, ranging between 0% and 0.0063% per eight-hour period. Modest as it looks, this signal fuels an institutional arbitrage strategy known as “cash and carry”: funds buy Bitcoin on the spot market while simultaneously selling the equivalent perpetual contract to capture the funding premium without directional exposure. A rate of just 0.05% per eight-hour interval translates into an annualized cost close to 55%, a useful reminder of how much this metric matters. The flip side of this mechanic is fragility: during the recent pullback, more than $144 million in long positions were liquidated, with market-wide purges exceeding $680 million in a single session, affecting more than 165,000 traders. On the CME, volume and open interest remain concentrated in the nearest expiries, a sign of tactical hedging rather than long-term directional commitment.
Order book and heatmap: reading the liquidity map
In a market this efficient, classic technical analysis is no longer enough — reading the real-time order book through heatmaps has become the professional trader’s real edge.
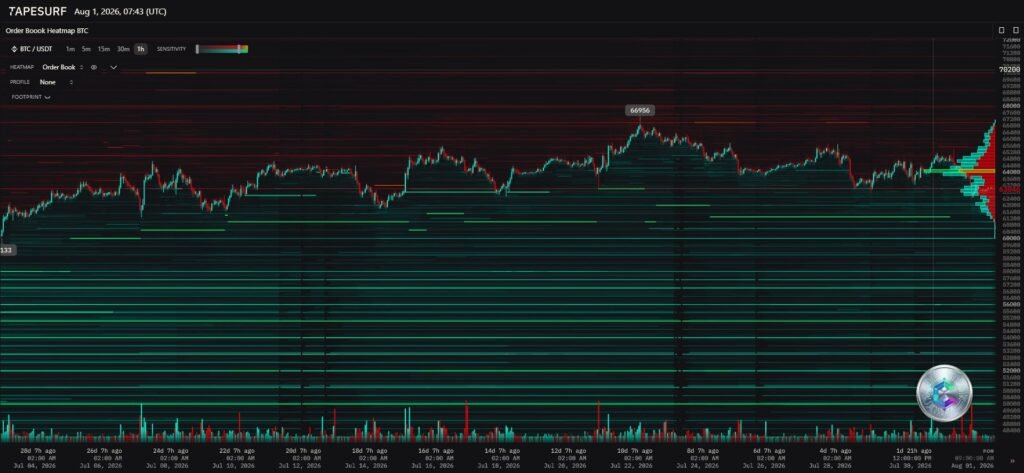
The heatmap shows particularly dense algorithmic sell walls around $64,700, with a second, massive and so far untouched wall near $66,900. These clusters of limit orders act as institutional distribution barriers, where spoofing — large orders appearing and vanishing to intimidate — remains common practice. On the other side, buyers hold dense absorption cushions between $62,000 and $62,800, where iceberg orders let large players absorb selling pressure without revealing their true size. Between these two strongholds, the heatmap reveals a liquidity vacuum prone to erratic moves and price slippage whenever an institutional-size order is executed there. The Cumulative Volume Delta confirms a buyer-exhaustion pattern during the latest push toward $64,500: price kept printing marginal new highs while the CVD turned lower — a divergence that preceded the correction with remarkable precision.
Multi-timeframe technical reading
Daily chart (1D): searching for a floor
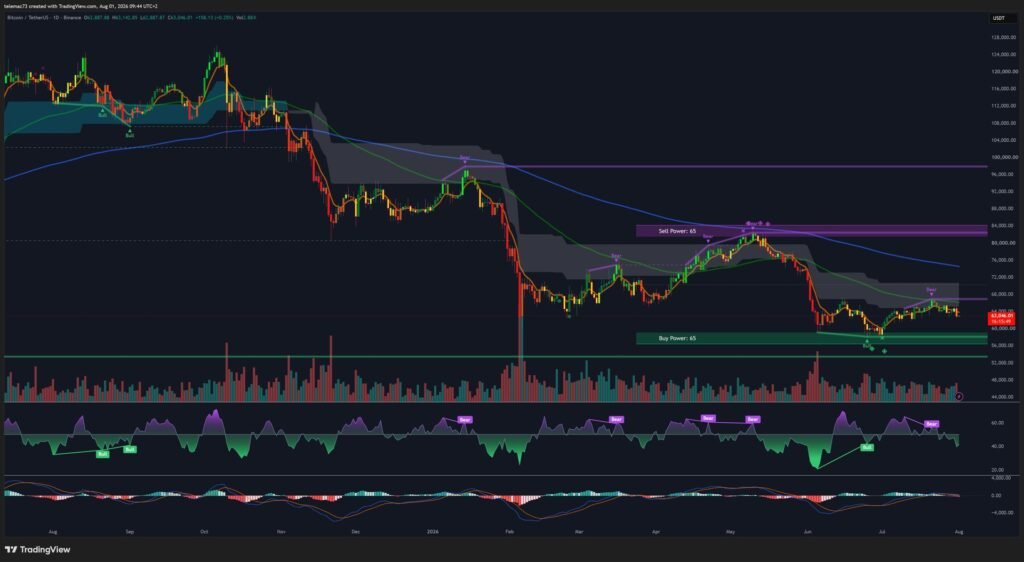
Since the October 2025 top, price structure has followed a relentless sequence of lower highs and lower lows, with drawdown now approaching 50% from the all-time high. While some analysts, including Katie Stockton, argue the cyclical downtrend is maturing and could give way to a basing phase, hard technical evidence of a definitive reversal is still lacking. Bitcoin remains stuck below its 21- and 50-day moving averages (around $64,300), and the structure has been confirmed by a Death Cross on the 50/200-period averages, underlining seller dominance. The daily RSI has stayed firmly below the 50 midline, reflecting a lack of buying conviction, with an institutional “Buy Power” zone identified near $58,000 and “Sell Power” capping any bullish attempt above $84,000.
The intermediate battleground: the 4-hour chart
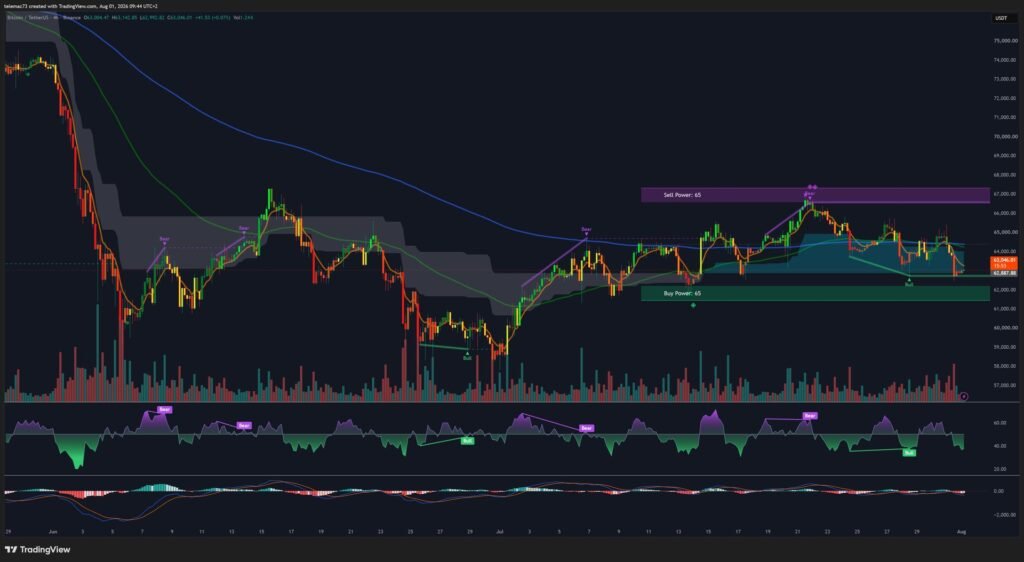
On this timeframe, price action is trapped inside a large bear flag, or compression wedge. After a sharp rejection near $67,000, price spiraled down toward the support confluence around $62,000. A 4H candle close below $62,500 would confirm a formal market structure break, opening the door to asymmetric volatility toward lower cyclical levels. The MACD illustrates this loss of momentum, with histograms widening deeper into negative territory, while the RSI printed clear bearish divergences ahead of the last rejection — without yet reaching the extreme oversold readings needed to guarantee a V-shaped bounce.
Intraday micro-dynamics: the 15-minute chart
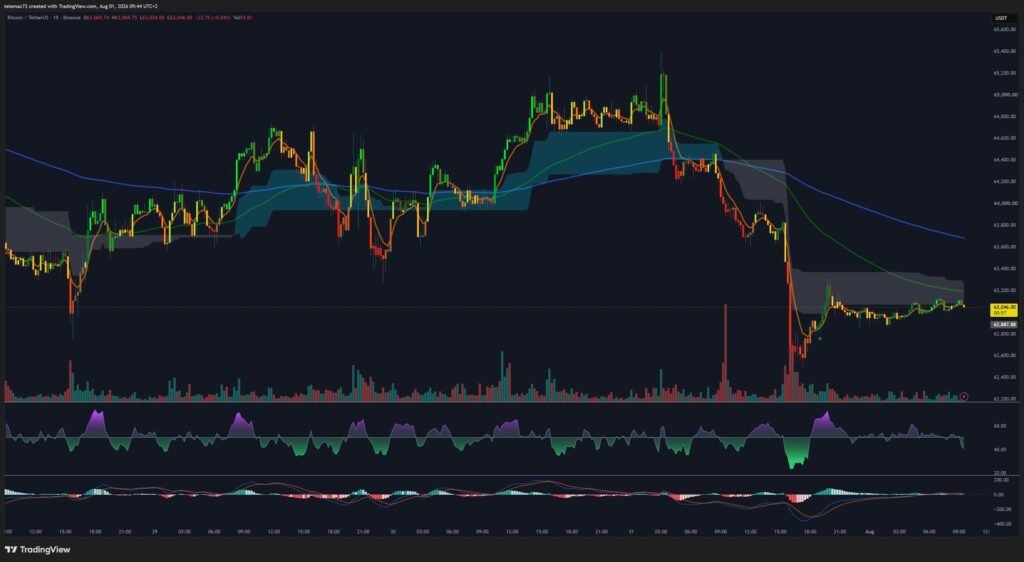
The granularity of the 15-minute chart offers a close-up view of high-frequency algorithmic activity. A vertical capitulation candle recently drove price down from $64,200 in just a handful of candles, bearing all the hallmarks of a liquidation cascade. The RSI plunged below the 20 threshold, triggering an automatic algorithmic mean-reversion buy that temporarily stabilized the asset. The subsequent bounce, however, has stayed weak, forming small intraday bear flags and local Death Crosses on the fast-moving averages — confirming that sellers still hold the initiative.
Altcoins: a flight to quality
Ether shows relative resilience, trading around $1,865, supported by flows into spot Ethereum ETFs — notably BlackRock’s ETHA fund — and by anticipation of a major protocol upgrade. The ETH/BTC ratio has reached its highest levels since spring, reinforced by aggressive ETH accumulation from corporate entities like Bitmine, which is targeting 6 million units to generate staking yield. By contrast, major altcoins (BNB, Solana, XRP, Hyperliquid, Dogecoin, Tron) have shown punishing volatility, with drawdowns of up to 12.4% during Bitcoin’s latest shakeouts. Cardano, mired in governance troubles tied to the cancellation of its annual summit and friction around its hard fork, trades well below all its major moving averages — a clear sign of liquidity increasingly concentrating in BTC and ETH at the expense of the rest of the market.
Key level summary
| Level type | Price (USD) | Rationale |
|---|---|---|
| Macro resistance (bear market invalidation) | $84,000 | Institutional “Sell Power” anchor zone on the daily timeframe |
| Swing resistance | $66,900 | Massive untested liquidity wall identified on the heatmap |
| Upper pivot / immediate resistance | $64,700 | Confluence of the 21- and 50-day moving averages |
| Current pivot | $64,000 | Psychological threshold whose loss reflects fading organic demand |
| First-line support (intraday) | $62,800 | Reversal zone observed on the 15-minute chart |
| Pivot support (institutional defense) | $62,000 | “Buy Power” block identified on the 4-hour chart |
| Macro support (final capitulation) | $58,000 | Theoretical floor of the cyclical basing phase |
Two scenarios for the weeks ahead
The dominant short-term scenario favors a downside resolution of this compression pattern. Constrained by restrictive monetary policy and still-sluggish ETF flows, Bitcoin is pinned against its last lines of defense: a close below $62,800 would trigger stop-loss orders from over-leveraged positions, dragging price toward $62,000, with the risk of an illiquidity wick probing the macro zone near $58,000. Such a purge is often seen as the necessary condition for building a genuine cyclical bottom.
Conversely, invalidating this bearish thesis would require an exogenous catalyst — such as a dovish pivot from the Fed at the Jackson Hole symposium — paired with a sustained revival of ETF inflows, particularly into IBIT. Technically, this would require confirmed absorption of selling pressure above $63,000, reflected in a positive CVD divergence, followed by a reclaim of the $65,000 pivot on a 4H close. Only a break above $67,000, held over time, would signal the end of the bearish sequestration. Until that confirmation appears, caution and disciplined risk management remain the order of the day.
Disclaimer: this article is provided for strictly informational and educational purposes. It does not constitute investment advice, a recommendation to buy or sell, or a solicitation to engage in any financial strategy. Cryptoasset markets are highly volatile and risky; any investment decision remains your sole responsibility.

