


Bitcoin is going through a technical consolidation phase after an impressive rally of nearly 37% from its late-June cyclical low. Trapped between $79,500 and $80,500, the top crypto asset now has to contend with an unexpected macroeconomic shock: US job creation figures came in far above expectations, reshuffling the Federal Reserve’s monetary calendar just days before a decisive week for markets.
This digestion phase follows a failed bullish breakout attempt at the local high of $82,281–$82,300. The September 4 US Non-Farm Payrolls (NFP) report abruptly challenged the assumption of a swift monetary easing, driving bond yields higher and temporarily drying up institutional inflows into spot Bitcoin ETFs.
Structurally, holding the psychological pivot level of $80,000 is the immediate driving variable. Keeping price above this line preserves the path toward the major resistance zone at $83,000–$85,000, while a confirmed breakdown would expose the liquidity resting around the $78,500 support, opening the door to a test of the 20-day exponential moving average (EMA20), currently sitting at $75,260.
Multi-timeframe technical analysis: from the macro cycle to intraday
Daily structure (1D): moving-average realignment and momentum
On the daily timeframe, Bitcoin has formally broken the downward dynamic inherited from the late-2025 all-time high above $138,000. After building a solid accumulation base between $58,000 and $62,000, price action unfolded as a vertical impulsive wave that successively cleared the main institutional moving averages.
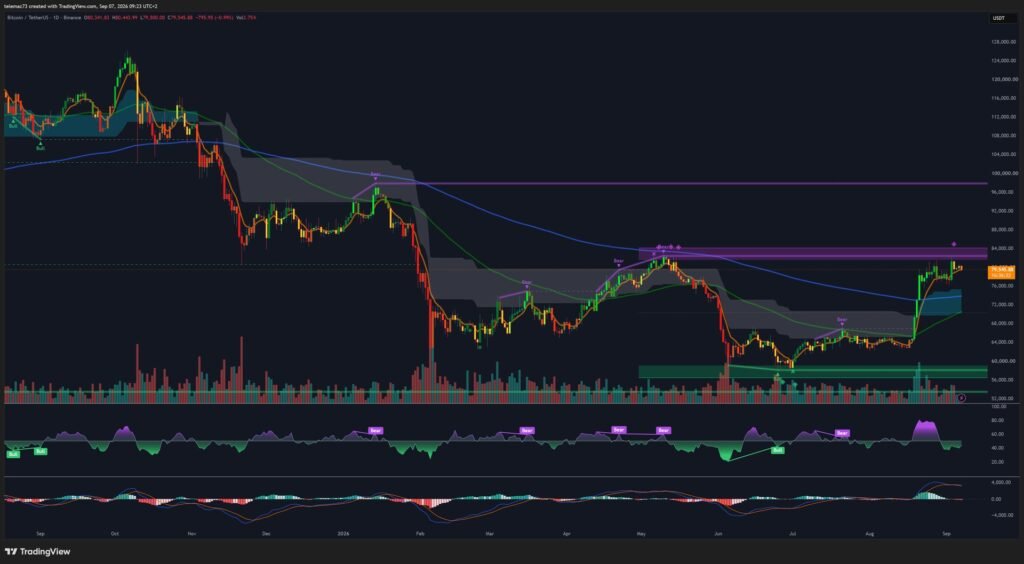
The clean break above the daily EMA200, now at $72,419, validates a technical paradigm shift: price is now trading with more than a 10% safety margin above this long-standing reference. At the same time, the rapid rise of the EMA20 ($75,260) above both the EMA50 ($70,693) and the EMA200 produced a significant Golden Cross, confirming the underlying bullish reversal.
On the oscillator side, the daily RSI reached a pronounced overbought zone during the push toward $82,300, before starting to slip below its signal line — a pullback that reflects a gradual loss of velocity without, for now, signalling a structural trend reversal. The daily MACD still holds firmly positive lines, although the contraction of its histogram to a near-neutral level highlights the temporary exhaustion of buying pressure against the upper resistance band established between $82,500 and $85,000 — a remnant of a large institutional sell-side order block.
Intermediate structure (4H): bearish divergence and decompression wedge
The 4-hour timeframe offers a more granular read of the transition between the acceleration phase and the current pause. After breaking out of a bullish continuation flag above $78,000, the market peaked at $82,281 before being rejected with notable force, leaving upper wicks of sell-side absorption.
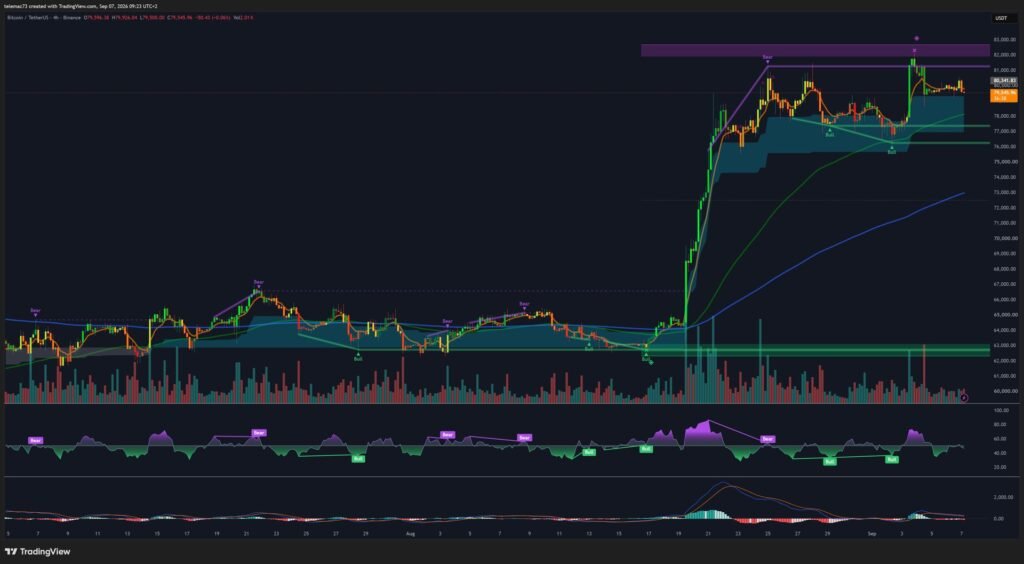
This technical rejection came alongside a classic bearish divergence on the 4-hour RSI: while price printed a higher high above the previous peak of $81,500, the RSI traced a lower high below the 70 mark, pulling the indicator back toward its neutral 50 line. At the same time, the 4H MACD lines confirmed a bearish crossover above the zero line, accompanied by the histogram flipping into negative territory.
This setup forced price into a descending consolidation wedge, bounded by lower highs under $81,000 and a firm horizontal floor at $78,500–$79,000 — a level that coincides with the dynamic support of the EMA50 on 4-hour data.
Intraday structure (15m): volatility break and bearish flag drift
On the 15-minute intraday scale, the bearish impulse triggered by the macro announcements broke local supports with marked velocity, driving price from $81,200 down to a temporary capitulation low between $78,800 and $79,200.
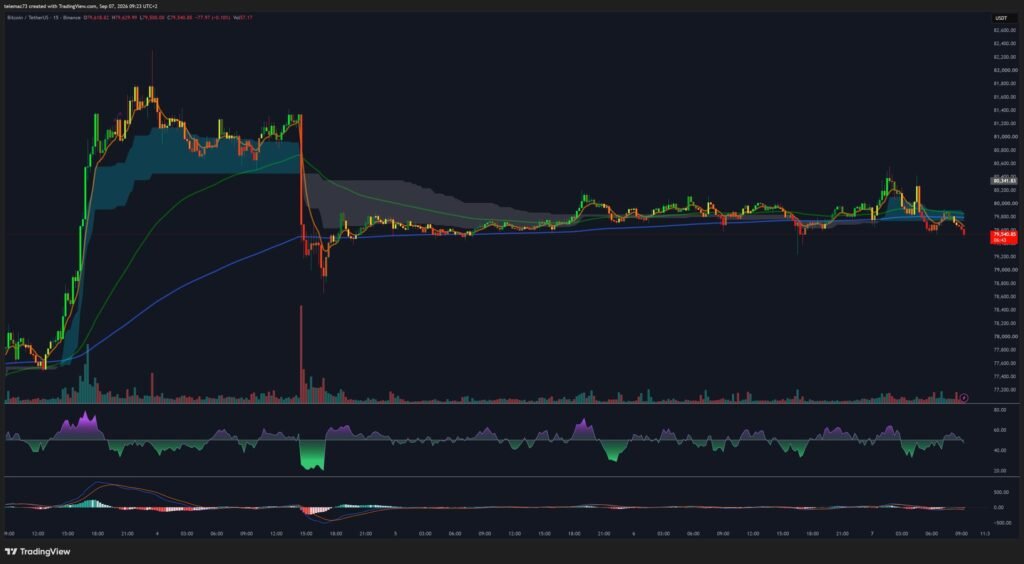
Following this rapid liquidation, price settled into a very tight horizontal channel oscillating between $79,400 and $80,100, shaping a potential bear flag sustained by the thin volumes typical of North American holidays. An intraday Death Cross of short moving averages under the intermediate ones occurred during the drop, turning the $79,850–$80,150 zone into immediate dynamic resistance. The 15-minute RSI, after tagging oversold lows below the 25 mark, is attempting a precarious stabilization around 45 to 50, while the MACD lines flatten against the neutral line, illustrating a full neutralization of the order book as it awaits new directional catalysts.
| Timeframe | Trend status | RSI | MACD | Key moving averages |
|---|---|---|---|---|
| Daily (1D) | Confirmed uptrend | Overbought and cooling, below its signal line | Positive lines, decelerating histogram | Price > EMA20 ($75,260) > EMA200 ($72,419) |
| 4-Hour (4H) | Corrective consolidation | 50.00 — confirmed bearish divergence | Bearish crossover below signal, red histogram | Dynamic support EMA50 (4H) at $78,800 |
| 15-Minute (15m) | Bearish sideways compression | 48.50 — technical bounce capped below 50 | Flat oscillation on the zero line, zero momentum | Dynamic resistance EMA20/50 (15m) at $79,950 |
Microstructure and liquidity mapping
Reading the order book liquidity heatmap sheds light on how institutional participants are positioning their limit-order blocks and helps identify the critical absorption zones.
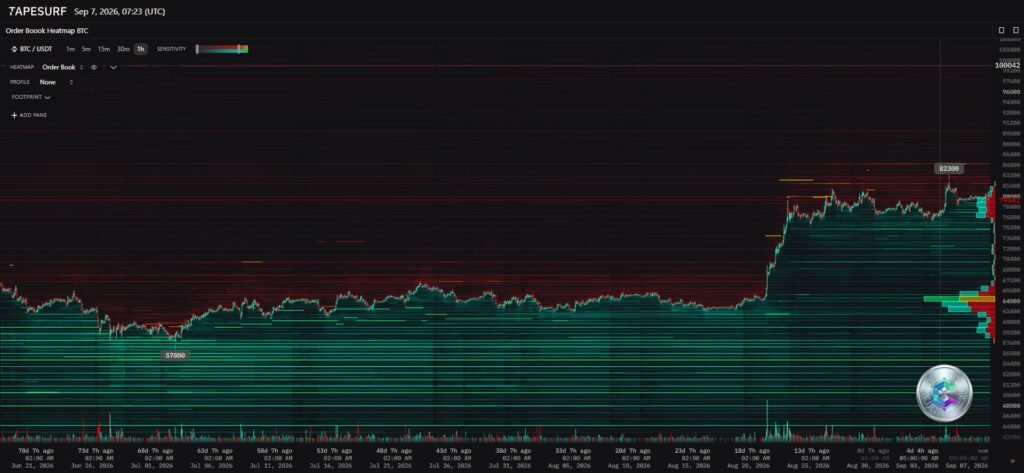
Above current prices, a dense sell wall stretches between $82,300 and $83,000. This level matches exactly the zone where market buy flow was absorbed during the failed bullish extension, triggering the local trend reversal. Higher up, a second massive cluster of resting sell limit orders sits between $84,800 and $85,000, forming a liquidity wall that market makers will need to target if the uptrend resumes with fresh capital support.
On the downside, the heatmap highlights a significant build-up of passive buy orders in the $78,500 to $79,000 range. This order cluster acted as a shock absorber during the post-macro-data purge. Below this first line of defense, however, lies a relatively illiquid zone that could accelerate a price slide in the event of a confirmed break. The next substantial wall of buy orders does not appear until the $75,000–$75,500 range, a perfect confluence with the daily EMA20 ($75,260).
The horizontal Volume Profile confirms that the $79,500–$80,200 interval is a High Volume Node (HVN), currently accepted by market consensus as a temporary fair-value zone, where significant portfolio rotations take place before a supply/demand imbalance forces a new directional expansion phase.
Fundamentals, derivatives and the macro catalyst calendar
Bitcoin’s technical behaviour sits within a rapidly shifting macroeconomic environment, where the asset’s sensitivity to global financial conditions has reached historic levels. The September 4 US jobs report (NFP) was a genuine exogenous shock: while consensus expected roughly 53,000 to 55,000 new jobs, the official print came in at 162,000, with unemployment holding steady at 4.1%. This unexpected labour-market strength instantly invalidated the assumption of a Federal Reserve forced to ease policy without delay.
Market expectations tracked by CME FedWatch shifted within hours, moving toward a target range of 3.75% to 4.00%. This repricing pushed the 10-year Treasury yield up to 4.789% and strengthened the US dollar, with the DXY index climbing to 99.157. For Bitcoin — a long-duration asset highly sensitive to global liquidity — this tightening triggered an immediate drop and a sharp decline in daily net flows into spot ETFs, falling from $730 million to $174.6 million.
In derivatives markets, a structural anomaly also emerged: open interest on altcoin perpetual futures exceeded that of Bitcoin for the first time since late 2024. This points to excessive speculative leverage building up on peripheral assets, evidenced by extreme volatility episodes such as the Zcash short squeeze, which triggered more than $212 million in global liquidations. Historically, such overheating in secondary derivatives regularly precedes systemic deleveraging purges whose contagion temporarily affects Bitcoin’s support levels.
These macroeconomic and structural tensions converge on a calendar of major events during the second week of September, which will set the underlying trend for the rest of the year.
| Date | Strategic event | Consensus / expected outcome | Expected impact on Bitcoin’s structure |
|---|---|---|---|
| Wednesday, September 10 | ECB monetary decision | 25 bps hike (deposit rate raised to 2.50%) | Adjustment of the EUR/USD pair with an indirect ripple effect on global financial conditions. |
| Thursday, September 11 | US CPI inflation | Headline and core inflation projected at +0.3% m/m | Major catalyst #1: a 0.2% print would revive rate-pause expectations (bullish for BTC); a 0.4% print would lock in the Fed’s hawkish scenario. |
| Monday, September 15 | Cloture vote on the CLARITY Act (US Senate) | Procedural motion on H.R. 3633 (60-vote threshold required; probability estimated at roughly 15%) | An expected failure is already priced in. A surprise pass would trigger a powerful bullish impulse via CFTC/SEC clarification. |
| Wednesday, September 16 | FOMC decision and Dot Plot | Uncertain policy call and new economic projections | Major catalyst #2: a surprise Fed hold would spark a powerful short squeeze; a hike paired with hawkish rhetoric would test deeper support levels. |
Institutional levels and evolution scenarios
Mapping the technical tiers
Confluences between chart structure, moving averages and order book depth allow the operational tiers framing the asset to be formalized.
| Technical designation | Price level (USDT) | Confluences and technical rationale |
|---|---|---|
| Major Resistance 2 (R2) | $84,500 – $85,000 | Upper bound of macro distribution, Fibonacci extensions, sell-side liquidity pole |
| Major Resistance 1 (R1) | $82,300 – $82,500 | Local rejection high, 4H RSI divergence zone, dense ask-order wall |
| Central intraday pivot | $80,000 – $80,500 | Major psychological threshold, volume equilibrium zone (HVN), upper bound of the 15m range |
| Major Support 1 (S1) | $78,500 – $79,000 | Post-NFP consolidation low, EMA50 (4H) support, first bid barrier |
| Major Support 2 (S2) | $75,000 – $75,260 | Daily EMA20, former reversal peak, institutional order concentration |
| Structural floor (S3) | $72,400 – $72,500 | Daily EMA200, absolute boundary for neutralizing the macro uptrend |
Strategic trajectories
Two main scenarios emerge from this technical and macroeconomic setup, depending on buyers’ ability to defend the immediate floor zone.
Primary scenario — accumulation and bullish continuation (estimated probability: 55%). Buyers successfully absorb the residual supply in the $78,500–$79,000 support zone throughout the low-liquidity period. The exhaustion of selling momentum shows up as tightening price action and a reclaim of the 15-minute moving averages above $79,900. Confirmation of this path comes through a convincing 4-hour close beyond the $80,500 pivot, neutralizing the intraday bear flag. Price is then pulled back toward the $82,300 liquidity pool. If the September 11 US CPI print confirms an inflation slowdown to 0.2% or below, short-covering could absorb the sell wall and push price toward the $85,000 target.
Secondary scenario — breakdown and deleveraging purge (estimated probability: 45%). This scenario would take shape upon a confirmed break of the $78,500 floor. Such a breakdown would definitively validate the bearish divergence observed on the 4-hour RSI as well as the MACD’s bearish crossover, triggering automatic stop-loss orders on speculative long positions entered above $80,000. Given the thin order-book density between $76,000 and $78,500, the pullback would take the form of a fast slide toward the institutional confluence pole of the daily EMA20, at $75,260. This 5% to 6% corrective move relative to current levels would not challenge the underlying uptrend but would represent a healthy technical rebalancing. Structural invalidation of the bull cycle would only be triggered by a clean, confirmed daily close below the daily EMA200 ($72,419) — an extreme scenario that would require persistent inflation overheating combined with an aggressive Fed policy stance.
Operational conclusions
Bitcoin is moving through a classic technical digestion phase following a sharp bullish acceleration, framed by major order-book resistance at $82,300–$83,000 and immediate support at $78,500–$79,000. While the daily framework retains a structurally favourable bias underpinned by a Golden Cross and a comfortable position above the EMA200, the intraday timeframes (4H and 15m) demand discipline due to degraded momentum signals and an unstable macroeconomic backdrop.
Tactically, price remains confined within the corridor bounded by $78,500 and $80,500. Aggressive directional positioning offers a poor risk/reward ratio until one of these two boundaries is broken with volume confirmation. The decisive macroeconomic sequence beginning September 11 with US inflation data will supply the liquidity and directional conviction needed to release price from this compression.
⚠️ Disclaimer: This article is intended strictly for educational and informational purposes. It does not constitute investment advice, a recommendation to buy or sell, or an inducement to take any position in the financial markets. Cryptocurrencies are highly volatile and speculative assets. Always do your own research (DYOR) and consult a licensed financial advisor before making any investment decision.

