


In August 2026, Bitcoin is going through a critical consolidation phase, caught between macroeconomic headwinds and structural resilience driven by institutional adoption. The asset is trading in a tight, nervous range between $62,000 and $65,000 — roughly half of its all-time high of $126,198.07 reached on October 6, 2025 — a drawdown of more than 43% over the year that marks the shift from an euphoric price-discovery phase to a maturing accumulation-and-distribution cycle.
This analysis blends the major macroeconomic and geopolitical drivers of the moment with an in-depth technical and quantitative reading, based on institutional liquidity mapping (the order-book Heatmap) and a multi-timeframe breakdown of price action across the daily, 4-hour and 15-minute charts. The conclusion is unambiguous: the market sits in a zone of maximum compression, waiting for an external catalyst to dictate its next directional move.
A macroeconomic backdrop under high tension
Bitcoin’s price action never forms in a vacuum. Ongoing geopolitical negotiations around Iran and the Strait of Hormuz are among the main exogenous drivers of current volatility: the prospect of de-escalation pushed oil futures down more than 4%, mechanically easing fears of imported inflation in the United States. At the same time, the ISM Manufacturing PMI climbed to 55.6, its highest level since 2022, propelling the S&P 500 to a record $70 trillion market cap and giving Bitcoin a broadly favorable risk-appetite backdrop to defend the $64,000 zone.
These supportive factors are counterbalanced by expectations around Federal Reserve policy. A weaker-than-expected ADP employment report for July reduced the odds of another rate hike — a setup theoretically favorable to non-yielding assets like Bitcoin or gold. Yet elevated US Treasury yields and a strong dollar continue to cap any attempt at a parabolic move.
The most destabilizing element of this cycle remains Asian currency dynamics. The sharp appreciation of the Japanese yen, backed by an estimated $59 billion monetary intervention, triggered an accelerated unwind of yen carry trades: institutions that borrowed heavily in yen at near-zero rates to reinvest in higher-yielding assets — Bitcoin and Ethereum included — are now forced to liquidate positions to cover their currency debts. Recent history shows that two of Bitcoin’s three major corrections in 2026 occurred during similar episodes of sharp yen strengthening, underlining the cryptocurrency’s heavy dependence on global liquidity conditions.
Institutions vs. retail: two diverging behaviors
The market reveals a striking divide between the strategic behavior of large institutional players and the psychological capitulation of retail investors.
| Market participant | Observed behavior | Impact on price structure |
|---|---|---|
| US Spot ETFs | Methodical accumulation: over $745 million in net inflows across four consecutive sessions, and $172.4 million in net inflows for July alone. | Structural floor between $62,000 and $63,000; over 155,000 BTC accumulated in this zone. |
| Corporate treasuries (“Strategy”) | Profit-taking: liquidation of 1,638 BTC for $104.7 million, alongside a $290.6 million equity raise. | Targeted selling pressure above $63,000, capping upside breakout potential. |
| Retail investors | Apathy and withdrawal: interest at multi-year lows, Fear & Greed Index stuck between 35 and 38. | Spot demand deficit, absence of organic momentum. |
Compounding retail hesitancy is a confidence crisis around self-custody security: the discovery of a critical flaw in Canadian firm Coinkite’s Coldcard hardware wallets led to the fraudulent exfiltration of over 1,755 BTC, roughly $110 million in user losses. This incident, affecting a device long considered one of the industry’s most tamper-proof, discourages new retail capital inflows and pushes some holders toward centralized custody solutions.
Open interest on futures contracts confirms this broad caution, retreating from a peak of 776,000 BTC in early July to roughly 740,000 BTC in August. Seasonality doesn’t help either: historically, August posts an average 4.3% decline for Bitcoin, with the notable exception of the hyper-monetary-expansion years of 2020–2021.
The rest of the market follows an erratic pattern: Ethereum, despite $365 million in ETF inflows in July, struggles to durably clear $1,950. While BNB, Solana, Tron and Dogecoin post speculative rebounds of up to 25% on the week, XRP, Cardano and Hyperliquid shed 1–3% — a sign of sector rotation rather than a genuinely synchronized bull run.
Market microstructure: what the order-book Heatmap reveals
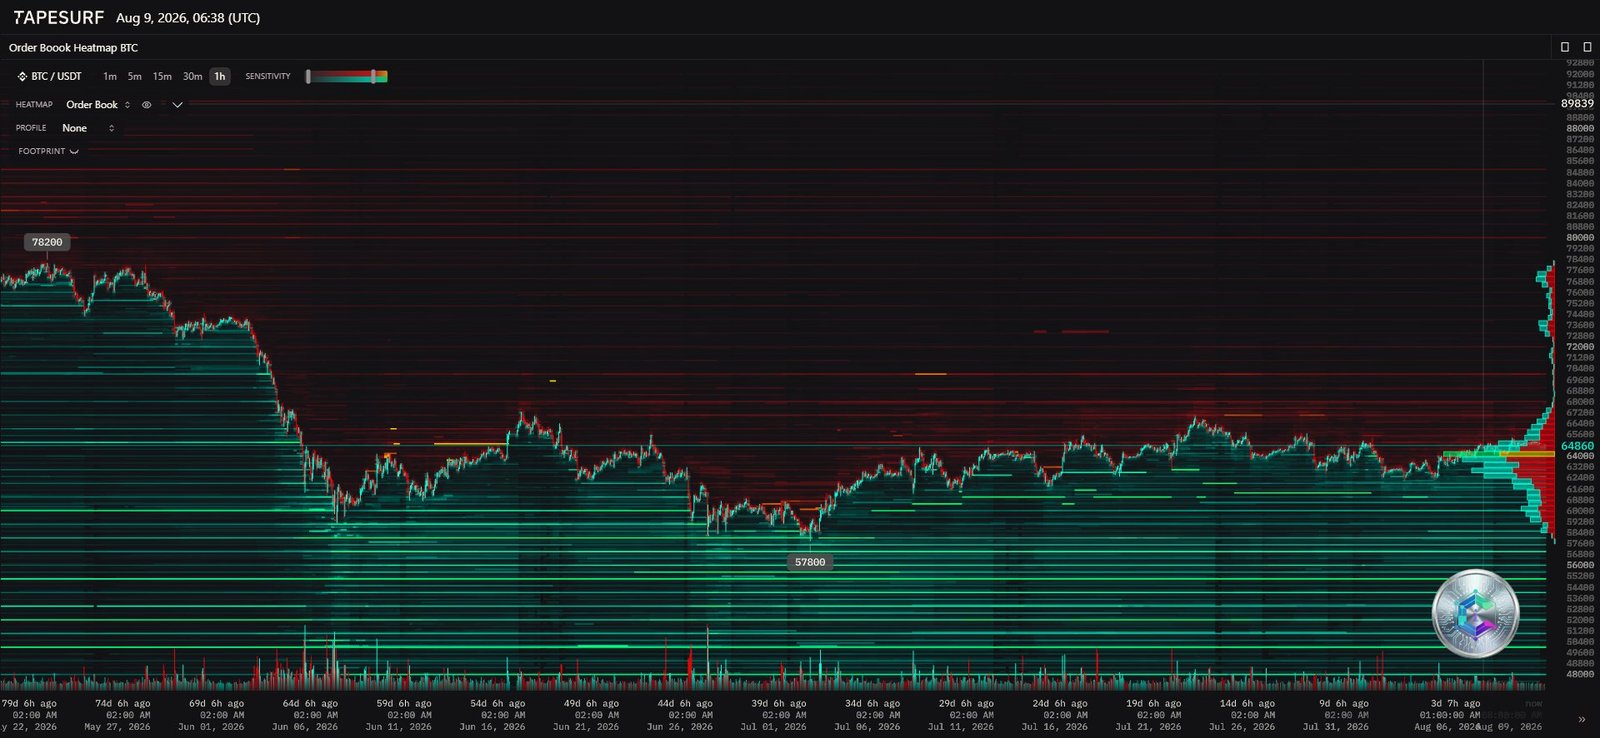
The liquidity map (a Tapesurf capture on the Binance BTC/USDT pair) offers an X-ray of market intentions around the spot price, which sat near $64,860 at the time of the snapshot. Above the price, a genuine glass ceiling appears: a massive concentration of sell orders thickens across the $65,000–$65,600 corridor, reflecting both algorithmic profit-taking and institutional short positioning. A sustained break of this zone is considered essential for any hope of bullish continuation.
Below the price, a robust support floor emerges: a dense absorption block sits around $62,000, consistent with the 155,000 BTC accumulated by ETFs in that range. Deeper in the book, a historic concentration of buy orders clusters around $57,889 — the ultimate support of the current structure. The convergence of buy and sell liquidity bands toward the spot price illustrates severe compression: the market critically lacks the market orders needed to consume these walls, foreshadowing a volatility shock once local liquidity is exhausted on either side.
Multi-timeframe technical analysis: a top-down approach
Daily chart: the underlying trend remains bearish
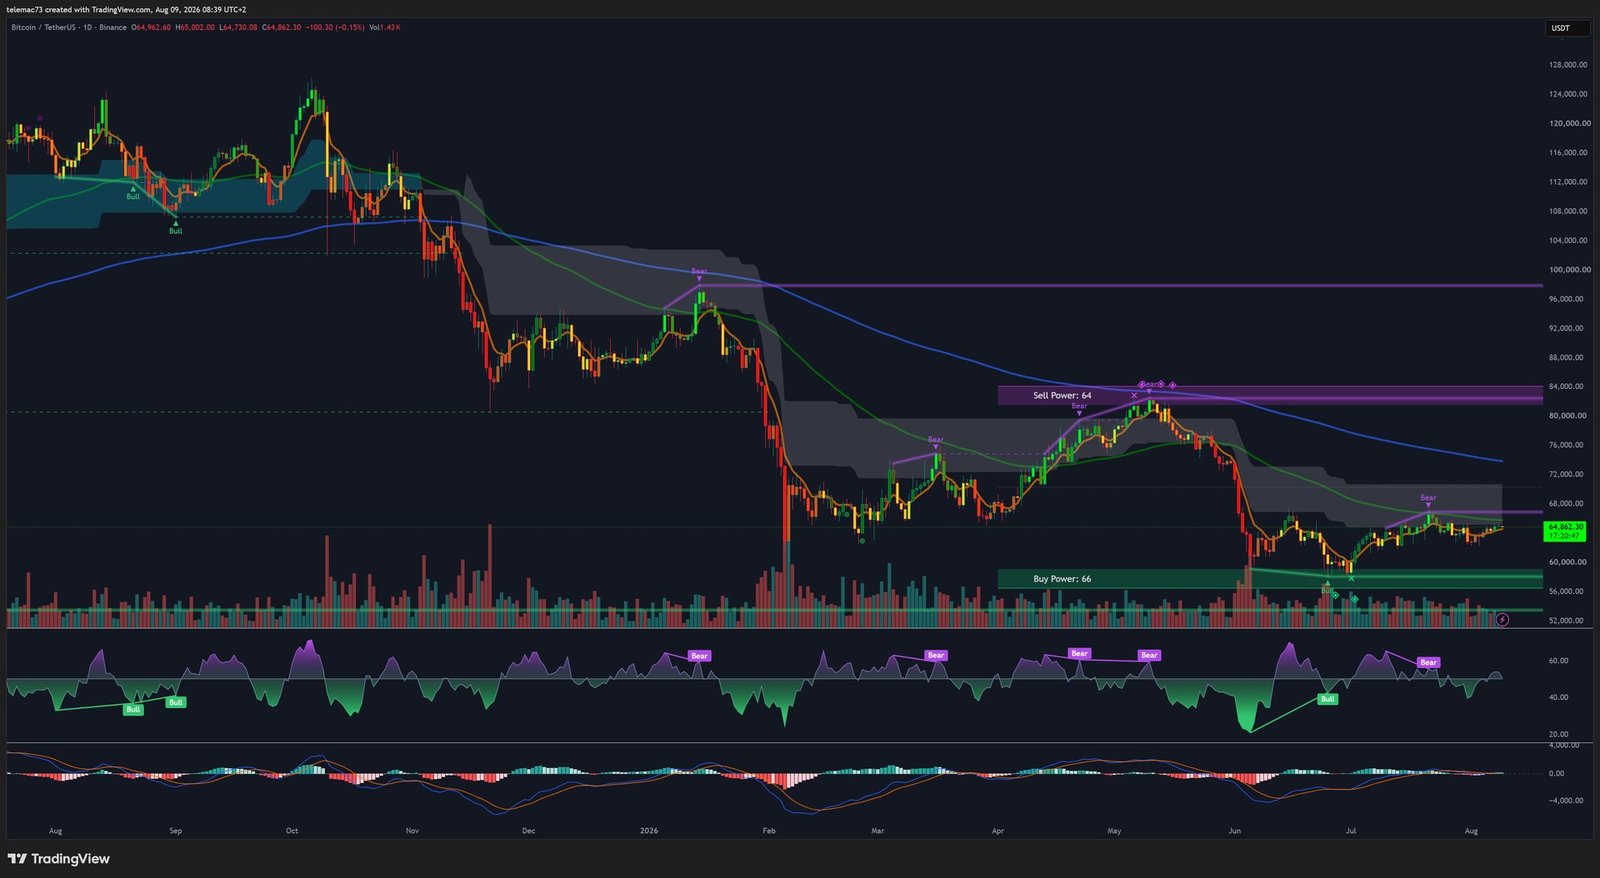
On the daily scale, price action traces a long descending channel since the loss of the 2025 all-time high. The repeated failure to print higher highs confirms sellers’ grip on the underlying trend. Price sits just below the 200-period EMA, the market’s most feared dynamic resistance, and a macro Death Cross has confirmed a distribution regime for several months. The daily RSI oscillates indecisively between 40 and 50, showing no extreme oversold or overbought signal, while the MACD remains stuck in negative territory — the slight histogram contraction looks more like a technical relief rally than a genuine reversal. The “Buy Power” zone spans $58,000 to $62,000, while the “Sell Power” zone starts at $65,000. Reclaiming $84,000 would be needed to formally invalidate the bearish thesis; conversely, losing $58,000 would open the door toward $47,000–$50,000.
4-hour chart: a compression triangle under strain
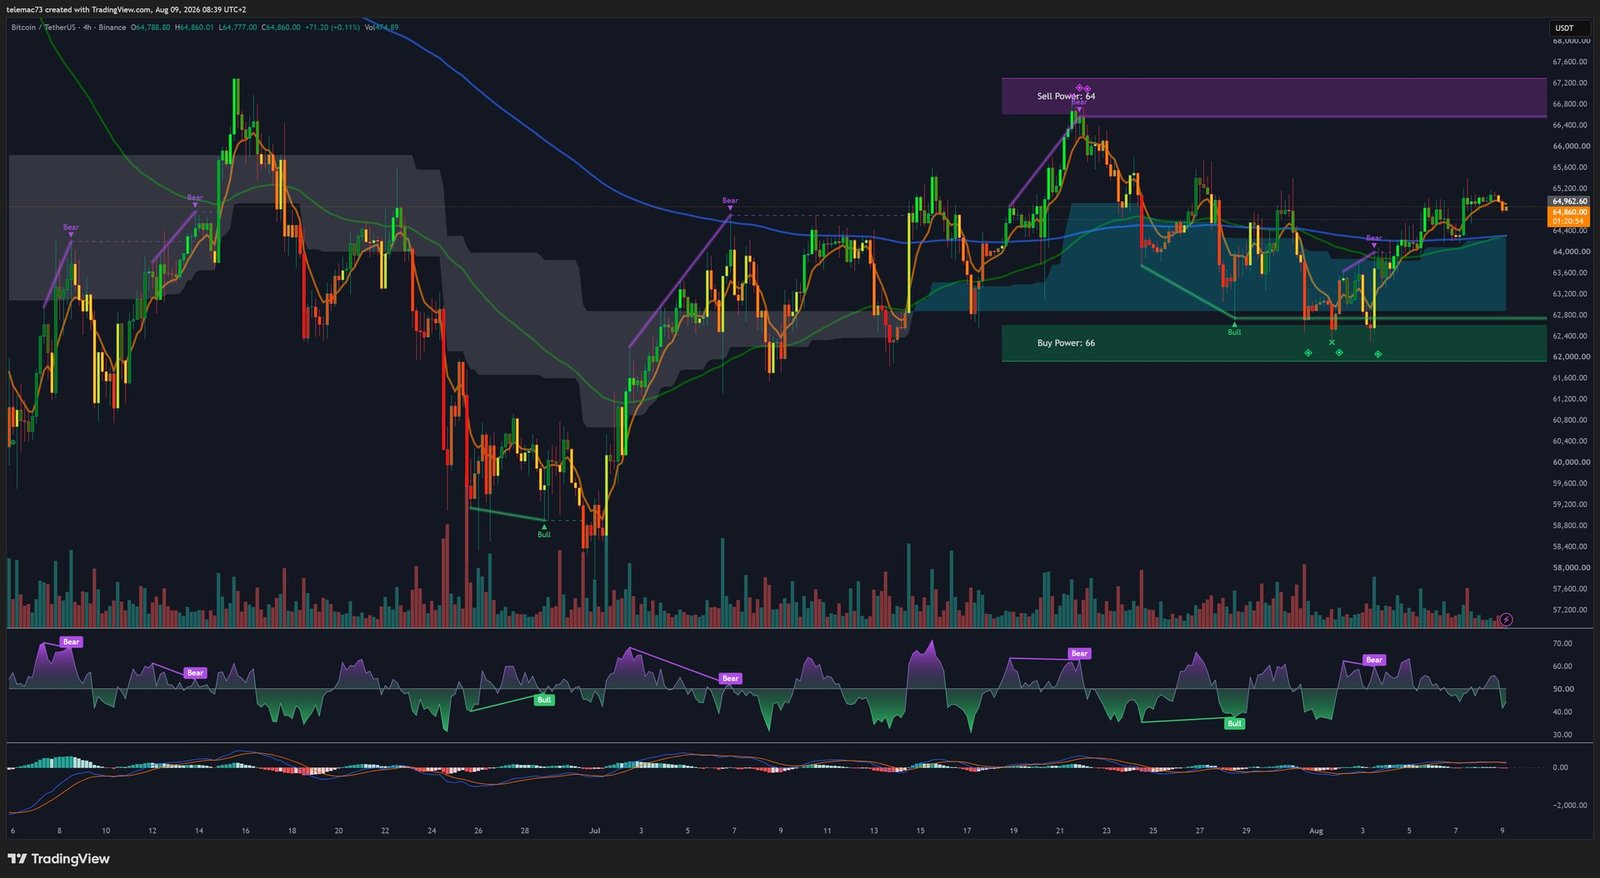
On the 4-hour timeframe, the structure reveals an Ascending Compression Triangle: since bouncing off the $62,200 demand zone, the market has built a series of higher lows that keep hitting the horizontal $65,000 wall. Consolidation phases resemble minor bull flags, suggesting participants treat every pullback as an accumulation opportunity. A local Golden Cross is confirmed and the MACD has crossed above the zero line — but warning signs are emerging: the RSI briefly broke above 70 before retreating while printing a hidden bearish divergence, a symptom of fading buying strength. The MACD histogram is flattening, threatening a Death Cross if price fails to break out of its compression to the upside.
15-minute chart: the intraday algorithmic battle
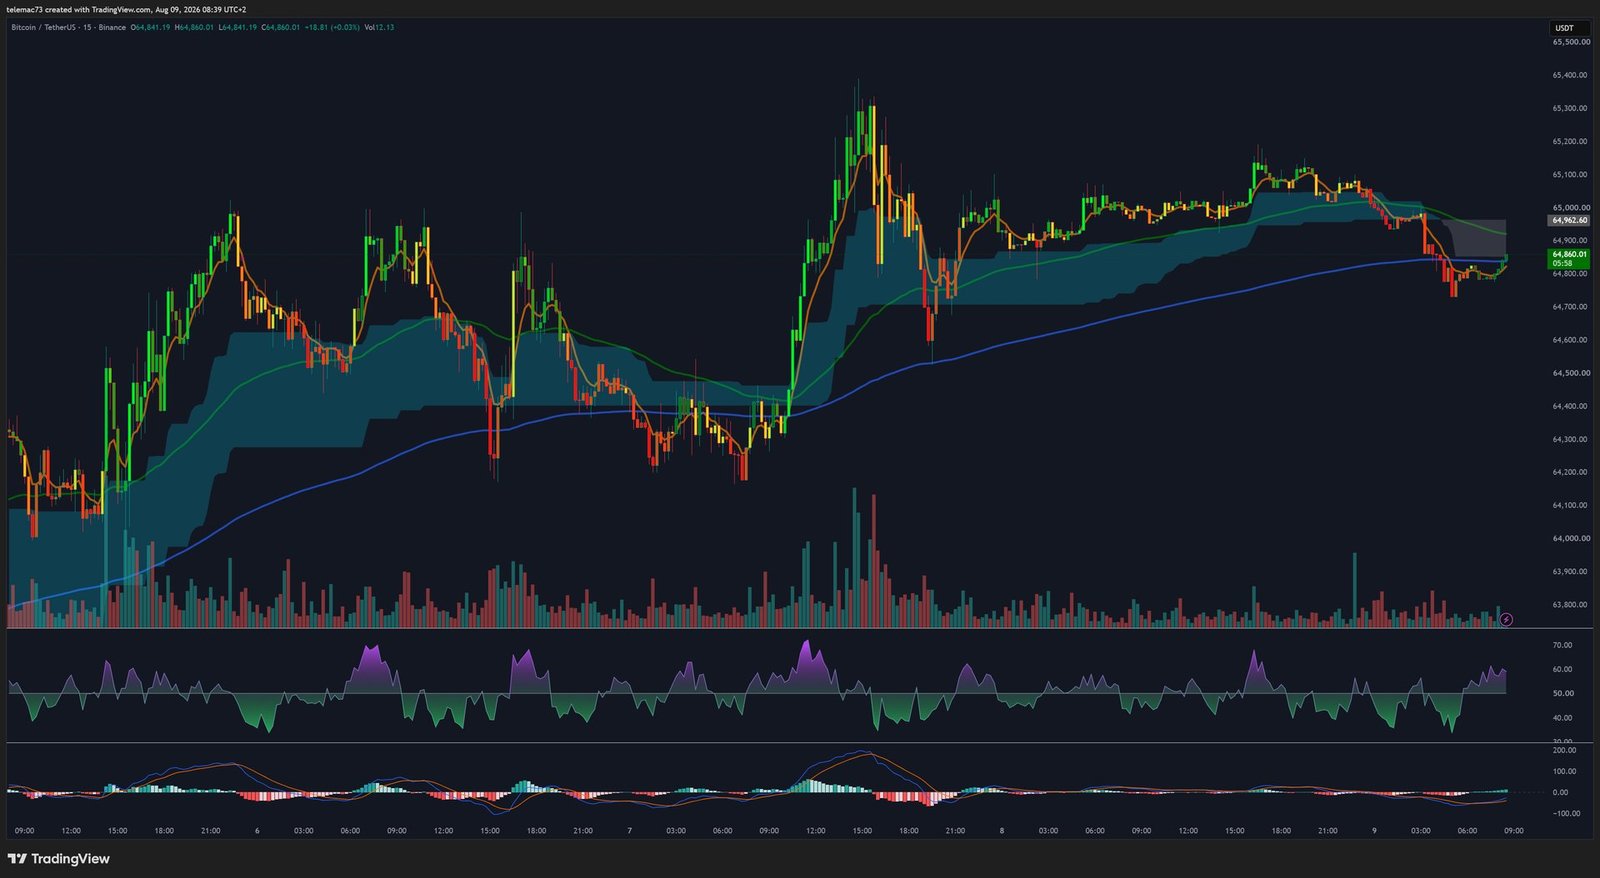
On the very short term, price action moves chaotically within a narrow channel. The $64,250 level stands out as the absolute intraday pivot: holding above it lets buy-side algorithms organize fresh pushes toward $64,400, while a confirmed break below would trigger cascading stop-loss orders. The RSI swings violently between extreme overbought (above 75) and deep oversold (near 30) readings, reflecting the lack of clear direction typical of a market dominated by mean-reversion strategies. The 15-minute MACD has confirmed a clean Death Cross, marking the loss of momentum following the technical rejection at $64,960.
Key price-level matrix
| Level | Classification | Implication |
|---|---|---|
| $84,000 | Ultimate macro resistance | Reclaiming it would definitively invalidate the descending-channel bearish thesis. |
| $67,000 | Secondary liquidity resistance | Next target in the event of a short squeeze. |
| $65,000 – $65,600 | Glass ceiling / major resistance | Critical confluence; the market’s dividing line. |
| $64,250 | Intraday pivot (M15/H1) | Its preservation is required for the local bullish structure. |
| $63,000 | Intermediate support | Backed by ETF flows and open interest. |
| $62,200 | Major structural support | Starting point of the H4 compression triangle. |
| $57,800 | Macro foundation | Last line of defense before a systemic capitulation. |
| $47,000 – $50,000 | Bearish capitulation target | Scenario if the $58,000 support disintegrates. |
Two scenarios out of the compression
Bullish breakout scenario: a clean break, backed by exceptional volume, above the $65,000–$65,600 confluence would trigger a mechanical short squeeze and push price toward the upper liquidity pool at $67,000. Holding the $64,250 pivot is the necessary condition to kick off this move.
Bearish rejection scenario: statistically dominant given August’s seasonal weakness and the daily chart’s bearish structure, this scenario would see price pierce minor supports to test $62,200, then the historic buy wall at $57,800. Losing this last line of defense would open the way toward the $47,000–$50,000 zone.
Bitcoin is locked in a pathologically compressed volatility regime, torn between hopes of an accommodative Fed pivot and steady Spot ETF inflows on one side, and draining global liquidity via the Japanese carry-trade unwind, corporate treasury profit-taking, and the post-Coldcard confidence crisis on the other. The market now needs a disproportionately large external catalyst to break the fragile equilibrium confined between $63,000 and $65,000.
Disclaimer: This article is published for educational and informational purposes only. It does not constitute investment advice or a solicitation to buy or sell digital assets. Cryptocurrency markets are highly volatile; always do your own research (DYOR) and consult a qualified financial advisor before making any investment decision.

