


On July 28, 2026, Bitcoin is trading inside a compression zone rarely seen since the start of the year: squeezed between a massive institutional sell wall and a critical liquidity floor, the leading crypto asset appears to be holding its breath ahead of a major directional move. This full technical and structural breakdown, crossing timeframes from 15 minutes up to the daily chart alongside an order book liquidity map, offers a precise picture of the forces at play.
A Market Shaped by Two Years of Macro Turmoil
To understand Bitcoin’s current setup around $63,537, it helps to revisit the forces that have shaped this market since late 2024. A leadership change at the SEC in late 2024, followed by a friendlier regulatory posture under the new US administration, initially propelled digital assets to unprecedented highs. Bitcoin went on to print an all-time high of $126,198 in October 2025, fueled in part by massive corporate accumulation.
That euphoria was soon met by severe macroeconomic shocks: aggressive tariff policies reignited inflation fears and triggered a broad deleveraging across risk assets. ETF outflows amplified the downside moves, exposing the fragility of a market now dominated by institutional leverage. Since then, Bitcoin has been navigating a complex phase of contraction and consolidation.
Mapping Liquidity: Two Walls Framing the Market
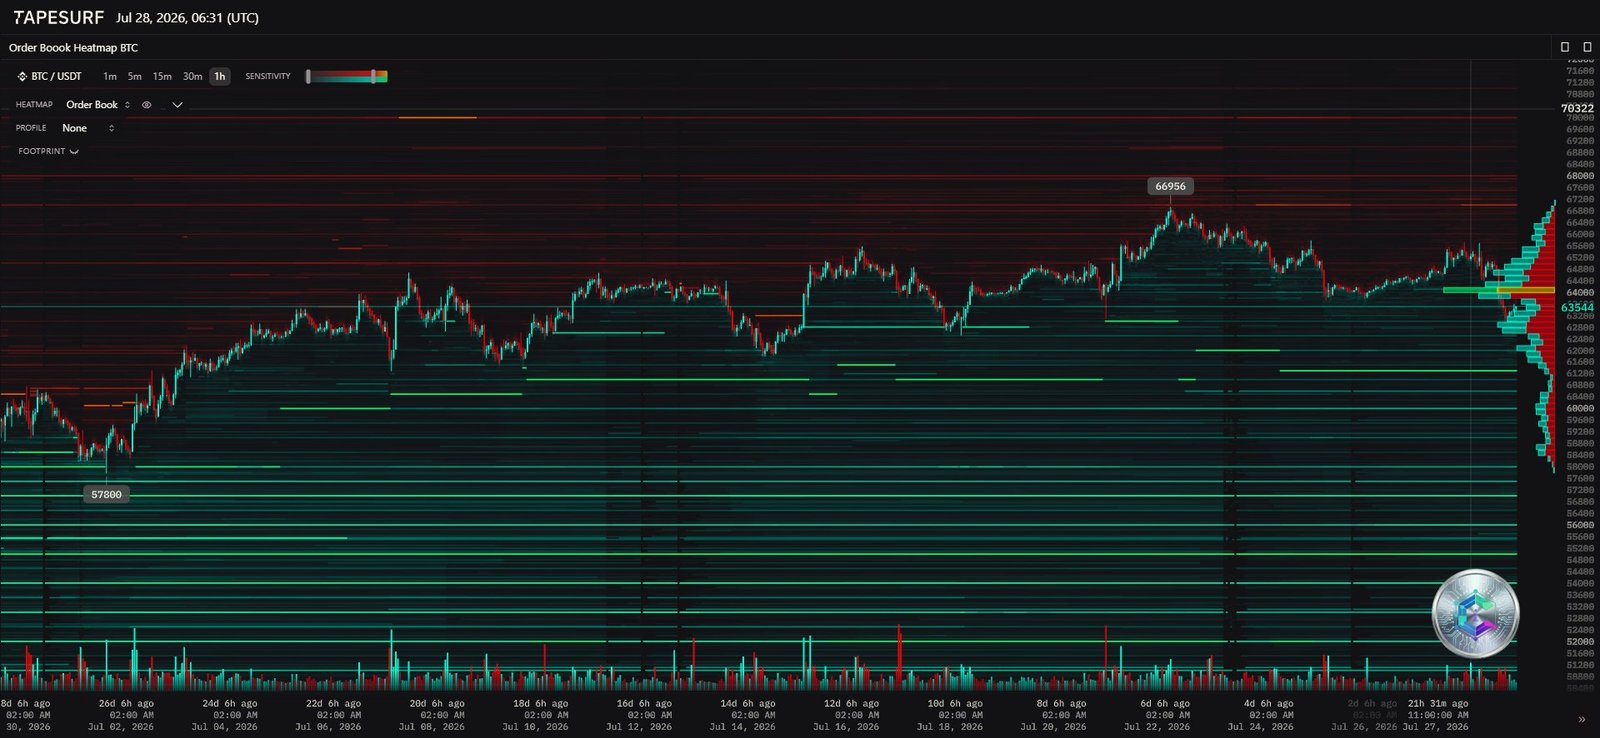
The order book heatmap reveals two strategic zones bracketing price action. Above, a dense sell wall sits around $66,956, extending up toward the psychological $70,000 threshold. This laddered sell-side liquidity acts as a lid: every bullish push has to absorb substantial passive supply to have any chance of breaking through.
On the downside, a critical support floor takes shape around $57,800, where clustered buy orders act as a safety net for the market. Between these two boundaries, price is currently sitting in an equilibrium zone, with the Point of Control on the volume profile landing right inside this consolidation pocket — a sign that the market currently views this area as a short-term fair value zone.
The Long-Term View: A Downtrend Still in Control
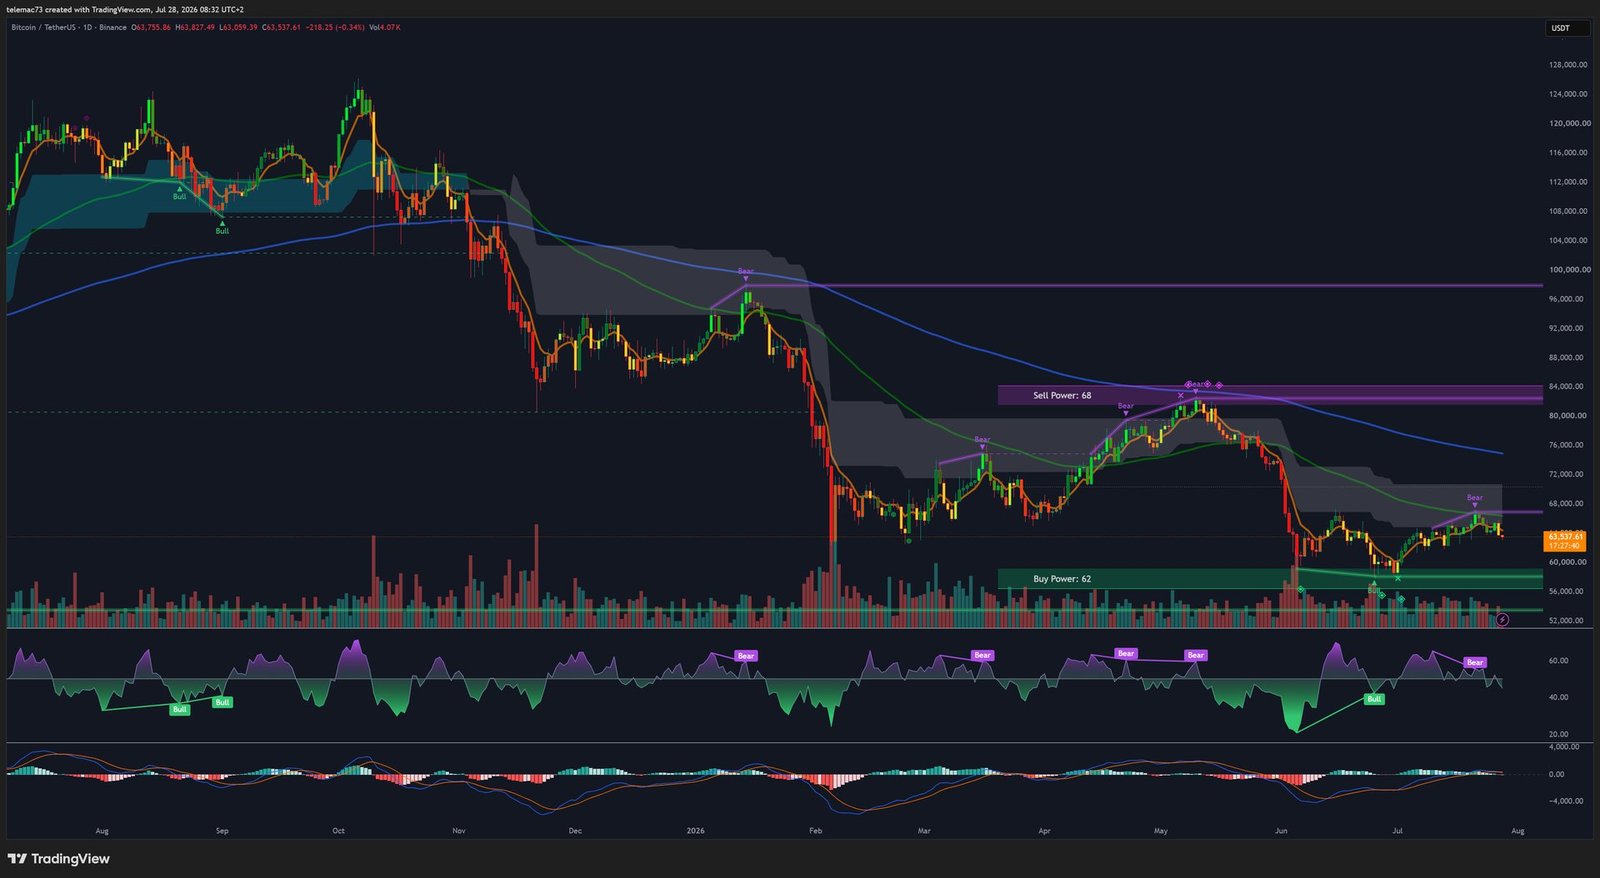
The daily chart confirms a severe macro downtrend since the October 2025 top, marked by an uninterrupted sequence of lower highs and lower lows. Price is currently locked inside a wide consolidation channel, caught between resistance near $68,000 and an accumulation zone near $61,000. A confirmed daily close beyond either boundary is likely to dictate the next major trend.
Price remains below its long-term moving average, a textbook bear-market configuration following an earlier death cross this year. The RSI, having escaped extreme oversold territory, now oscillates in a low neutral zone (40-45) without a clear bullish divergence. The MACD confirms this lack of decisive buying momentum, though selling pressure does appear to be easing somewhat.
The Medium-Term View (4H): Volatility Compression
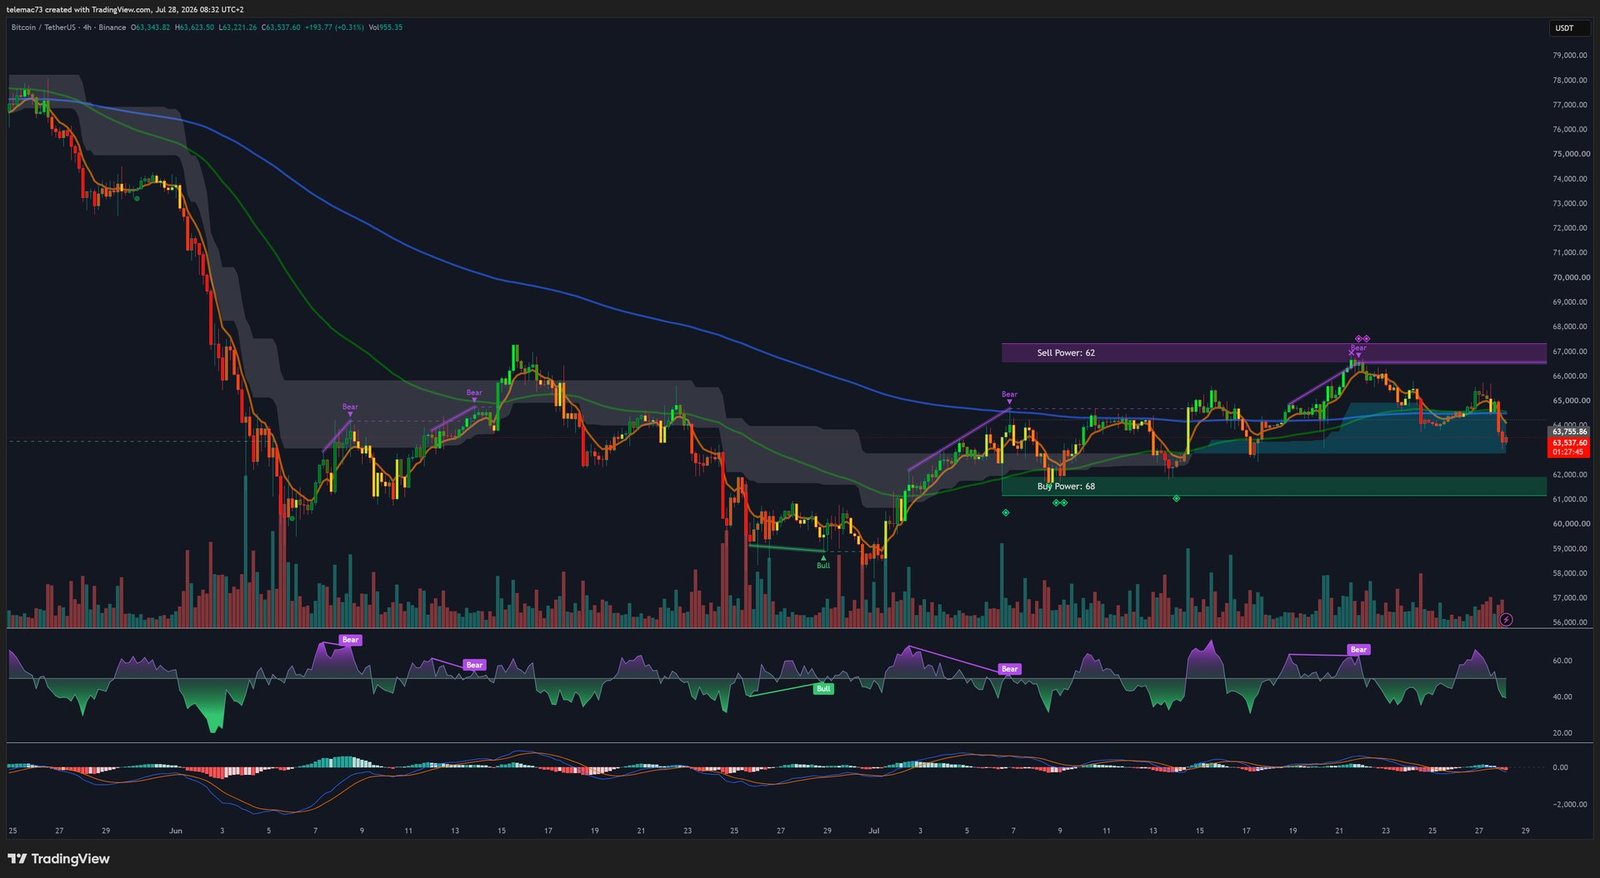
On the 4-hour timeframe, the structure resembles a compression triangle, or arguably a large bear flag. After a capitulation move that tested the $53,000-$54,000 zone, price staged a V-shaped recovery before once again slamming into the institutional ceiling near $67,000. The buy zone around $61,000 continues to act as a reliable springboard for buyers, with every dip into it followed by a bounce.
The 4H RSI, below the neutral 50 level, confirms mild seller control at the medium-term horizon, while the MACD shows a recent bearish crossover — though the histogram is starting to flatten on the latest candles, hinting at possible exhaustion of local selling pressure. This kind of setup often precedes fakeouts at range boundaries.
The Short-Term View (15m): Tactical Signals
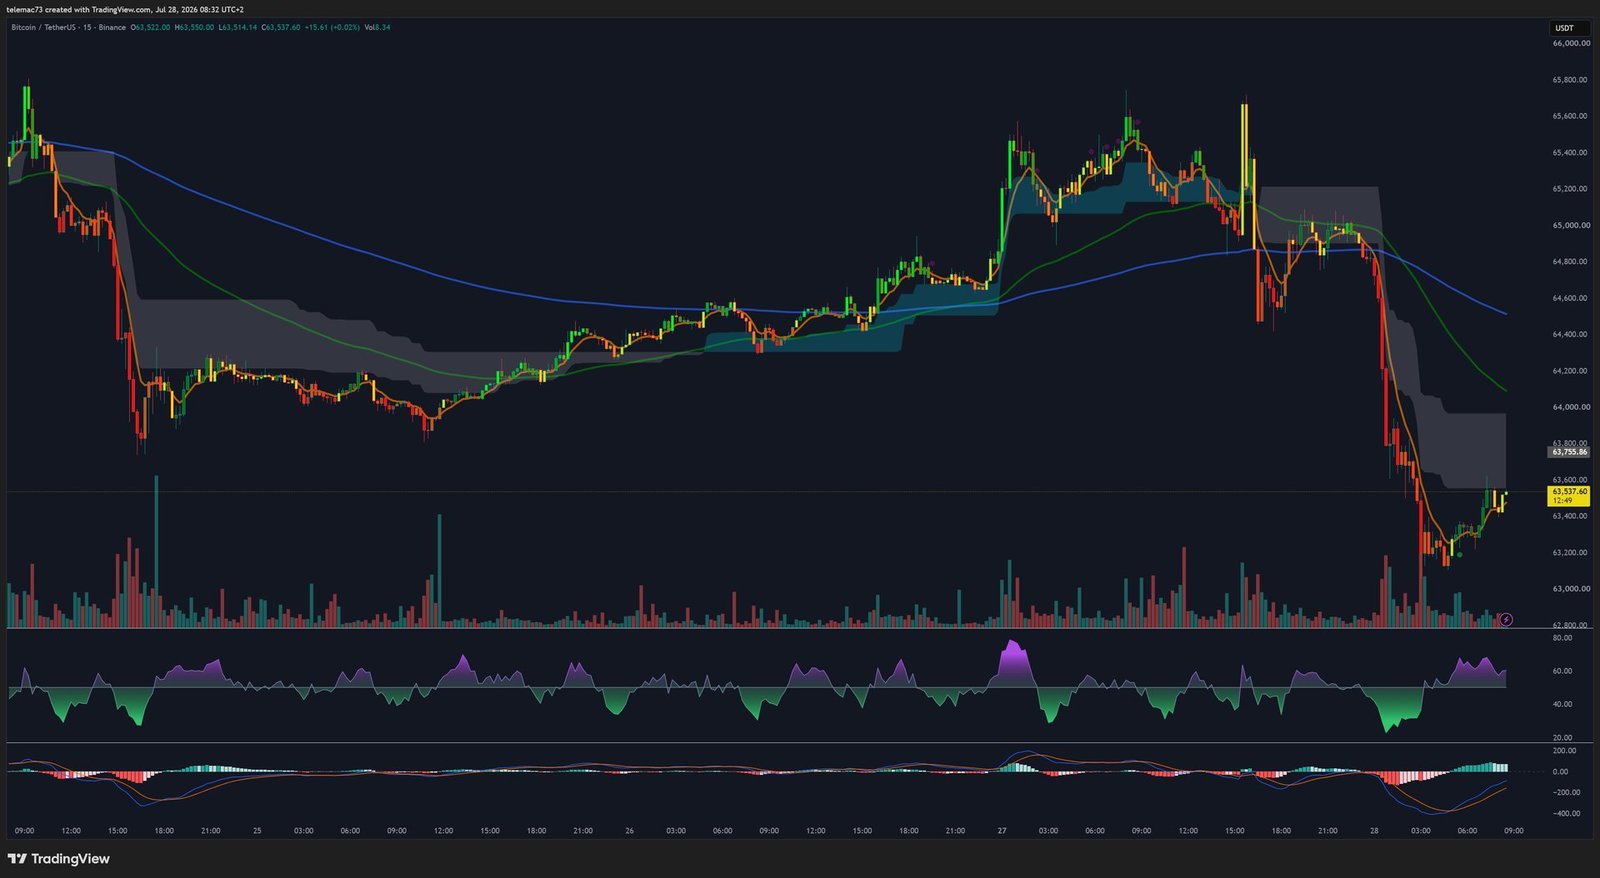
The 15-minute chart exposes a recent aggressive selloff, with a series of long red candles reflecting a lack of buy-side liquidity able to absorb the incoming sell flow. Price pierced through several intraday supports before stabilizing around $63,537, forming a textbook bear flag on this timeframe. Should the pattern play out, a continuation toward the $61,000 zone is plausible.
The RSI, having plunged deep into oversold territory during the drop, is now curling back upward, signaling exhaustion of the immediate selling pressure. The MACD shows a clear deceleration of its red histogram, a first step ahead of a possible short-term bullish crossover — though this doesn’t guarantee a broader trend reversal.
Key Levels to Watch
| Level | Type | Significance |
|---|---|---|
| $63,200 | Intraday support | First tactical line of defense (15m) |
| $61,000 | Medium-term support | Major accumulation zone (4H / Daily) |
| $57,800 | Major support | Liquidity floor (Heatmap) |
| $53,000 | Macro swing low | Historical capitulation low |
| $65,000 | Dynamic resistance | Former support turned resistance |
| $66,956 | Sell wall | Massive concentration of sell orders |
| $68,000 | Structural resistance | Top of the consolidation zone |
| $100,000 / $126,198 | Historical resistances | Long-term targets if the bull market resumes |
Fundamental Outlook
The current consolidation reflects lingering uncertainty tied to trade tensions and a broad risk reassessment across asset classes. Bitcoin remaining capped below $70,000 shows that risk appetite has not yet fully recovered from the earlier systemic deleveraging shock. The regulatory clarity gained since late 2024 now appears largely priced in, leaving price at the mercy of liquidity-hunting dynamics.
On the supply side, aggressive accumulation by certain corporate holders has reduced the floating supply, but current selling pressure appears to stem more from institutional ETF outflows than from long-term holders. A break of the $61,000 support could trigger a liquidation loop forcing ETF issuers to sell spot Bitcoin. Conversely, a break above the $67,000 wall could spark a significant short squeeze, fueling a bullish feedback loop.
Conclusion
Bitcoin, as of late July 2026, presents the picture of a mature asset, deeply embedded in institutional finance and subject to the same macro gravity as traditional assets. The multi-timeframe analysis reveals an advanced state of compression, with the asset squeezed between heavy distribution at the $66,956 sell wall and residual support demand from $61,000. No major structural reversal signal — golden cross, clear bullish divergence — is currently confirmed on the higher timeframes.
A breakdown below the deep $57,800 support would likely open the door to a sharper purge, while a sustained erosion of the $67,000 wall would be the necessary condition to confirm the end of the current bearish phase. In this environment, disciplined risk management anchored to the identified liquidity boundaries — rather than directional bets — remains the most prudent approach.
Disclaimer: This article is published for educational and informational purposes only. It does not constitute financial advice, an investment recommendation, or a solicitation to buy or sell Bitcoin or any other digital asset. Cryptocurrency markets are highly volatile and risky: always do your own research (DYOR) and consult a licensed financial advisor before making any investment decision.

