


A market caught between two fires
Bitcoin (BTC/USDT) is moving through a decisive technical turbulence zone, hovering around $75,644 – $75,940. After repeatedly failing to break above the local high of $82,389, the leading cryptocurrency is showing signs of temporary exhaustion in its bullish momentum. The long-term macro structure remains technically constructive, buoyed by the historic rebound that began at the $57,800 accumulation support. Yet the alignment across intraday timeframes reveals a clear deterioration in short-term momentum, marked by short moving averages losing their grip and a bearish-flag compression pattern. The market is currently testing its psychological and technical floor at $75,000 head-on — a hinge pivot below which passive liquidity thins out considerably.
The core operating thesis: Bitcoin is currently squeezed between an immediate demand zone at $74,500 – $75,400 and a heavy ceiling of institutional sell orders concentrated between $77,800 and $82,500. This defensive positioning by market makers reflects two converging systemic catalysts: the Federal Reserve’s monetary policy meeting on September 16, 2026, dominated by fears of an unexpected rate hike amid resurging inflation, and the failure of the cloture motion on the CLARITY Act in the U.S. Senate. Together, these forces are imposing an elevated risk premium and weakening leveraged long positions.
Holding above the $74,000 structural support on a daily close basis is what preserves the quarterly bullish narrative. A confirmed break below that threshold would validate a technical capitulation toward underlying volume lows, while a rapid reclaim of the $77,200 pivot is essential to absorb sell-side flow and re-ignite an expansion phase toward recent highs.
The bigger picture: the secular trend remains intact
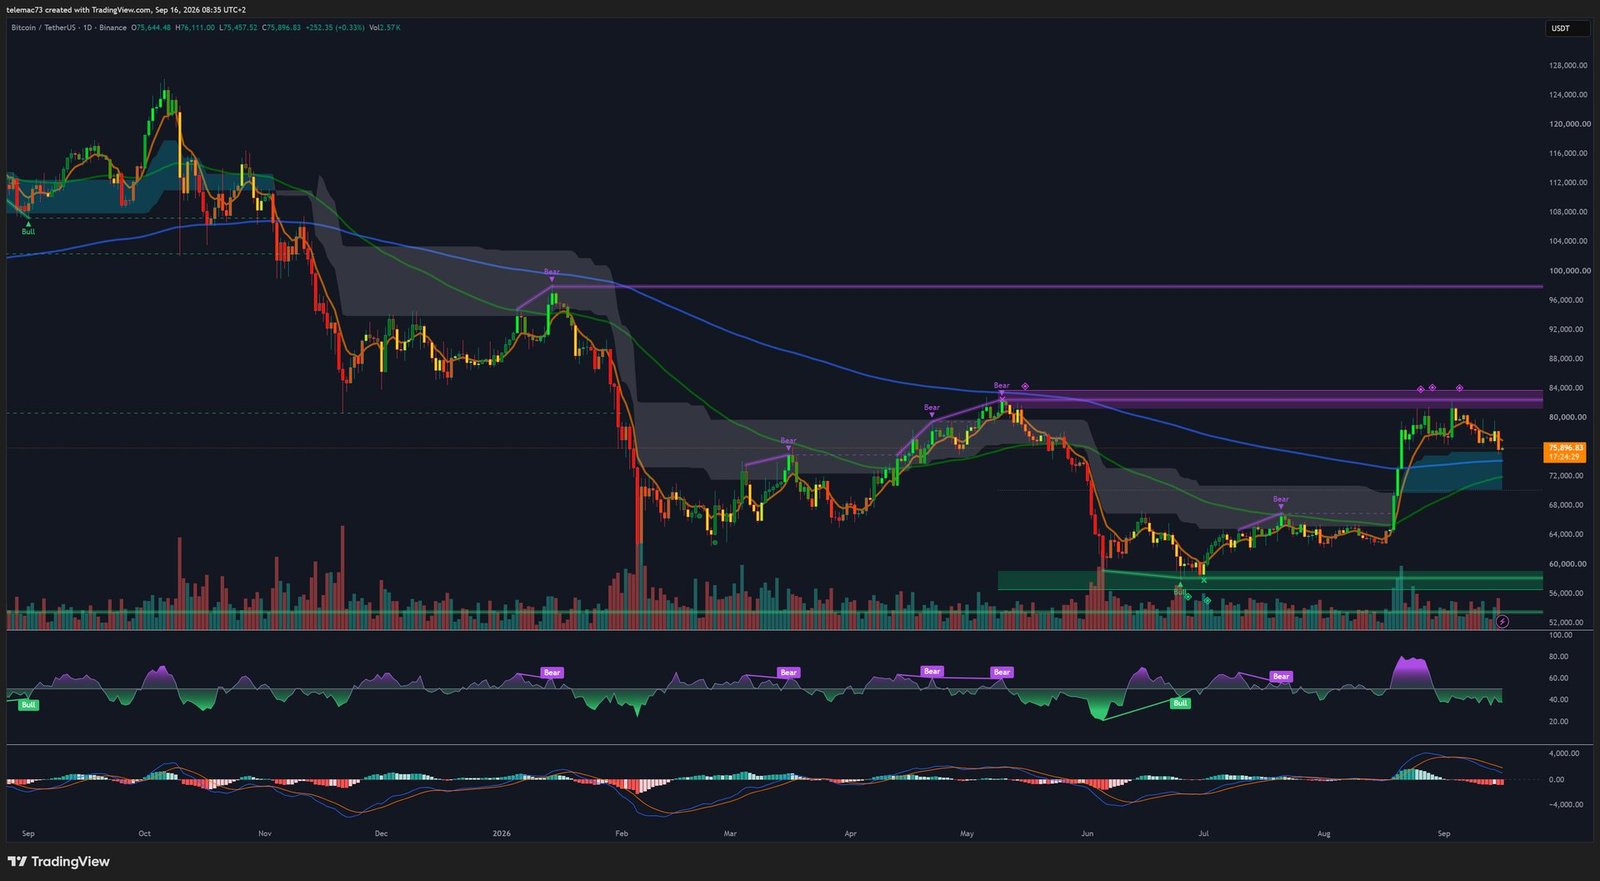
The daily chart puts into context the vigorous recovery cycle that pulled Bitcoin out of its prolonged purge phase following all-time highs above $120,000. The major inflection point was the validated double bottom at $57,800 in July-August 2026, from which a powerful directional impulse emerged. This rally broke through the entire cluster of intermediate moving averages on high volume, forging a structural Golden Cross between the fast moving average and the 200-day SMA, located between $73,800 and $74,200.
The correction seen since the $82,389 high is unfolding as a steady descending channel, comparable to an institutional bull flag (a macro Bull Flag). This structure is absorbing the overheating triggered by August’s vertical ascent. The Relative Strength Index (RSI), which had climbed above 80 into overbought exuberance, has decompressed healthily and is now retesting its median 50 level. The daily MACD, however, warns of a notable slowdown in spot buying flows: its momentum line is bending toward its signal line, sharply narrowing the positive gap created during the summer impulse.
| Indicator (1D) | Reading / State | Interpretation |
|---|---|---|
| 200D Moving Average | $73,800 – $74,200 | Major dynamic support; bull market demarcation line |
| 20-Day EMA | $77,500 – $78,200 | Recent bearish break; now a dynamic resistance zone |
| RSI (14-period) | 52.4 | Neutralized after an overbought spike at 81.0; testing the 50 median |
| MACD Signal Line | +1,120 / +1,340 | Lines converging in positive territory; risk of bearish crossover |
| MACD Histogram | Expanding negative bars | Contraction in buy-side accumulation speed |
| Chart Structure | Descending Channel / Bull Flag | Orderly consolidation phase after the impulse |
If Bitcoin fails to hold above the $74,000 – $75,000 zone, a confirmed Death Cross on the daily MACD would sanction the start of a deeper corrective phase, neutralizing the flag structure and reinstating an extended sideways accumulation dynamic.
Tactical shift on the 4-hour chart: the distribution break
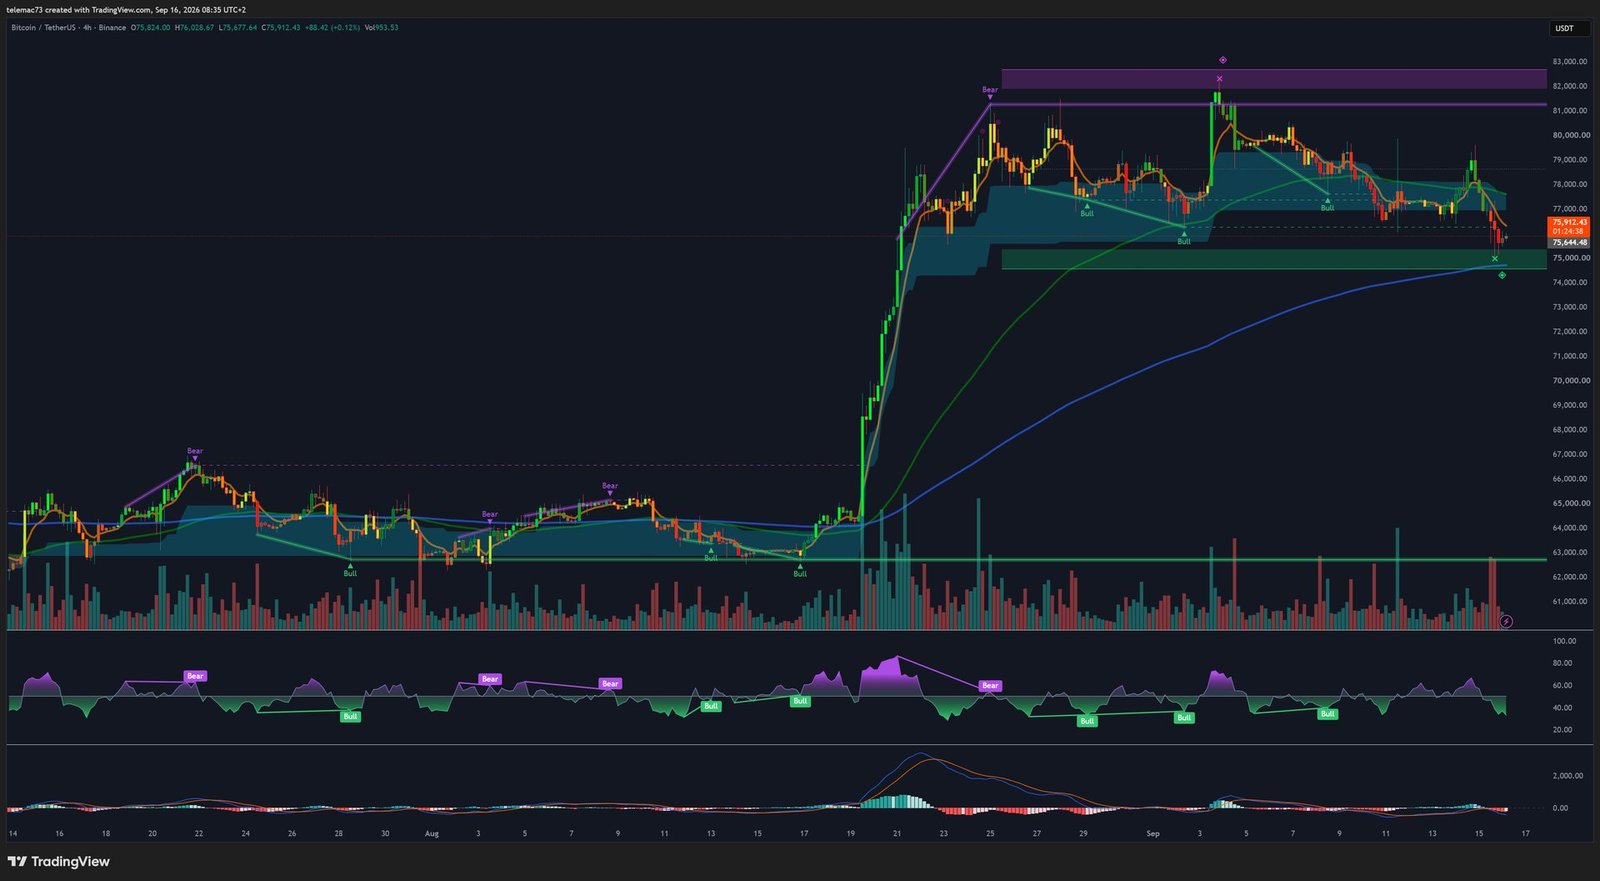
The 4-hour analysis breaks down the tactical shift that occurred at the top of the move. Between $81,200 and $82,389, price action ran into a massive sell-side Order Block, materialized as a thick upper resistance band. Buyers’ repeated inability to print fresh marginal highs produced three consecutive descending RSI peaks, generating pronounced bearish divergences.
| Sequence (4H) | Price Level (USDT) | Market Mechanics |
|---|---|---|
| Triple rejection & divergence | $81,500 – $82,389 | Exhaustion of buy orders; algorithmic distribution |
| Triangle breakdown | $78,400 | Uptrend line break; stop orders triggered |
| Bearish crossover (Death Cross) | $77,600 | 20 EMA below 50 EMA; loss of directional edge |
| Demand block test | $75,400 – $75,900 | Temporary absorption at horizontal support |
| 4H transition base | $74,800 – $75,200 | Confluence of 4H moving average and Order Block floor |
The breakdown of the ascending compression triangle’s floor at $78,400 triggered the liquidation of intraday long positions. Price collapsed until it made direct contact with the anchoring buy-side Order Block located between $74,800 and $75,600, where the 4H structural moving average also converges. The 4H RSI now sits at 34, brushing against oversold territory without displaying any bullish reversal divergence — a sign that immediate directional control still favors sellers. Any rebound attempt from this support will run into severe dynamic resistance as soon as price returns to $77,200 – $78,000.
Extreme compression on the 15-minute chart
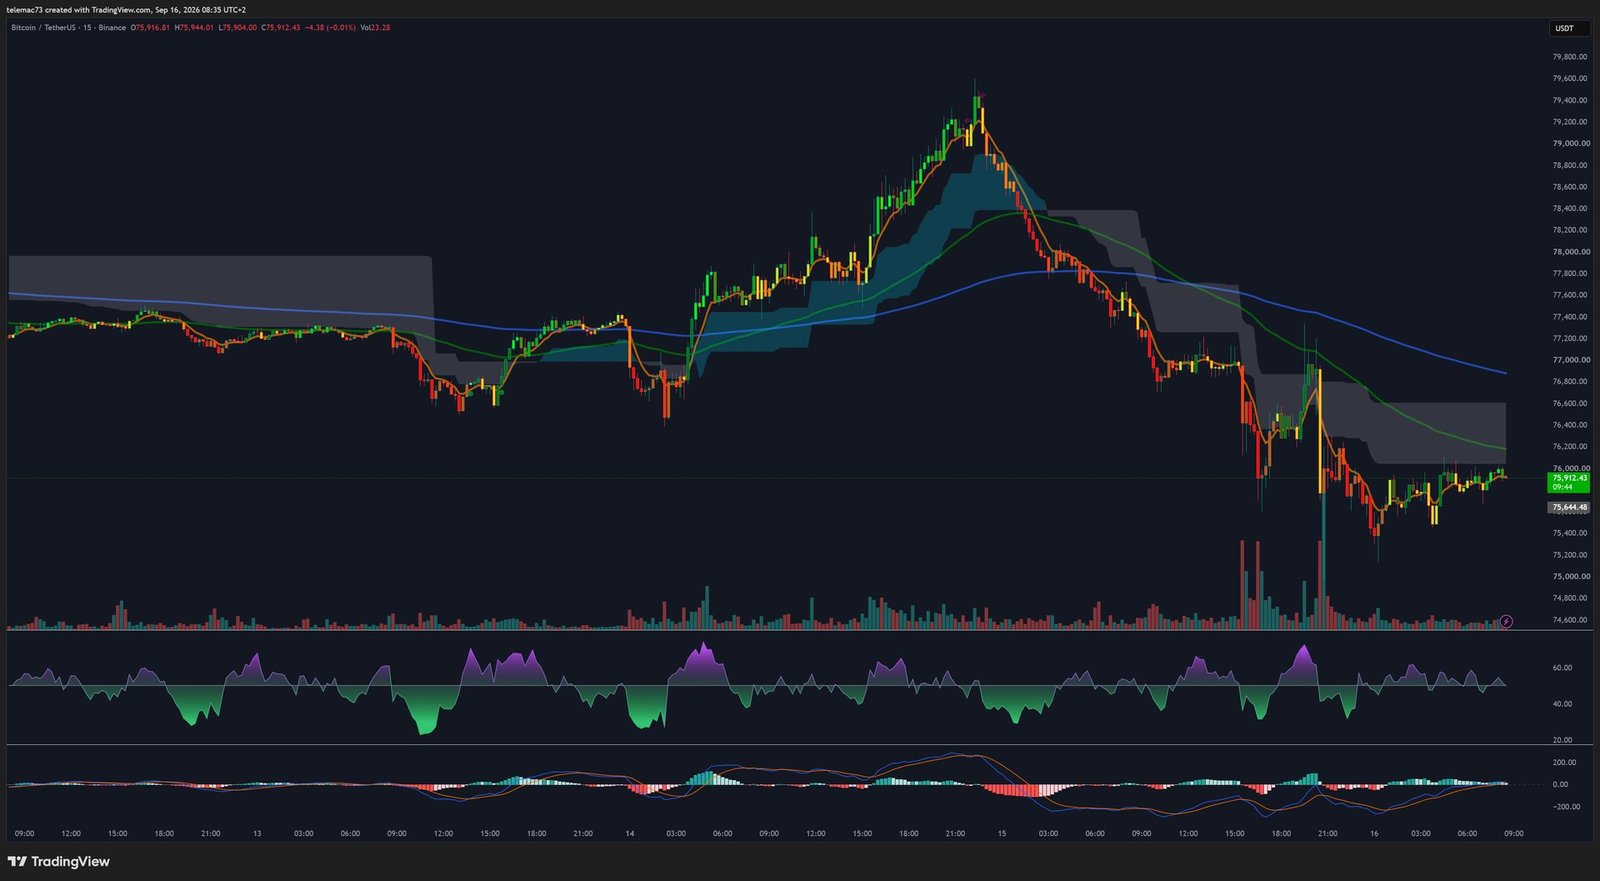
On the 15-minute timeframe, execution mechanics highlight the violence of the intraday drop that projected price from $79,400 down to a local capitulation low of $75,400, driven by anomalous volume bars indicative of forced liquidations in the perpetual futures market. Since printing that low, the market has entered an extreme contraction phase, forming a bear pennant confined between $75,400 and $76,200. The 200-period moving average, sitting at $77,000, acts as the strict invalidation point for the short-term selling dynamic.
The 15m RSI has pulled out of extreme oversold territory below 22 to climb back toward 39, tracing a modest local bullish divergence. However, this decompression has unfolded sideways — a symptom of a market dominated by passive limit selling rather than genuine buying initiative. In a bear-pennant pattern, this kind of technical neutralization typically serves as reloading for a fresh directional impulse once U.S. markets open.
What the order book reveals
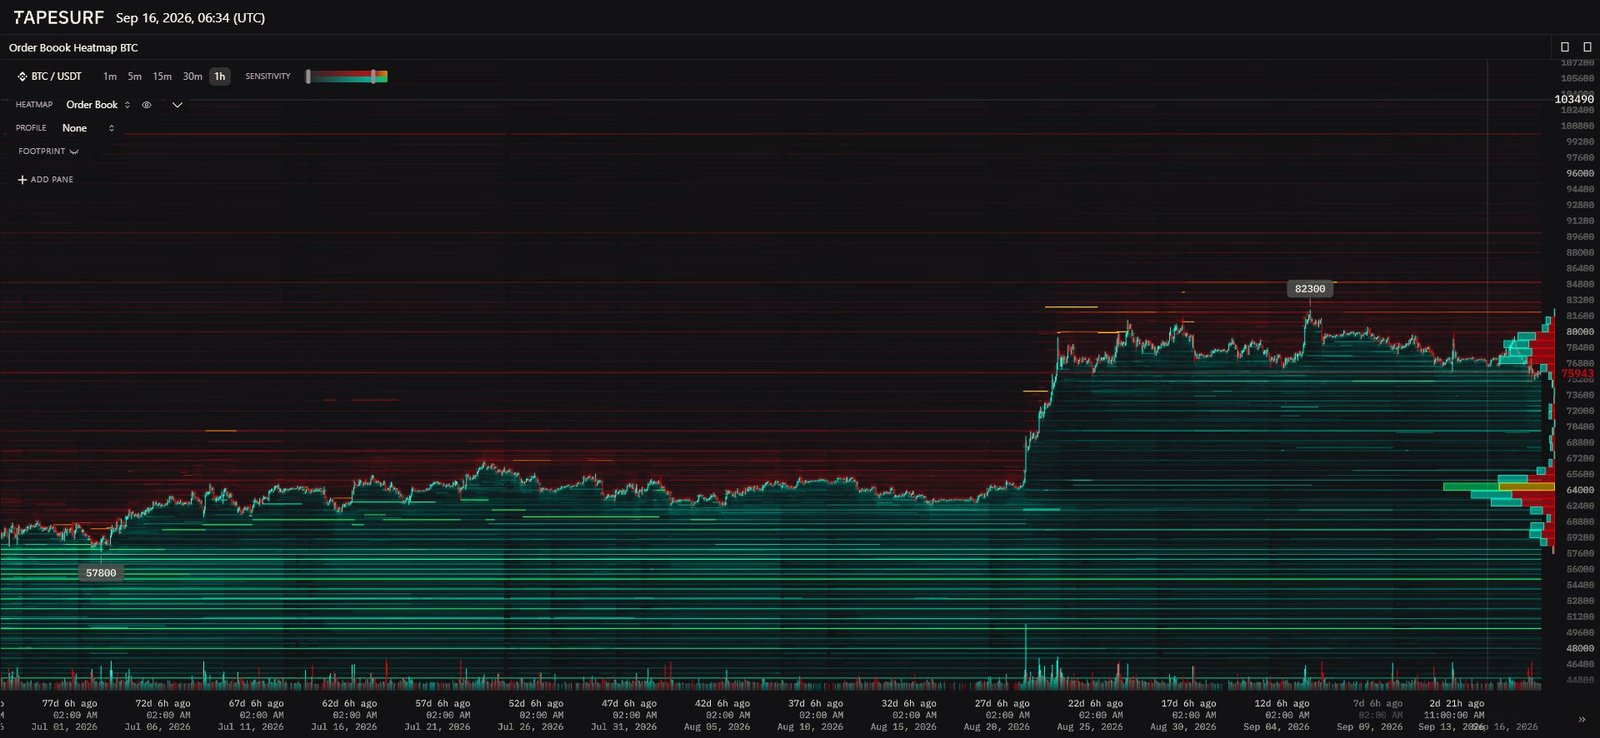
Market-depth data pulled from the Tapesurf heatmap on September 16, 2026 objectifies a stark asymmetry between overhead supply and underlying demand. On the sell side, an uninterrupted wall of limit orders stretches from $78,000 up to the $82,389 high, with residual clusters extending as far as $103,490 — a genuine algorithmic wall standing against any relief rally. On the buy side, the picture is far more fragile: while a cluster of orders supports price between $75,000 and $75,400, the space below shows a passive liquidity void down to the $64,000 level, with the densest layer of buy orders only reappearing between $57,800 and $64,000.
| Price Zone (USDT) | Order Book Typology | Role |
|---|---|---|
| $81,500 – $82,500 | Asks — maximum concentration | Institutional absorption barrier |
| $78,000 – $80,000 | Asks — dense layer | Algorithmic wall |
| $77,200 – $77,800 | Immediate asks | Boundary blocking the recovery pivot |
| $75,000 – $75,400 | Immediate bids | Current spread defense zone |
| $65,000 – $74,000 | Structural liquidity void | High-slippage corridor in case of breakdown |
| $57,800 – $64,000 | Deep bids (accumulation) | Macro structural absorption basin |
This structural anomaly means that a confirmed break of the $74,500 – $75,000 floor would meet only limited friction in the order book, raising the risk of a brutal liquidity hunt (a long squeeze) toward earlier accumulation zones.
The macro catalysts tipping the scale
Bitcoin’s technical hesitation is rooted in a particularly heavy fundamental backdrop over September 15-16, 2026. U.S. monetary policy has suddenly hardened: while markets had been pricing in an easing path, a Producer Price Index (PPI) reading of 5.4% reignited inflation fears, compounded by Brent crude pushing to $109. The 10-year yield jumped above 5%, its highest level in several cycles, and prediction markets now put the odds of a 25-basis-point hike by Fed Chair Kevin Warsh at 88%.
On the legislative front, the Digital Asset Market Clarity Act, which was meant to establish a clear regulatory framework separating regulator jurisdiction and governing stablecoin yields, failed to clear its procedural cloture vote in the Senate on September 15 due to insufficient bipartisan support. The setback immediately triggered outflows from spot ETFs and a broad pullback across crypto valuations. Only sustained corporate treasury accumulation and the network’s continued rise in realized capitalization are providing a fundamental counterweight to the turbulence.
| Catalyst | Factual Data | Impact on Bitcoin |
|---|---|---|
| FOMC Meeting (Fed) | Sept 15-16 meeting chaired by Kevin Warsh; 88% odds of a 25bp hike | Downward pressure on non-yielding assets |
| Inflation Resurgence | PPI at 5.4%; Brent at $109; U.S. 10Y yield at 5.041% | Tightening global financial conditions |
| CLARITY Act Vote | Cloture motion failed in the Senate on Sept 15 | Resurgence of regulatory risk premium |
| ETF / Derivatives Flows | Net outflows; 62% sell-side dominance | Loss of support above $77,000 |
| Fundamental Accumulation | Realized cap +$9.36B; active corporate treasuries | Structural shock absorber limiting macro collapse |
Operational map: the key levels to watch
| Level | Threshold (USDT) | Operational Role |
|---|---|---|
| Resistance R3 | $82,389 | Major bullish expansion target |
| Resistance R2 | $79,500 – $80,200 | Profit-taking zone for long positions |
| Sell-side Pivot R1 | $77,200 – $77,800 | Invalidation threshold for the immediate bearish bias |
| Pivot Point (PP) | $76,300 | Tactical trigger for a relief bounce |
| Immediate Support S1 | $75,000 – $75,400 | Critical short-term holding threshold |
| Pivot Support S2 | $73,800 – $74,200 | Boundary between a healthy correction and a bearish reversal |
| Major Support S3 | $57,800 – $64,000 | Ultimate structural capitulation support |
Two scenarios for the sessions ahead
Bearish continuation scenario — the highest-probability immediate path if risk aversion persists. A downside resolution of the 15m compression pennant below $75,400 would open the way to a breakdown of the $75,000 psychological floor. A confirmed 4H close below that level would trigger a purge of long positions sitting in the order book. Given the liquidity void identified down to $64,000, price could accelerate sharply toward the daily moving-average support at $73,800 – $74,200, or even an extended slide toward $64,000 – $68,000 if sell volume cannot be absorbed. This scenario would only be invalidated by a confirmed reclaim above $77,800.
Bullish reversal scenario — requires flawless volumetric absorption within the $75,000 – $75,500 demand block, potentially triggered by a more dovish-than-expected Fed or the emergence of a Senate compromise on the regulatory framework. Technically, this reversal requires an impulsive break of the pennant’s resistance at $76,300, followed by a decisive push through the $77,200 – $77,800 pivot zone backed by institutional volume. Such a move would force the closing of intraday short positions and open a direct recovery corridor toward $80,000 and, ultimately, the cycle high of $82,389.
The bottom line
The current asymmetry in the distribution profile means the $75,000 zone should be treated not as a simple static support level, but as the directional pivot that will define market structure for the remainder of H2 2026. The combination of persistent monetary tightening and fragmented spot buy-side liquidity calls for strict execution discipline, centered on defending the 200-day moving average as the demarcation line between a healthy technical digestion phase and a prolonged deterioration of the bull cycle.
Disclaimer: This article is provided for purely informational and educational purposes. It does not constitute investment advice, a recommendation to buy or sell, or a solicitation to trade financial or crypto assets. The technical levels and scenarios presented reflect a point-in-time analysis and can change rapidly. Investing in cryptocurrencies carries a risk of capital loss; do your own research and consult a licensed financial advisor before making any decision.

