


Bitcoin (BTC/USDT) has just printed an eight-month high at $87,396 before pulling back to around $84,200. Caught between an unexpected monetary tightening from the Fed and an unprecedented wave of institutional inflows, the market is sending mixed signals: the underlying trend remains bullish, but short-term momentum is showing signs of exhaustion. Full analysis as of September 24, 2026, from the daily chart down to order book microstructure.
Key Takeaways
- The Fed raised rates by 25 basis points (target range 3.75% – 4.00%), the first hike since July 2023.
- US spot Bitcoin ETFs recorded a record $999 million inflow on September 23, bringing net September subscriptions above $3.5 billion.
- A short squeeze of roughly $1 billion in liquidations propelled price to $87,396, where it ran into a wall of sell orders.
- On the daily chart, a Golden Cross confirms the underlying trend; on shorter timeframes, a bearish RSI divergence on the 4H and a bear flag on the 15M call for caution.
- Key zone to watch: the buy-order wall between $80,000 and $82,000.
A Double-Edged Macro Backdrop
The environment surrounding Bitcoin revolves around a rare duality: unexpected monetary tightening on one side, unprecedented institutional capital inflows on the other.
The Fed Raises Rates
On September 16, 2026, the Federal Open Market Committee (FOMC), chaired by Kevin Warsh, voted unanimously (12-0) to raise the federal funds rate by 25 basis points, lifting the target range to 3.75% – 4.00%. This first hike since July 2023 responds to a resurgence of inflation, back to 3.4% year over year. It is driven by an oil supply shock, with crude pushed above $100 a barrel in the wake of the conflict involving Iran, as well as strains on supply chains tied to artificial intelligence infrastructure.
The CLARITY Act Fails in the Senate
On the regulatory front, the US legislative calendar suffered a setback on September 15: the Digital Asset Market Clarity Act (CLARITY Act) was rejected by a 49-50 vote in the Senate, falling short of the 60-vote threshold. The bill aimed to draw a lasting statutory line between the jurisdictions of the SEC and the CFTC. Regulators quickly cushioned the legal uncertainty with targeted initiatives, including an SEC innovation exemption for secondary markets in tokenized equities and CFTC no-action letters in favor of decentralized protocol developers.
Spot ETFs Carry the Market
Against this restrictive backdrop, Bitcoin’s resilience comes from the strength of spot buying flows. US spot Bitcoin ETFs took in a record $999 million on September 23, lifting net September subscriptions above $3.5 billion, the strongest monthly pace of 2026. This wave of liquidity triggered a massive short squeeze: nearly $1 billion in global derivatives liquidations, of which $878 million hit short positions. Price was violently pushed through the $80,000 and $82,000 resistances, up to the $87,396 peak.
Warning sign: the simultaneous expansion of more than $2 billion in open interest points to a rapid rebuild of highly leveraged positions. That leaves the market vulnerable to volatile consolidations as soon as spot absorption slows.
Multi-Timeframe Technical Analysis
Daily Chart (1D): Golden Cross and Institutional Resistance
The daily chart shows a structural regime change after several months of sideways compression within the $58,000 – $65,000 band. The impulse that started in late August broke the summer consolidations and pushed the total crypto market capitalization back above the symbolic $3 trillion mark.
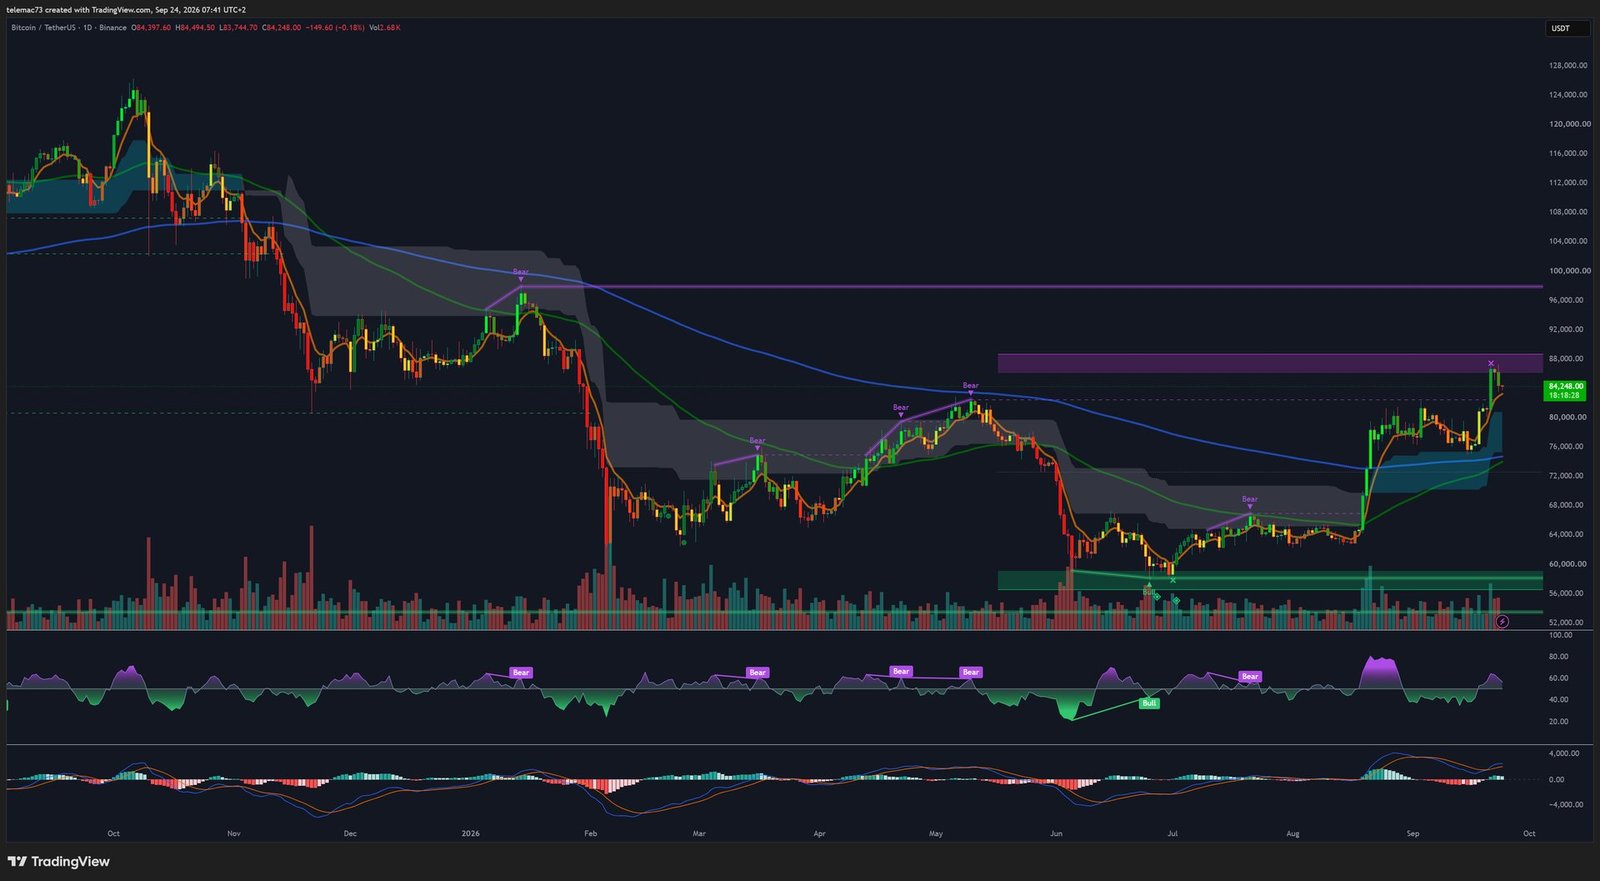
This expansion came with a major technical confirmation: a Golden Cross, with the 50-day exponential moving average crossing above the 200-day simple moving average (around $76,000 – $77,000). This setup confirms the underlying bullish bias.
However, the strength of the move drove price straight into a historical distribution block, marked by a horizontal band between $85,000 and $88,000. This zone corresponds to the bearish fractals of the late-2025 correction that followed the all-time high of $126,198.
On the indicator side, the 14-period RSI climbed above 80 during the test of $87,396, triggering a bullish exhaustion signal. Such a reading confirms the strength of the impulse, but it also reflects statistical overheating that calls for a stabilization or sideways decompression phase before any sustained attempt on $90,000. The daily MACD remains solidly positive, but its histogram is starting to plateau: the acceleration differential is approaching a temporary inflection zone.
4-Hour Chart (4H): Consolidation and Bearish Divergence
The 4-hour timeframe reveals the exact shape of the trend stall below $87,500. After a sequence of green candles backed by heavy buying volume, contact with resistance produced an indecision candle with a long upper wick, followed by a red rejection candle.
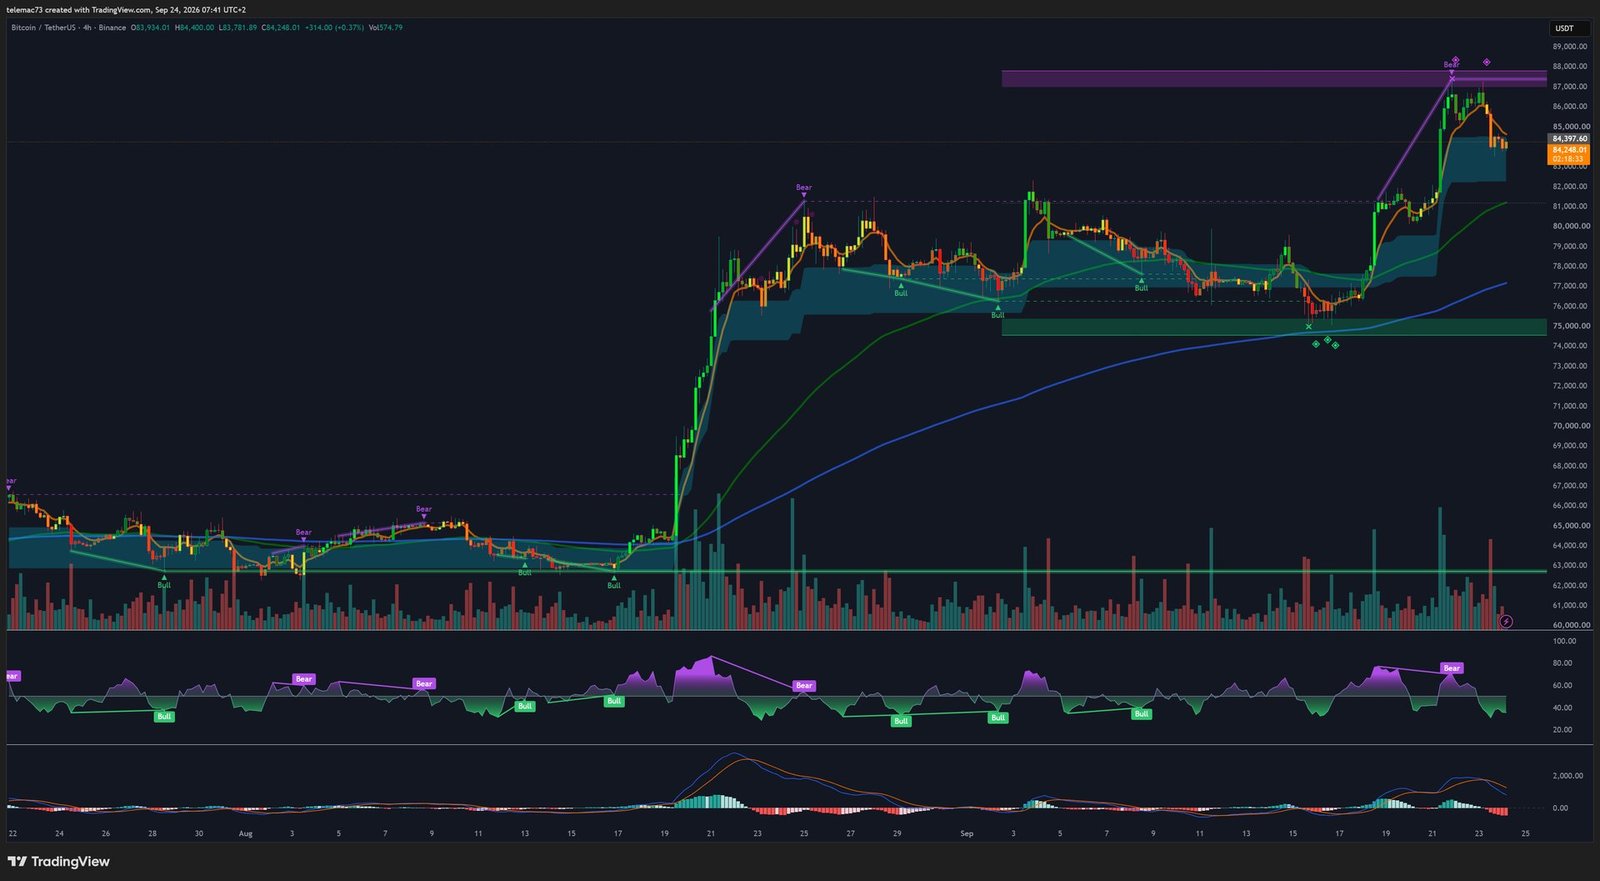
Price has since moved within a slightly descending channel resembling an intraday bear flag, oscillating around $84,200 – $84,400. This compression rests on the fast 4H exponential moving average, while the intermediate moving average provides deeper structural support around $80,000 – $82,000.
Momentum indicators highlight an immediate corrective vulnerability. The 4H RSI has drawn a classic bearish divergence: price made a higher high at $87,396 versus the previous peaks at $85,000, yet the RSI printed a lower high, sliding from the overbought zone (80) to 55. This decoupling reflects fading marginal buyers. The 4H MACD is flattening, with its momentum line converging toward its signal line: a bearish crossover remains imminent if price fails to break out of its current drift quickly.
15-Minute Chart (15M): A Rebound Without Conviction
The 15-minute timeframe highlights buyers losing the initiative after failing to clear $87,000. A local double top formed around $87,396 and then $86,600, and sellers regained control by decisively breaking the 200-period exponential moving average near $85,200.
The current structure is a very tight, low-volume ascending channel, typical of a bearish continuation pennant following the impulsive drop from $87,000 to local support at $83,800. The bounce lacks conviction: it looks mostly like a technical rebalancing after the purge of short liquidations.
Oscillators confirm this unfavorable inertia. The 15M RSI, after an oversold low below 28 during the wick down to $83,800, recovered timidly and topped out around 44, unable to clear the neutral 50 zone. The 15M MACD remains below its zero line: despite a minor bullish crossover, the extreme narrowness of the histogram bars shows a lack of buying aggression in the order book.
Order Book: What the Liquidity Heatmap Reveals
The order book heatmap provides a decisive reading grid for understanding the rejection at $87,396 and identifying liquidity magnets.
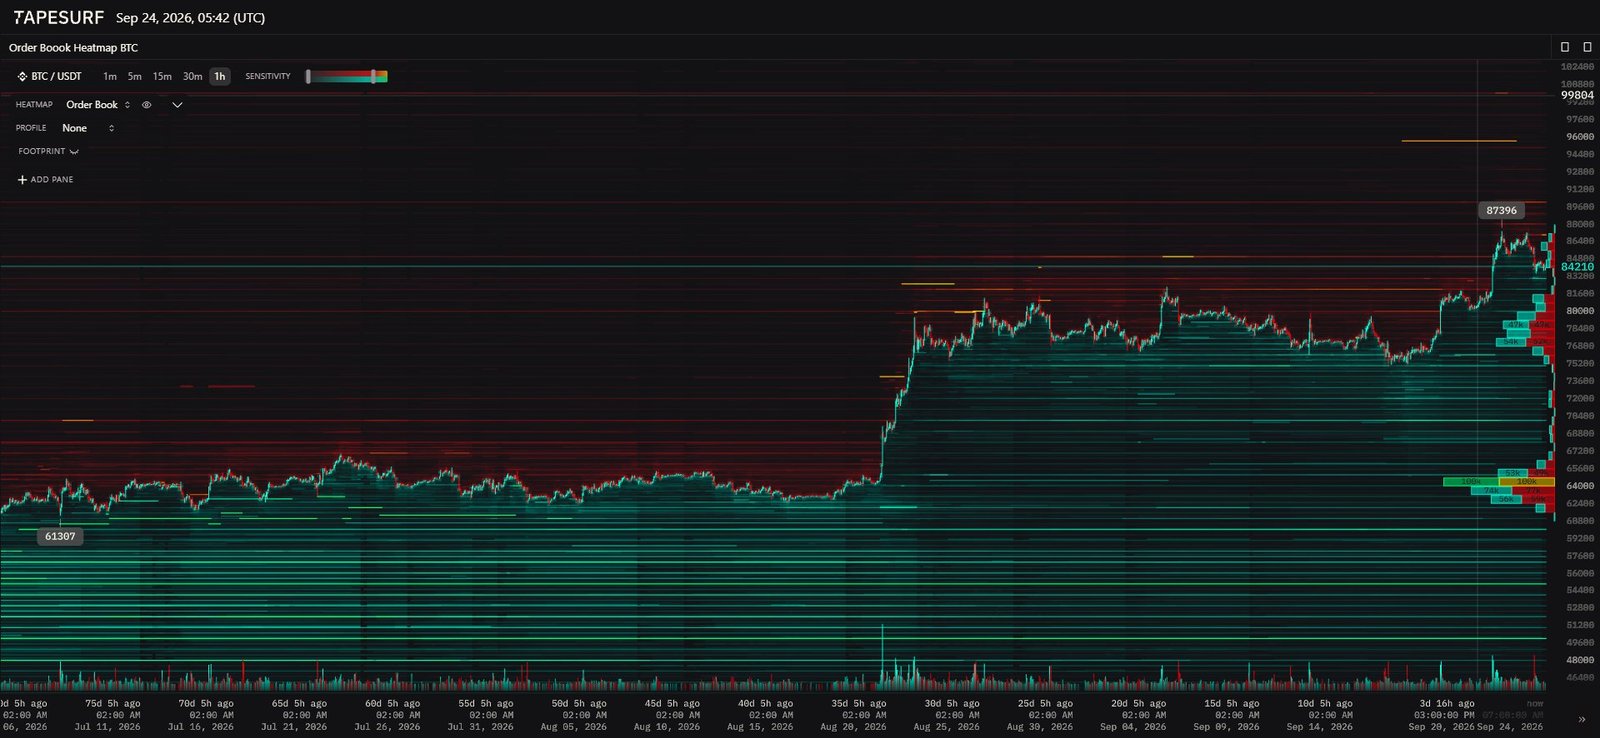
The vertical climb from $80,000 was fueled by the continuous sweeping of short sellers’ stop orders. As soon as price reached $87,300, it collided with a particularly dense wall of limit sell orders extending up to $88,500. With insufficient market buying to absorb this passive liquidity once short covering was over, price stalled sharply before being pushed back down.
At the moment, order distribution shows a relative short-term balance: roughly 51% sell orders versus 49% buy orders around the $84,200 pivot. Below, a relative liquidity void stretches between $82,500 and $83,800, followed by a massive concentration of limit buy orders (bid wall) between $80,000 and $82,000.
This dense zone acts like a magnet: institutional players often seek this kind of order reservoir to accumulate spot volume at low impact cost, while flushing out late long positions that entered with heavy leverage when $85,000 was broken.
| Price zone | Volume type | Relative density | Strategic role |
|---|---|---|---|
| $99,800 – $100,000 | Major sell wall (Ask Wall) | Exceptional | Macro psychological target / final profit-taking |
| $87,000 – $88,500 | Thick passive offer | Very high | Short squeeze stopping zone / active immediate resistance |
| $84,000 – $84,500 | Current arbitrage pivot | Medium / balanced | Intraday equilibrium / 51% sell vs 49% buy |
| $80,000 – $82,000 | Buy order wall (Bid Wall) | Very high | Primary institutional support / ETF reload zone |
| $75,000 – $76,500 | Mid-term liquidity floor | High | Major structural support / confluence with the daily 200 SMA |
| $64,000 – $65,300 | Primitive accumulation base | Dense | Historical summer floor / macrostructure invalidation |
Technical Matrix and Key Levels
Combining price data, multi-timeframe indicators and market depth gives the following picture.
| Indicator / pattern | 15 minutes | 4 hours | Daily |
|---|---|---|---|
| RSI (14) | Neutral-bearish at 44 | Cooling to 55 | Overheated at 78-80 |
| RSI signals | Failure below 50 | Bearish divergence confirmed | Extreme zone (“Bear” signal) |
| MACD | Negative, below the 0 line | Positive lines flattening | Positive, steep slope |
| Key crossovers | Bearish break of the 200 EMA ($85,200) | Threat of a bearish MACD crossover | Golden Cross (50 EMA / 200 SMA) |
| Moving averages | Below the intraday 200 EMA | Above the fast EMA | Well above the 200 SMA |
| Chart pattern | Bear flag | Descending consolidation channel | Bullish accumulation breakout |
The following pivot levels frame tactical monitoring for the coming sessions:
| Level | Threshold | Horizon | Technical basis |
|---|---|---|---|
| Resistance R3 | $89,500 – $90,000 | Mid-term (1D) | Institutional extension limit / major psychological threshold |
| Resistance R2 | $87,400 – $88,000 | Short-term (4H) | Local impulse high / sell cluster on the heatmap |
| Resistance R1 | $85,200 – $85,500 | Intraday (15M) | Broken 15M 200 EMA / last lower intraday high |
| Pivot point | $84,200 | Dynamic pivot | Current equilibrium level / intraday inflection point |
| Support S1 | $83,600 – $83,800 | Intraday (15M) | Bottom of the compression channel / local selling-halt low |
| Support S2 | $81,800 – $82,000 | Short-term (4H) | Former range high / buy-order cluster on the heatmap |
| Support S3 | $76,000 – $77,500 | Mid-term (1D) | Confluence of the daily 200 SMA and the Golden Cross |
Three Scenarios Going Forward
Order book behavior and the alignment of timeframes point to three possible paths.
Scenario 1 (50%): Healthy Consolidation and Resumption of the Uptrend
In this case, the pullback from $87,396 is merely a technical breather, needed to flush the daily RSI overheating. Price stabilizes above $83,600, or makes a brief liquidity-sweeping incursion toward $82,000 support. Sustained spot ETF flows then absorb this temporary supply, invalidating the intraday bear flag with a 4H close above $85,200.
That signal would relaunch the push toward $87,400. A clean breakout with expanding volume would open a corridor toward the $89,500 – $92,000 resistance zone, paving the way for a test of the $95,000 – $100,000 psychological target. This scenario remains valid as long as no daily close occurs below the structural pivot at $81,800.
Scenario 2 (35%): Corrective Retracement Through a Leverage Flush
This scenario builds on the fragility created by the $2 billion open interest surge and the confirmed bearish RSI divergence on the 4H. A confirmed break of the channel bottom at $83,600 on the 15-minute chart would trigger a bearish MACD crossover on the 4H, followed by cascading liquidations of late long positions. Price would then accelerate lower to fill the liquidity void, down to the heatmap’s buy wall between $80,000 and $82,000.
An exhaustion wick could even probe the 4H 50 exponential moving average near $78,500. Such a pullback would allow institutional re-accumulation and offer a more attractive risk/reward before the primary move resumes.
Scenario 3 (15%): Macroeconomic Deterioration
This residual scenario would depend on a sudden exogenous deterioration: a new geopolitical escalation sending crude durably above $115, a further hardening of Federal Reserve rate expectations, or massive net outflows from spot Bitcoin ETFs. The $80,000 support would then give way without significant absorption, and price would slide toward the major structural support of the previous cycle, between $76,000 and $77,500. That is where the daily 200 SMA converges, and losing it would neutralize September’s bullish impulse.
Conclusion: A Solid Underlying Trend, Fragile Short-Term Momentum
Bitcoin’s technical picture shows a marked mismatch between the strength of the daily cycle and fading momentum on shorter timeframes. The daily Golden Cross and the unprecedented absorption by spot ETFs (+$999 million in 24 hours) confirm that the underlying trend remains firmly in institutional buyers’ hands.
Still, the clear bearish divergence on the 4H RSI, the looming bearish 4H MACD crossover and the persistent bear flag below the 15M 200 EMA call for restraint. Opening an aggressive leveraged long at current prices (around $84,200) carries an unfavorable risk profile.
The most rigorous approach is to defer commitments and watch for a liquidity test inside the order reservoir between $80,000 and $82,000. Signs of seller exhaustion at that level, such as an intraday bullish divergence or visible volume re-absorption in the order book, would offer a better entry point to target a clearing of the $88,000 resistance and an extension of the cycle toward the symbolic $100,000 mark. A daily close below $80,000 would strictly invalidate this rebound setup.
⚠️ Disclaimer: this article is published for educational and informational purposes only. It does not constitute investment advice, a recommendation to buy or sell, or a solicitation of any kind. Crypto-assets are highly volatile: you may lose all or part of your invested capital, especially when using leverage. Past performance is not indicative of future results. Do your own research and, if necessary, consult a qualified financial advisor before making any decision.

