


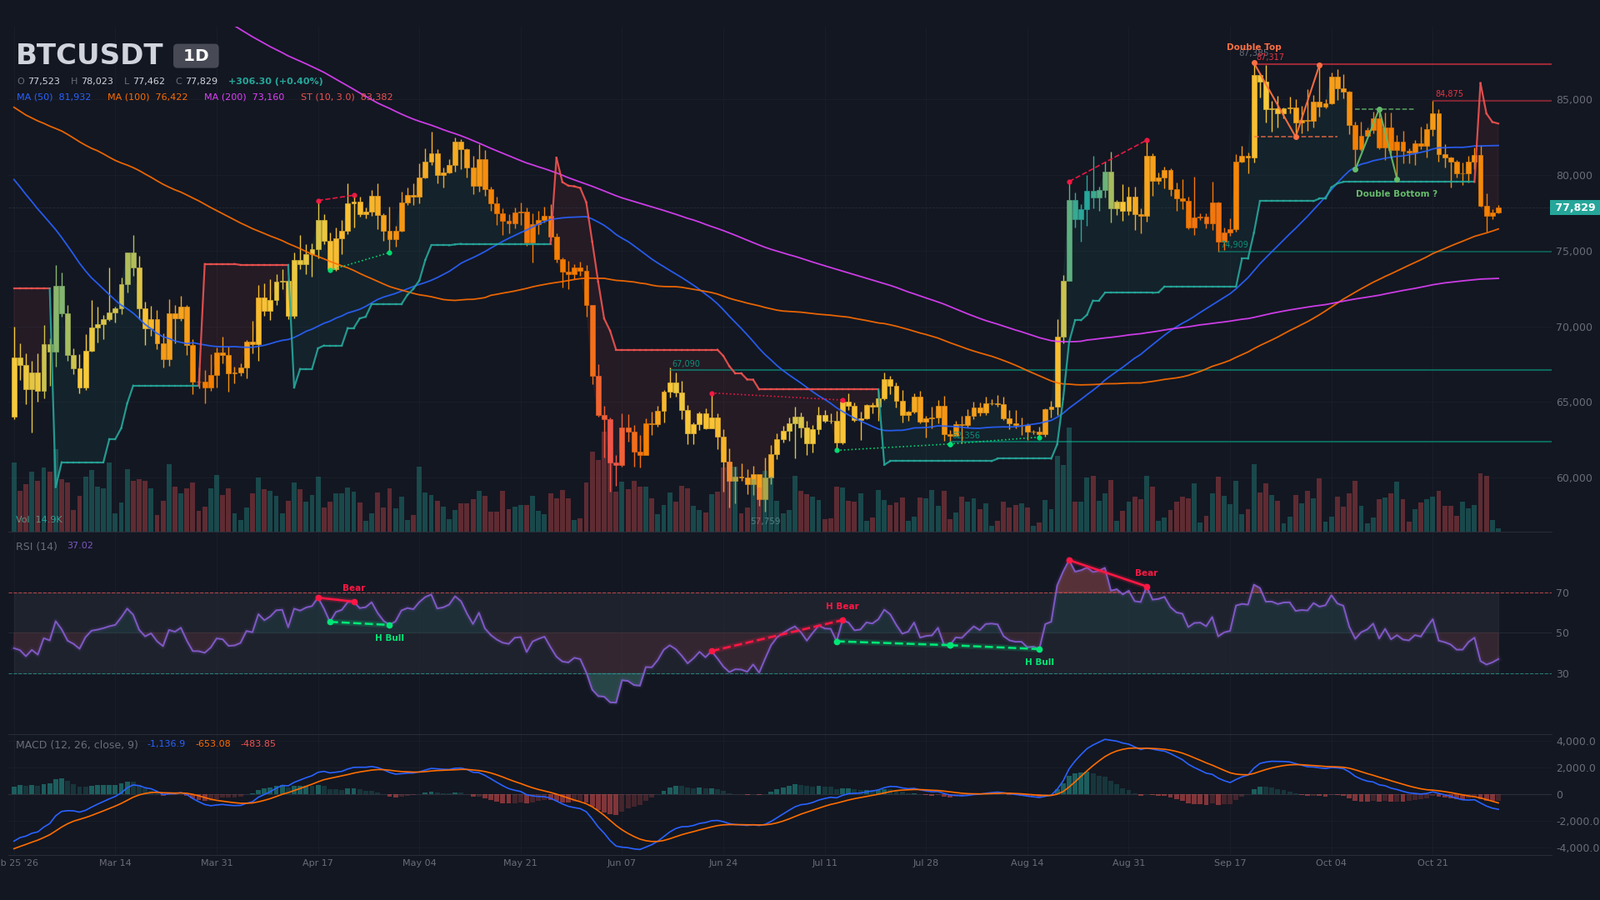
Bitcoin trades at $77,829 on November 1, 2026, 10.9% below its period high of $87,385 reached on September 21. The price sits about 2% above the recent low of $76,270, printed on October 30 during the shock triggered by the Binance hack. After a series of lower highs since late September, the market is now stabilizing below its moving averages, following an impulsive drop from $81,954 to $76,270 between October 29 and 30.
The dominant driver this week is the Binance hack, the largest ever recorded according to Decrypt (October 30): a theft of $6.3 to $6.4 billion that pushed bitcoin toward $76,400. Glassnode estimates its losses exceed those of the next nine largest exploits combined, according to Cointelegraph (October 31). The market absorbed the shock better than in 2018, thanks to its size and spot ETFs (Decrypt, October 30). Roughly $3B was frozen by stablecoin issuers, while $3.3B remains unrecovered (Bitcoin Magazine, October 31). TRM Labs, Chainalysis and Elliptic attribute the attack to North Korean groups (The Block, October 31). Binance says it will absorb the loss, and a Cointelegraph headline (October 31) mentions 90% of stolen assets being replenished, a figure still to be confirmed given the partial access to the article.
The macro regime remains restrictive. The Fed held rates at 3.75% to 4% on October 28, with two dissenters favoring a 25-basis-point hike (CNBC, October 28), and Lorie Logan argues that at least 50 basis points of further hikes would be needed (MarketWatch, October 30). ETF flows remain erratic: +$526.7M on October 19, +$524.8M on October 21, then -$635.6M on October 22 and -$137.9M on October 23 (Farside, data through October 23). Ethereum spot ETFs have logged a record 23-day streak of net outflows (Crypto Briefing, November 1). Among recent releases, US personal spending came in at 0.5 against a 0.6 consensus, and China’s non-manufacturing PMI printed 49.7 against 50.5 expected on October 31. No single number stood out; the hack dominated volatility.
This backdrop largely neutralizes the short-term technical signal. The shock has been absorbed, but a restrictive Fed and unstable ETF flows rule out any durable bullish reading. On-chain data and whale behavior are unavailable, which limits how far the analysis below can go.
Multi-Timeframe Technical Analysis
Daily Timeframe (1D): Double Top Confirmed Below the Moving Averages
On the daily chart, the dominant trend is bearish. The lower highs at $87,385 (September 21), $84,875 (October 21) and $81,954 (October 29) have shifted the market from distribution to a clear bearish markup. Price trades below the 20-period SMA (~$80,900) and 50-period SMA (~$81,900) but remains above the 200-period SMA (~$73,200); no 50/200 crossover has been flagged. The 100-period SMA (~$76,400) coincides with the October 30 low.
The double top is confirmed, with a neckline at $82,500 and a target at $77,700. That target is nearly reached, which limits residual downside momentum as long as $76,270 holds. The bullish double bottom, with a neckline at $84,340 and a target at $88,600, is not confirmed and remains a hypothesis. The SuperTrend is bearish at about $83,400.
The 14-period RSI (relative strength index) sits near 37, having exited the 45 to 47 zone and approaching oversold territory without reaching it. A regular bearish divergence (August 21 to September 3, RSI falling from 86 to 73 on higher prices) preceded the correction, and the swings confirm the weakening: the RSI at successive highs fell from 74 to 57, then to 36. The MACD (moving average convergence divergence) stays below its signal line and below zero, with a bearish crossover dated September 29 and a negative histogram showing no clear contraction. Volume on the current candle, at about 11% of its 20-period average, is provisional; the October 29 (253,736) and October 30 (241,631) sessions were heavy, a sign of impulsive selling.
Intermediate Dynamics (4H): Triple Top Confirmed, Stabilization Bounce
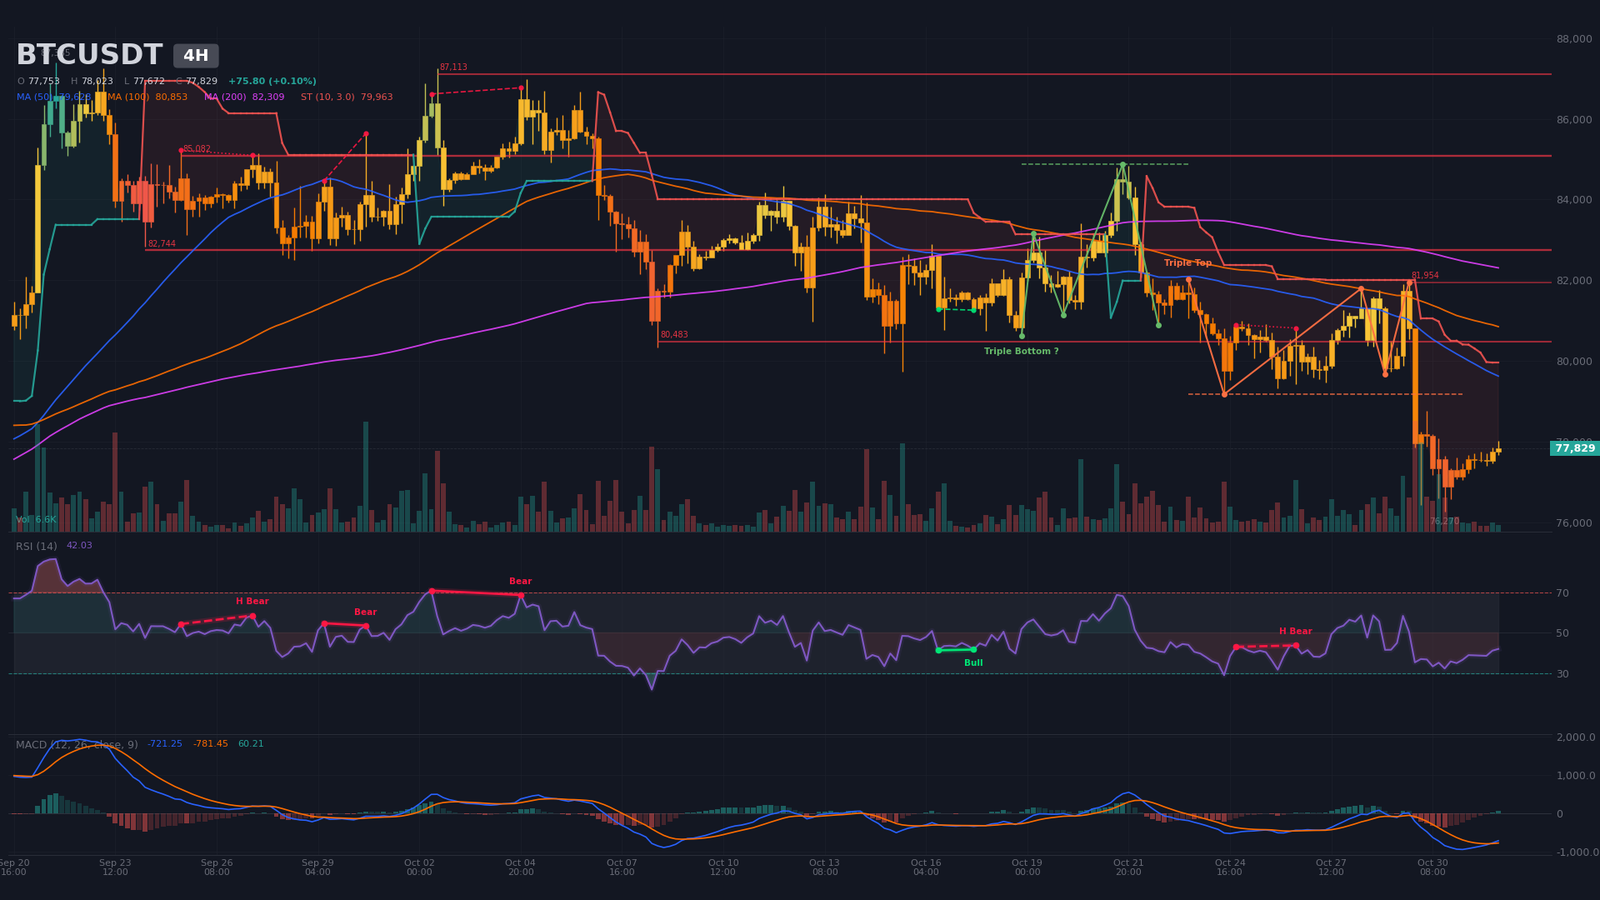
The 4-hour structure validates the daily picture. Lower highs, including $81,954 on October 29, are followed by a deeper low at $76,270 on October 30. Price sits below the 20-period SMA (~$78,300), 50-period SMA (~$79,600) and 200-period SMA (~$82,300). The triple top is confirmed: neckline at $79,180, target at $76,430, reached by the $76,270 low. The bullish triple bottom, with a neckline at $84,880 and a target at $88,900, is not confirmed. The bearish SuperTrend sits near $79,960, and resistances are at $80,480 (2 touches), $81,950 and $82,740 (3 touches).
The RSI, near 42, is leaving a 35 to 39 zone, signaling some relief. The MACD crossed up on November 1 at 00:00, with a positive histogram but a line still below zero: this is a technical rebound, not a reversal. A hidden bearish divergence (October 24 to 26) had already pointed to continuation. Volume, at about 23% of its average, reflects a lull after the liquidation. In the analyst’s reading, the tight consolidation between $77,000 and $78,000 on thin volume resembles a continuation pause, to be confirmed by a 4H close below $76,270 or above $79,960.
Intraday Structure (15m): Compression Wedge Below $78,000
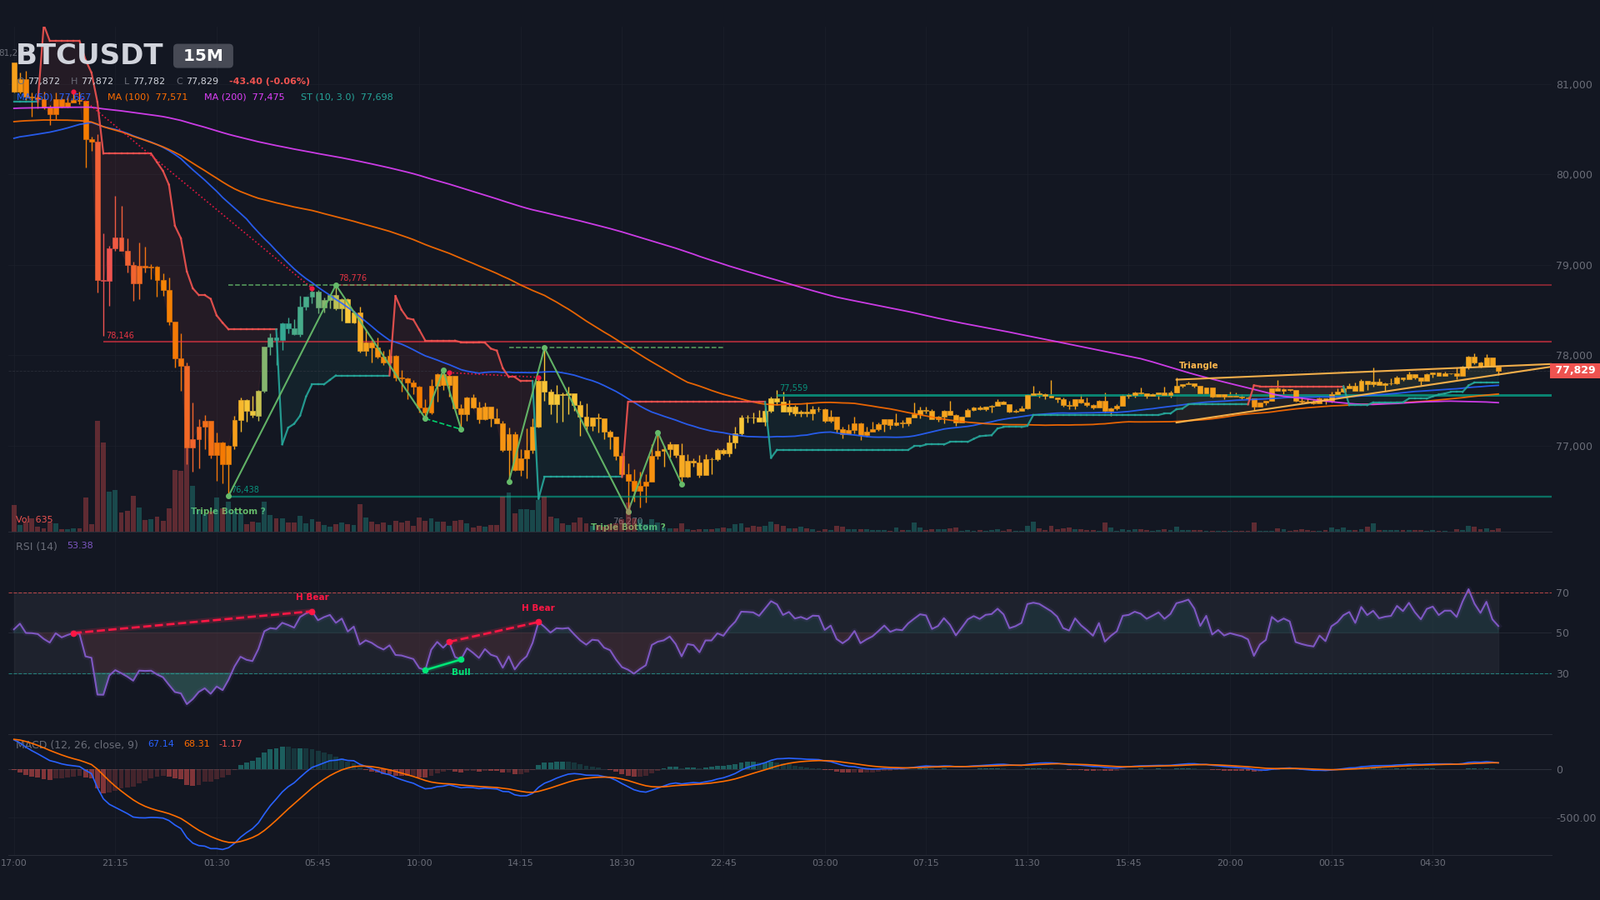
The intraday chart shows a wedge between an upper boundary near $77,840 and a lower boundary near $77,640, with an apex estimated around 10:31. Price trades above the 20, 50 and 200-period SMAs ($77,810, $77,670 and $77,480), after a bullish 50/200 crossover on October 31 at 22:45, and the SuperTrend is bullish at about $77,700. The RSI, at about 53, is neutral. The MACD has just crossed down at 07:15, above zero, with a barely negative histogram. Volume, at 152% of its average, signals slightly renewed activity.
The $77,560 support (8 touches) is the most tested level; the lower support is at $76,440. Resistances sit at $78,150 (2 touches) and $78,780, with the last intraday high at $78,023. A break below $77,560 exposes $76,440, while a 15m close above $78,150 opens $78,780, then $79,200. A sell wall of about $29M at $77,939 caps the intraday move.
Multi-Timeframe Synthesis
| Timeframe | Dominant trend | RSI (14) | MACD | Chart pattern |
|---|---|---|---|---|
| Daily (1D) | Bearish (bearish markup) | ~37 | Bearish crossover on 09/29, below zero | Double top confirmed |
| 4 hours (4H) | Bearish (stabilization) | ~42 | Bullish crossover on 11/01, below zero | Triple top confirmed |
| 15 minutes (15m) | Neutral (compression) | ~53 | Bearish crossover on 11/01, above zero | Compression wedge |
Map of Technical Levels and Pivots
The map combines classic pivots (daily, 4H, 15m), detected swings, moving averages, pattern targets and estimated liquidation pockets. No Fibonacci extension is calculated, since the date of the reference low ($57,759) is not provided. The short-term central pivot lies between $77,450 (daily) and $77,700 (4H).
| Level | Price (USD) | Category | Technical basis |
|---|---|---|---|
| Major resistance 3 (R3) | $82,700 – $83,400 | Resistance | 4H resistance $82,744 (3 touches), daily SuperTrend ~$83,380, estimated short pocket ~$83,100, daily neckline $82,500 |
| Major resistance 2 (R2) | $79,900 – $80,500 | Resistance | 4H SuperTrend ~$79,960, 4H resistance $80,483 (2 touches), 4H 50-period SMA ~$79,630 |
| Immediate resistance (R1) | $78,100 – $78,800 | Resistance | 15m resistances at $78,146 and $78,777, 4H 20-period SMA ~$78,300, sell wall $77,940 |
| Central pivot (P) | $77,450 – $77,700 | Pivot | Daily pivot $77,445, 4H pivot $77,694, 15m support $77,559 (8 touches) |
| Immediate support (S1) | $76,270 – $76,450 | Support | October 30 low, 15m support $76,438, daily 100-period SMA ~$76,420, 4H triple-top target $76,428 |
| Major support 2 (S2) | $74,300 – $74,900 | Support | Daily support $74,909, estimated long pockets at $74,330 and $74,845 |
| Major support 3 (S3) | $73,150 – $73,800 | Support | Daily 200-period SMA ~$73,160, estimated long pocket ~$73,814 |
Order Book and Liquidity Heatmap
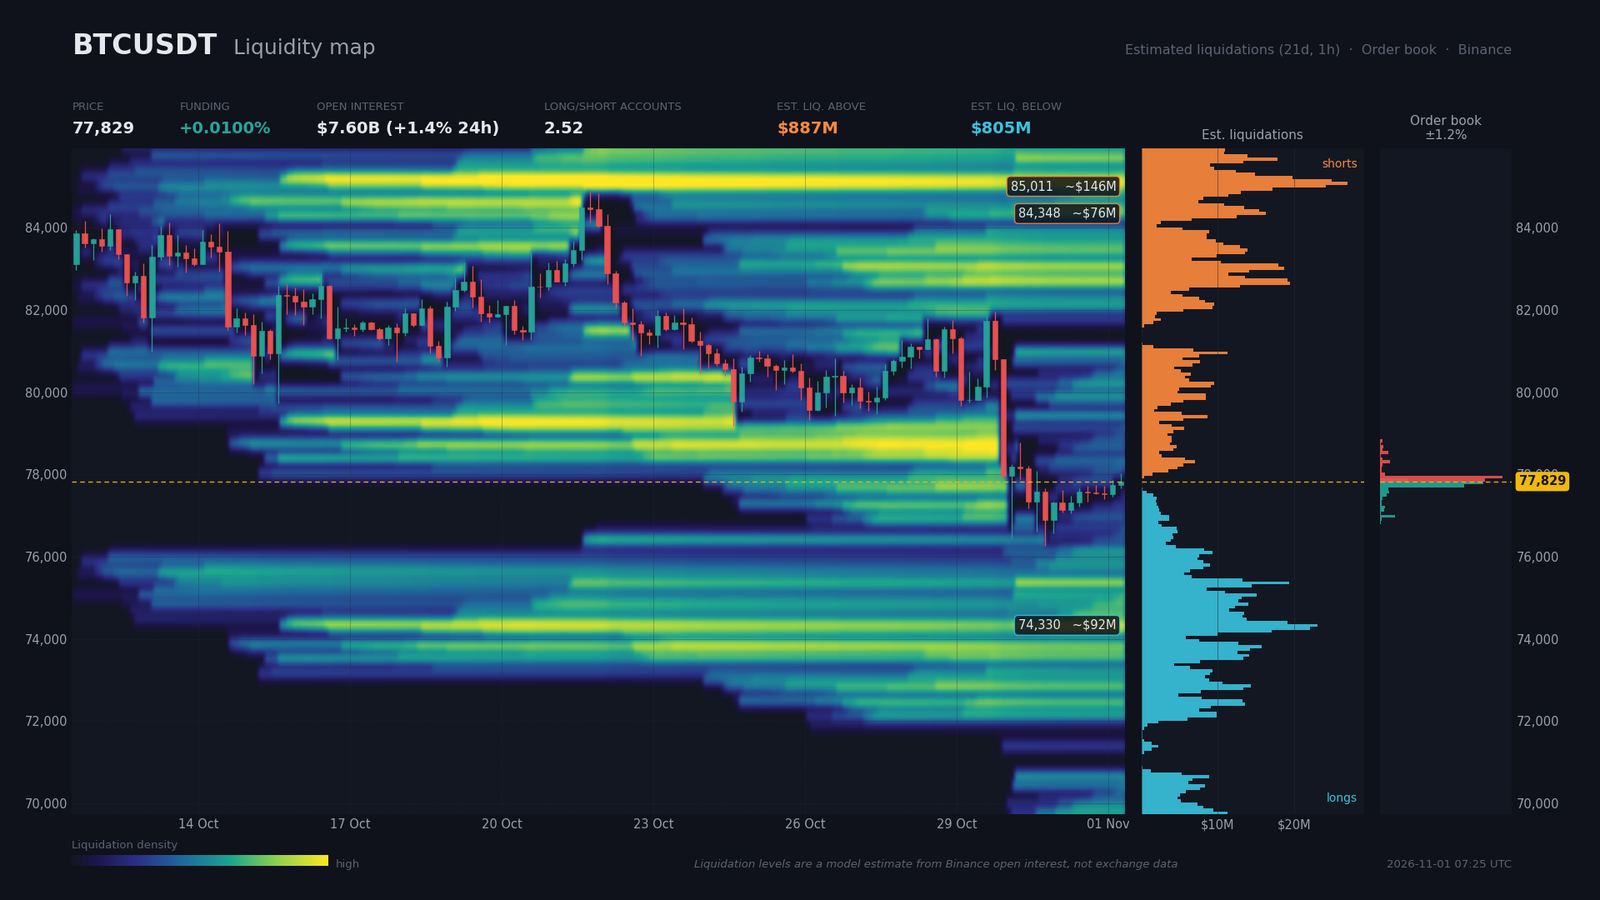
The Binance order book (perpetual and spot) covers only 1.25% around the price, so it speaks mainly to the very short term. Sell walls sit at $77,866 ($24.7M) and $77,939 ($28.8M), then at $78,308 ($2.3M) and $78,529 ($1.9M). Buy walls are at $77,792 ($24.3M), $77,718 ($19.8M) and $76,982 ($3.4M). Within a 2% window, bids total $62.8M against $62.4M of asks, an imbalance of just 0.3%, consistent with the 15m compression.
Estimated liquidation zones (a model based on open interest changes, not a measured figure) total about $887M above the price: $85,010 (~$146M), $84,350 (~$76M) and $83,100 (~$71M). Below, long liquidations total about $805M: $74,330 (~$92M), $74,850 (~$44M) and $73,810 (~$48M). Funding is low at 0.01% (10.9% annualized), open interest stands at $7.6B (+1.41% over 24 hours), the account long/short ratio is 2.52 and the top-trader ratio 1.67, while the 24-hour taker buy/sell ratio reads 1.046. This configuration points to a retail base heavily long, which fuels the risk of a liquidity sweep toward $74,300 to $74,900 if $76,270 gives way. Conversely, a squeeze toward $83,100 remains possible, but it would first require a break above $80,500.
Calendar: Catalysts to Watch
The next ten days are dense with releases. The U.S. midterm elections on November 3 and the average hourly earnings report on November 6 are the most likely to pull the price out of its current structure, with the November 2 manufacturing PMI as the first spark.
- November 2, 16:00 (Zurich) — Final U.S. manufacturing PMI (consensus 54.7; previous 52.7): a strong print would feed expectations of further rate hikes.
- November 3, 01:00 and 16:16 (Zurich) — U.S. midterm elections: political volatility risk, with the Binance hack already fueling the debate (Cointelegraph, October 31).
- November 4, 11:00 (Zurich) — Euro area flash inflation (consensus 3.9%; previous 3.8%): an upside surprise would reinforce the restrictive central bank narrative.
- November 5, 13:00 (Zurich) — Bank of England decision (consensus 4.00%; previous 3.75%): a hike would be read as a signal of broader tightening.
- November 6, 14:30 (Zurich) — U.S. average hourly earnings m/m (consensus 0.3; previous 0.1): an upside surprise would strengthen the Fed tightening scenario.
Three Scenarios for the Coming Weeks
The probabilities below reflect the analyst’s weighting over a horizon of several weeks, with the macro releases marking the milestones.
Scenario A — Rejection Below $78,800 and Retest of the Low (probability 50%)
Catalysts: the November 2 PMI at 16:00 and the November 3 elections. The trigger is a failure below $78,100 to $78,800 (15m levels at $78,146 and $78,777, 4H 20-period SMA ~$78,300). The path leads to $77,560, then $76,430, the 4H triple-top target and the area of the daily 100-period SMA. Target 1 sits at $76,400, for a risk-reward ratio (R:R) of about 1.75 from an entry at $78,500. Execution zone: sell between $78,300 and $78,800. Invalidation: a 4H close above $79,700 (4H 50-period SMA and the $79,180 neckline), about 1.4 4H ATR ($786) above entry.
Scenario B — Downside Liquidity Sweep (probability 25%)
Catalyst: a hawkish surprise, with a strong PMI or wages above expectations on November 6, or fresh negative news on the hack. Trigger: a 4H close below $76,270. The path targets $74,900 (daily support at $74,909), then $74,300 (estimated long pocket), with a risk of extension toward $73,150 to $73,800 (200-period SMA). Target at $74,300, for an R:R of about 1.5. Execution zone: sell on a break or retest of $76,000 to $76,300. Invalidation: a return and 4H close above $77,100, about 1.4 4H ATR above $76,000.
Scenario C — Bullish Invalidation: Short Squeeze (probability 25%)
Catalyst: political relief after November 3 or ETF flows turning positive again. Trigger: a 4H close above $79,960 (4H SuperTrend), then above $80,480. The path leads to $82,700 (4H resistance), $83,100 to $83,400 (estimated short pocket and daily SuperTrend), then $84,340 (neckline of the unconfirmed double bottom). R:R of about 1.7 toward $82,740 for a buy on retest. Execution zone: buy between $80,100 and $80,500. Invalidation: a 4H close below $79,150 (triple-top neckline), about 1.7 4H ATR below entry.
Synthesis and Conclusion
The current phase is a bearish markup in stabilization: the daily double top and the 4H triple top are confirmed, and their targets are nearly reached. The Binance shock has been absorbed without capitulation, which tempers the decline. However, hesitant ETF flows (outflows of $636M and $138M on October 22 and 23, after two large inflows) and a Fed that leaves hikes on the table do not allow a conclusion of accumulation, given the lack of flow data after October 23 and of on-chain data.
The dominant technical strategy is to sell rallies toward $78,100 to $78,800 as long as the 4H stays below $79,960, with protection above $79,700 on a 4H close. A break of $76,270 opens $74,300 to $74,900, while a 4H close above $80,500 would invalidate this bias. The 15m wedge points to an imminent intraday impulse, likely without follow-through absent a macro catalyst.
Sources
- Binance says 90% of stolen assets replenished, targets Sunday withdrawals — Cointelegraph, October 31, 2026
- Binance Hack: Why Bitcoin Didn’t Crash Like It Did in 2018 — Decrypt, October 30, 2026
- What to Know About the $6.3 Billion Binance Hack — Bitcoin Magazine, October 31, 2026
- North Korea linked to $6.3B Binance hack by crypto investigators — Cointelegraph, October 30, 2026
- Binance $6.3B record hack sparks pre-election political chatter — Cointelegraph, October 31, 2026
- Binance Hack Shows Why Offshore Exchanges Need US Oversight, CFTC Chair Says — Decrypt, October 30, 2026
- Fed meeting recap: Warsh says central bank will host fewer rate-setting meetings — CNBC, October 28, 2026
- The Fed held interest rates steady, but these officials see more hikes coming soon — MarketWatch, October 30, 2026
- US spot Ethereum ETFs log record 23-day net outflow streak — Crypto Briefing, November 1, 2026
- Bitcoin ETF Flow (US$m) – Farside Investors — farside.co.uk, date not specified
- Bitcoin price holds above $81,000 as ETF outflows weigh on sentiment — Yahoo! Finance, October 17, 2026
- Chainalysis says hacker using ‘offensive agentic techniques’ accessed its customers’ names and emails — The Block, October 31, 2026
- Mike Flaum: MSTR Performance “Massively” to the Upside During Next BTC Bull Run — Bitcoin Magazine, October 31, 2026
- Tether’s excess reserves nearly double to $8B as Q3 profit hits $1.5B — Cointelegraph, October 30, 2026
- SEC Proposes Custody Rule Updates and Crypto Custody Framework — Sewkis, October 15, 2026
Disclaimer: This article is for educational and informational purposes only. It does not constitute investment advice, a recommendation to buy or sell, or an invitation to trade any financial asset. Cryptocurrency markets are extremely volatile; any investment decision should be based on your own research (DYOR) and, where appropriate, the advice of a licensed financial adviser.

