


Bitcoin is trading in a fragile equilibrium on October 22, 2026, with price at $82,519 after a 1.8% pullback on the current daily candle. The notable high remains $87,385, set on September 21 and 5.6% above the current price, while the last major low, $74,909 on September 15, sits roughly 10% lower. Since late September the market has oscillated in a $79,700–$87,400 range, and the October 21 bounce toward $84,875 on the H4 chart evaporated within hours.
The immediate driver lies more in derivatives and sentiment than in macro. The market had emerged from an October dip below $80,000, with a low near $79,711 according to Decrypt (October 21), before a 6% rebound fueled by SpaceX results. The company reported third-quarter revenue of $14.58B (+161%) and is studying a merger with Tesla (CNBC, October 21). Together the two groups hold 30,221 BTC (Decrypt, October 21), a point that feeds the corporate treasury narrative. Leverage, however, has not followed: Binance funding remains slightly negative (-0.002%), open interest is down 2.2% over 24 hours, and the Fear & Greed index sits at 55, a neutral reading (Decrypt, October 21). The long/short ratio stays above 1, but the rebound looks more like a lightly leveraged advance.
Macro data, meanwhile, argues against the rebound. US inflation for September came in at 3.7% year on year against 3.6% expected (Decrypt, October 21), and core producer prices surprised to the upside on October 15 at 0.7% versus 0.3% expected, with no documented price reaction. Brent trades near $108 and the 10-year Treasury yield stands at 5.09%. The Fed funds target sits between 3.75% and 4% after a September hike. CME FedWatch implies roughly 80% odds of a hold on October 28, and a December increase is already widely priced in: BMO estimates about 90% and expects yields to break out of their range around the FOMC (CNBC, October 22). Stress in leveraged AI infrastructure names also weighs on risk appetite. CoreWeave has fallen 29% in October, its five-year CDS trades near 1,067 basis points and its unsecured debt yields about 15% (CNBC, October 21). Chinese data released on October 19 beat expectations, with no documented effect on the trend.
On flows, US spot ETFs took in $241M in the week to October 2 (Blockchain Council, October 6), then recorded $487M of net outflows on October 7 (SoSoValue, via CryptoTicker, October 8). No more recent flow data is available. Institutionally, Standard Chartered agreed to acquire custodian Zodia Custody and Grayscale expanded in-kind subscriptions to ten crypto products (Bitcoin Magazine and The Block, October 21). The SEC cleared 3x leveraged BTC and ETH ETPs on October 2, though they are not yet listed (CryptoTicker, October 4), while the ABA criticized the OCC’s final GENIUS Act rules (Cointelegraph, October 21). Finally, a wallet linked to the Drift exploit moved 44,510 ETH ($109M) to Tornado Cash in two days (Cointelegraph, October 21). On-chain Bitcoin data is not available in the sources reviewed. The verdict is split: institutional flows and a return of risk appetite support the bounce, while inflation, yields near 5% and the prospect of a rate hike argue against it. Technical signals should therefore be read with that neutralizing backdrop in mind.
Multi-Timeframe Technical Analysis
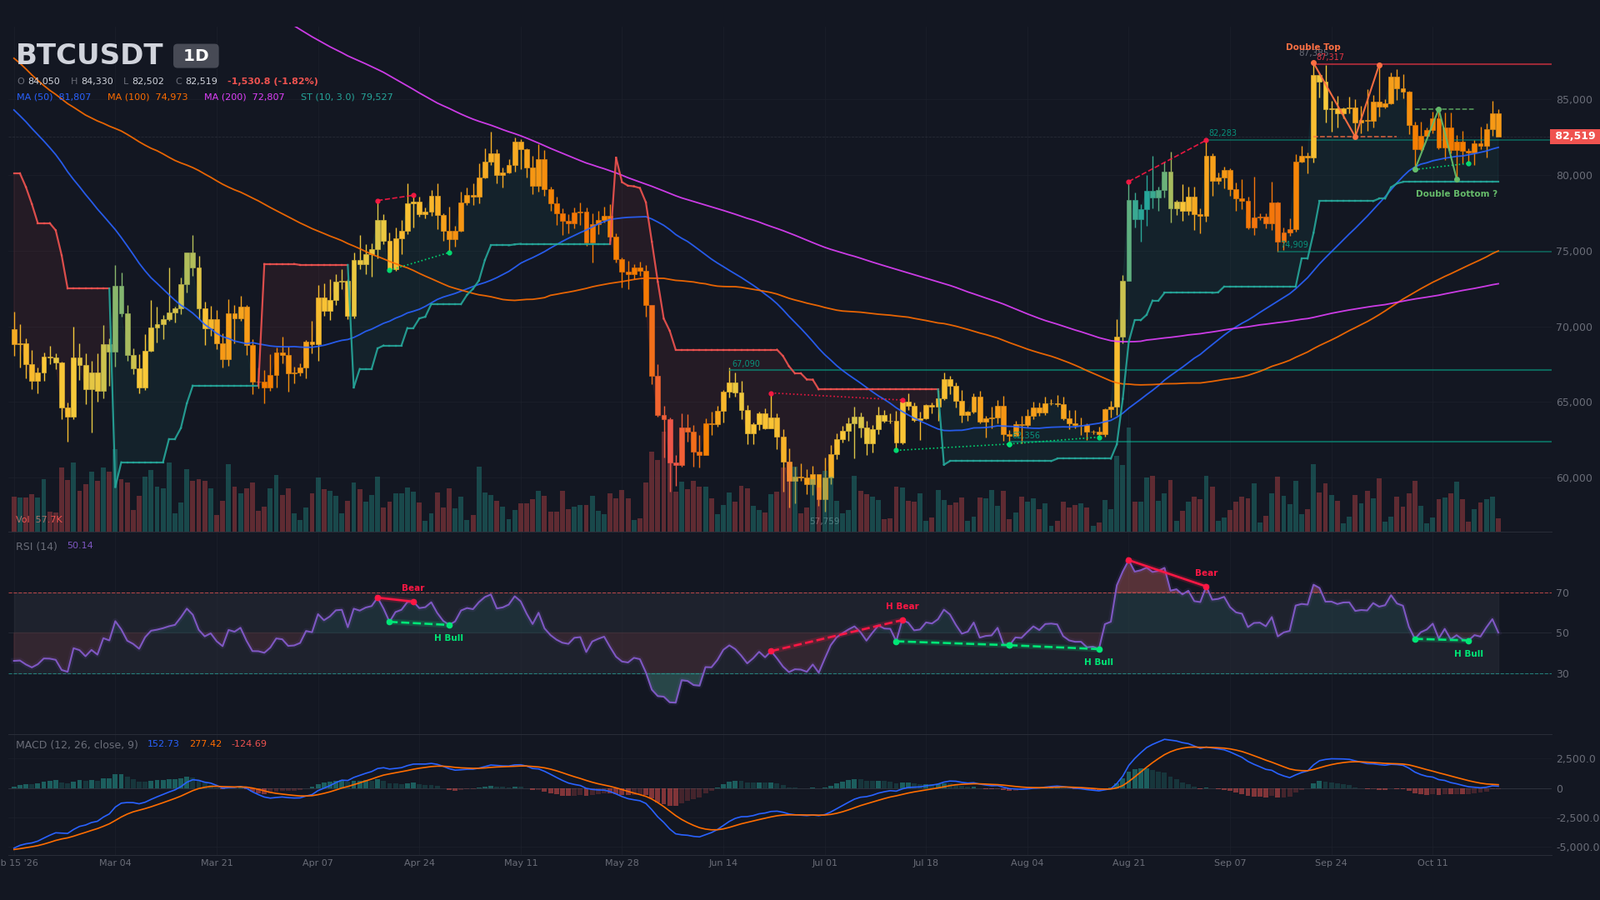
Daily Timeframe (1D): Consolidation Under a Double Top
The primary trend remains bullish on the daily chart (1D), with price above the 50-period simple moving average (SMA50 at $81,800) and the SMA200 at $72,800. The bullish 50/200 crossover, or golden cross, dates from September 8 and has been in place for 44 candles. The current phase, however, is consolidation: price sits below the SMA20 ($83,100) and the daily pivot ($83,840), while the SuperTrend stays bullish at $79,530. The current candle, with volume at 45% of its 20-period average, remains provisional.
Two patterns compete. A bearish double top is confirmed by the algorithm, with a neckline at $82,500 and a target at $77,680. Price sits precisely on that neckline, which has therefore not yet been invalidated. A bullish double bottom is not confirmed and remains a hypothesis: its neckline is at $84,340, with a target at $88,640, and only a daily close above $84,340 would validate it. The RSI (relative strength index) reads ~50, neutral, down from ~57 eight sessions earlier. A hidden bullish divergence, running from October 8 to October 17 with higher price lows against lower RSI lows, favors continuation but remains fragile. The MACD (moving average convergence divergence) has sat below its signal line since the bearish crossover on September 29, 23 candles ago. It remains above zero, but its histogram is negative: momentum is fading without a structural break.
Intermediate Dynamics (4H): Symmetrical Triangle and Failed Bullish Patterns
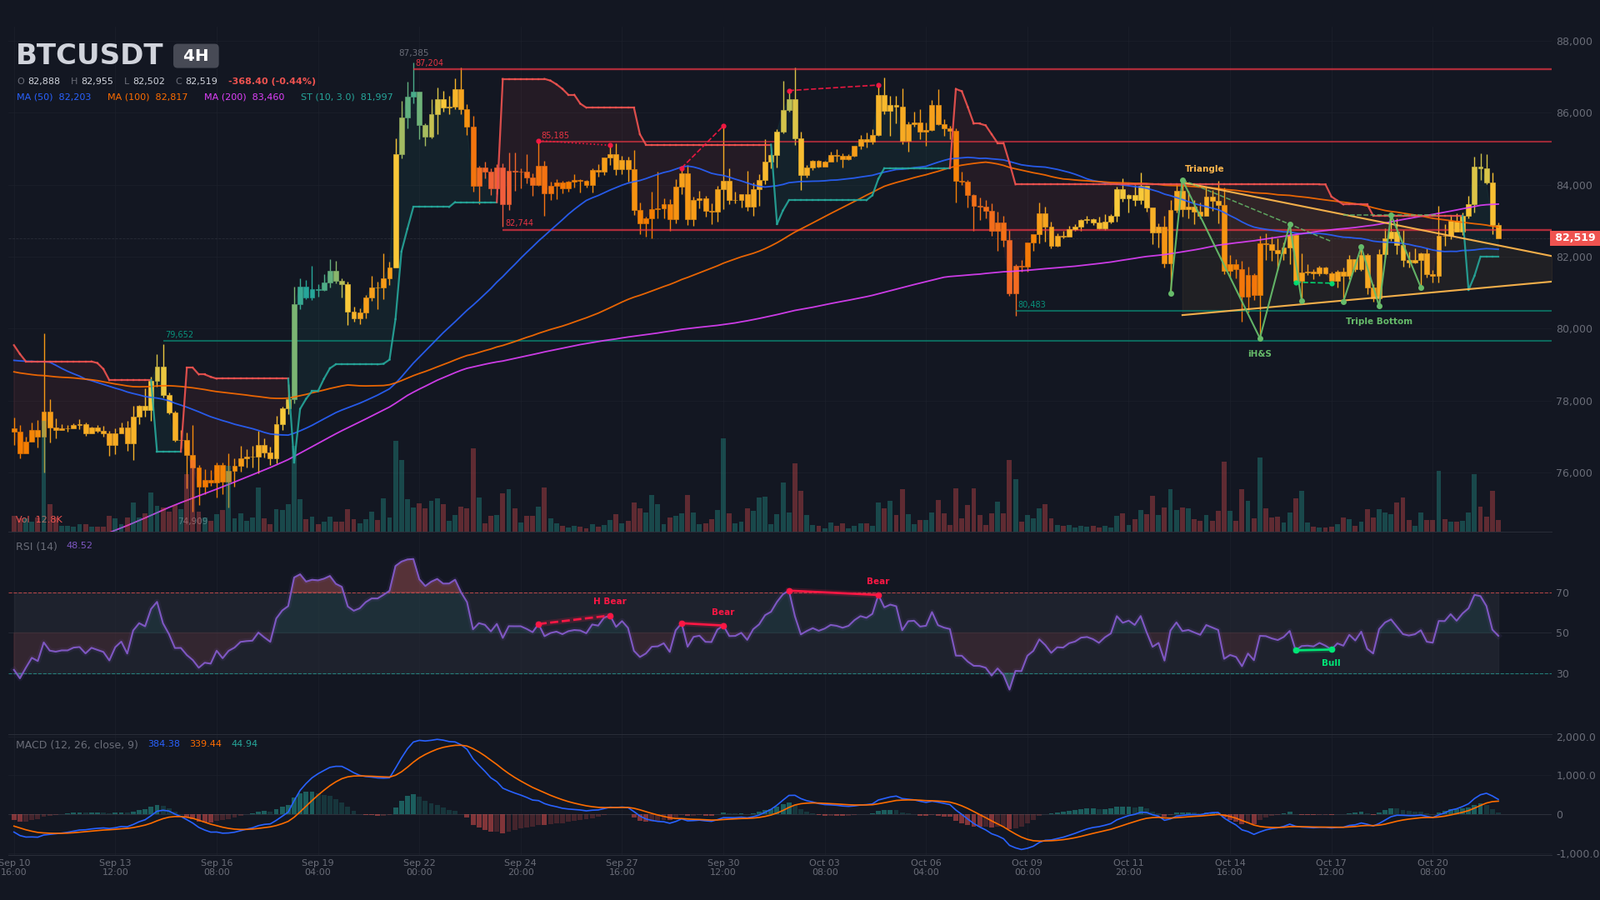
On the 4-hour chart (4H), a symmetrical triangle has been forming since October 13, between $80,975 and $82,743, with an apex estimated for October 26 near 03:00 Zurich time. Price at $82,519 sits inside the triangle, on volume at 53% of average. Two bullish patterns are flagged as confirmed by the algorithm: a triple bottom (neckline $83,160, target $85,480) and an inverse head and shoulders (neckline $82,900, target $86,270). Yet price has slipped back below both necklines after the October 21 spike to $84,875. That points to a failed validation, still to be confirmed: until $82,900 is reclaimed on a 4H close, these targets remain theoretical.
The RSI has cooled to ~49 from ~68 on October 21. The MACD remains above its signal line following the bullish crossover on October 20 at 12:00, with a positive but weak histogram, and a regular bullish divergence from October 16 to 17 had supported the bounce. Price trades below the SMA20 ($82,700) and the SMA200 ($83,460), but above the SMA50 ($82,200). The bearish 50/200 crossover of October 16, 33 candles old, shows a medium-term structure that is still hesitant. The bullish 4H SuperTrend sits at $81,997. Supports lie at $80,480 and $79,650, and resistances at $82,740 (three contacts) and $85,190.
Intraday Structure (15m): Wedge Compressed Into Oversold Territory
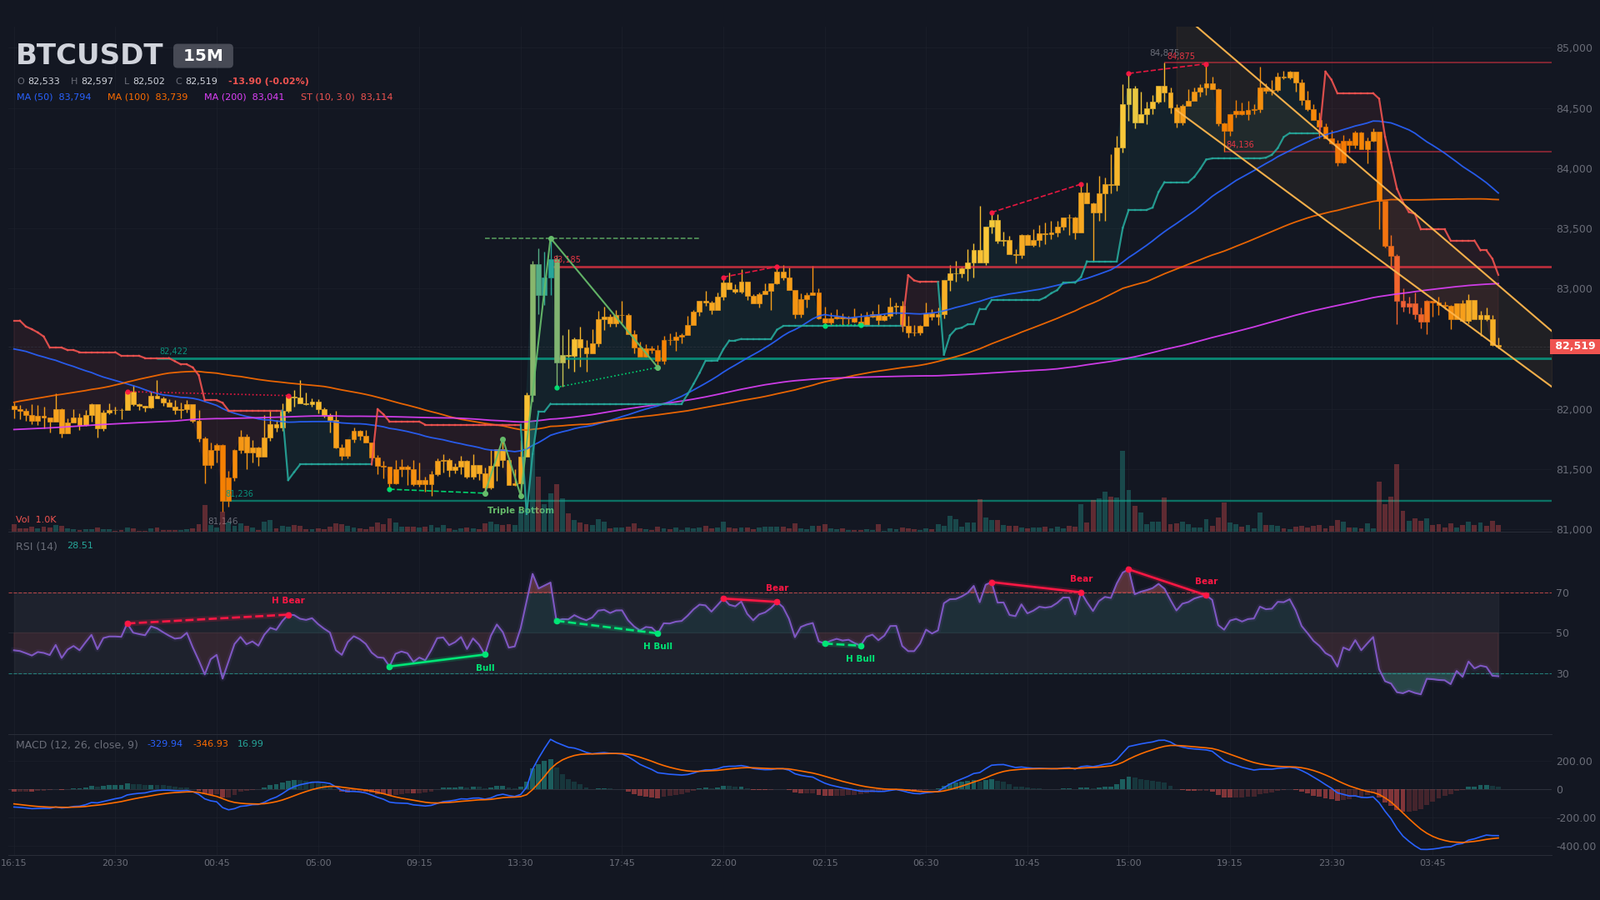
On the 15-minute chart, a wedge began on October 21 at 17:00, bounded by an upper line at $83,240 and a lower line at $82,694, with an apex estimated near 04:00 on October 23. Price at $82,519 sits below the lower boundary, a downside break that still needs confirmation. The SuperTrend is bearish at $83,114, and price is below its SMA20, SMA50 and SMA200 ($82,840, $83,790 and $83,040). A regular bearish divergence between 15:00 and 18:15 on October 21, with RSI falling from 81 to 69, preceded the drop from $84,875 toward $82,500.
The RSI at ~29 is in oversold territory, and the MACD shows a bullish crossover at 05:15 below zero, with a barely positive histogram. This is a technical rebound signal, not a reversal. Supports to watch are $82,420 (five contacts) and $81,240 (three contacts), with resistances at $83,190 (four contacts) and $84,140. Volume stands at 41% of its average, with an ATR (average true range) of $194.
Multi-Timeframe Summary
| Timeframe | Dominant Trend | RSI (14) | MACD | Chart Pattern |
|---|---|---|---|---|
| Daily (1D) | Bullish (range $79,700–$87,400) | ~50 | Bearish crossover on September 29, above zero | Confirmed double top / unconfirmed double bottom |
| 4-Hour (4H) | Neutral (compression) | ~49 | Bullish crossover October 20, weak momentum | Symmetrical triangle |
| 15-Minute (15m) | Bearish (technical rebound possible) | ~29 | Bullish crossover below zero | Wedge broken to the downside |
Technical Levels and Pivot Map
The map combines classic pivot points (Daily: P $83,840, S1 $82,805, S2 $81,560; H4: P $83,280), detected supports and resistances, order book walls and estimated liquidation pockets. No Fibonacci extension is retained. Classic pivots sit above the market, so the short-term pivot zone we retain is $82,300–$82,600, where the daily support, the double top neckline and the main bid wall converge.
| Level | Price (USD) | Category | Technical Basis |
|---|---|---|---|
| Major Resistance 3 (R3) | $87,200–$87,400 | Resistance | September 21 high ($87,385), daily resistance ($87,317, two contacts), H4 resistance ($87,204, three contacts) |
| Major Resistance 2 (R2) | $85,000–$86,100 | Resistance / liquidity | Daily pivot R1 ($85,085) and R2 ($86,120), H4 resistance ($85,185), estimated short pockets ($85,066 and $85,907) |
| Immediate Resistance (R1) | $82,750–$83,200 | Resistance | H4 resistance ($82,744, three contacts), H4 necklines ($82,900 and $83,158), 15m resistance ($83,185, four contacts) |
| Central Pivot (P) | $82,300–$82,600 | Pivot | Daily support ($82,283), double top neckline ($82,500), 15m support ($82,422), bid wall ($82,494) |
| Immediate Support (S1) | $81,200–$82,000 | Support | H4 SuperTrend ($81,997), estimated long pocket ($81,505), daily pivot S2 ($81,560), 15m support ($81,236) |
| Major Support 2 (S2) | $79,650–$80,500 | Support | H4 supports ($80,483 and $79,652), October 15 low ($79,732) |
| Major Support 3 (S3) | $78,600–$79,400 | Support / liquidity | Estimated long pockets ($79,280 and $78,686); double top target ($77,683) just below |
Order Book and Liquidity Heatmap
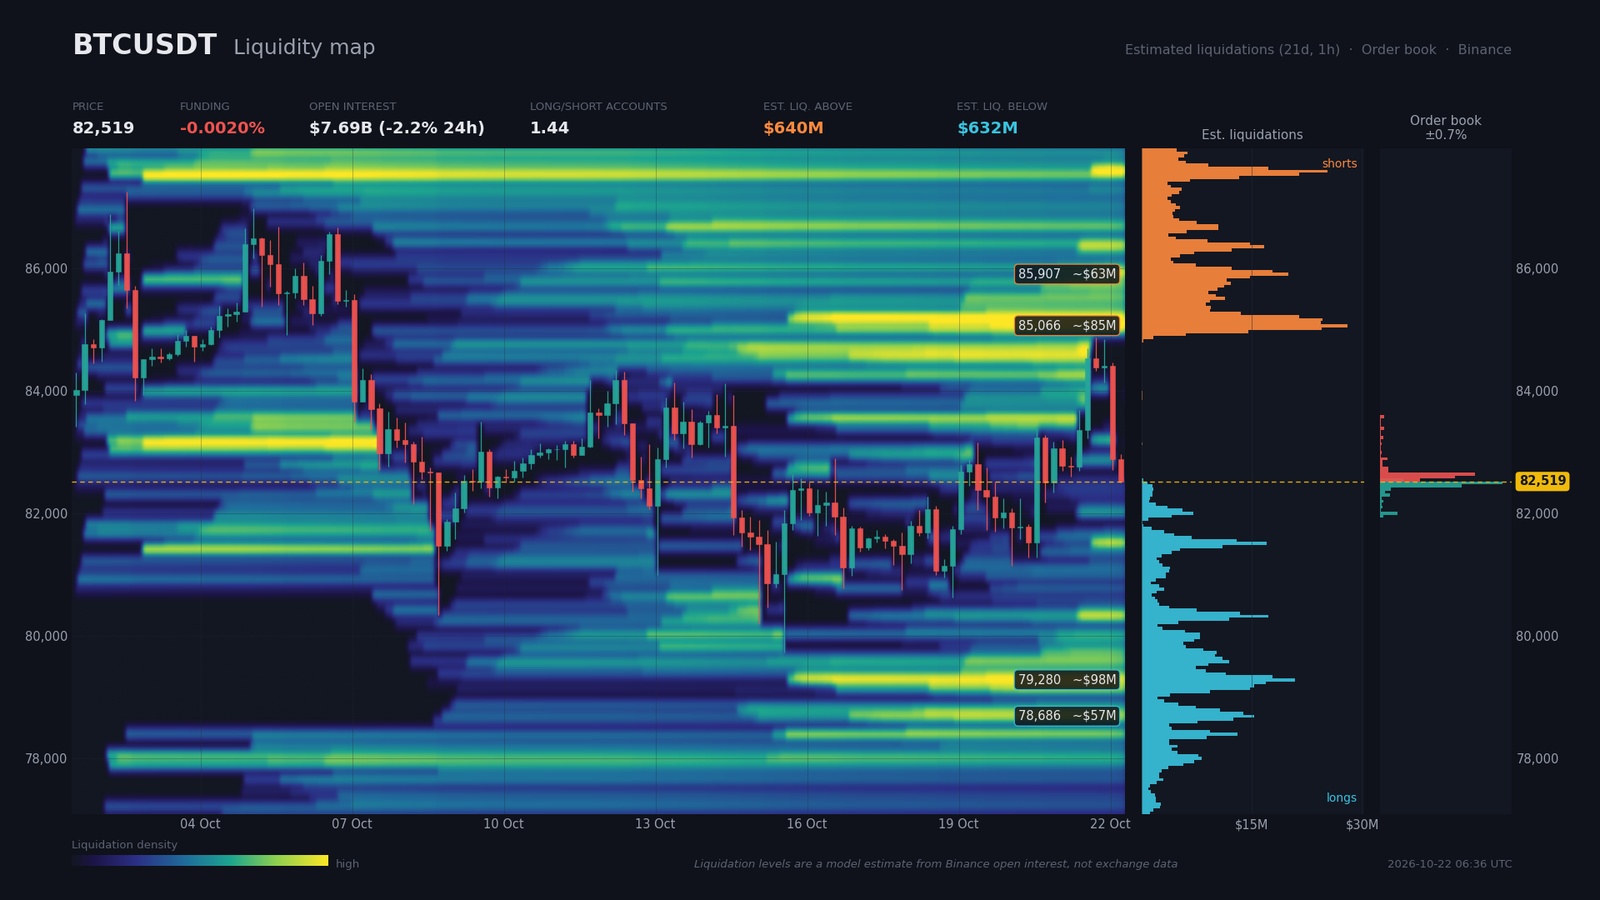
The order book is only visible up to 0.71% from price, so the overall 5% bid-side imbalance ($86M in bids against $78M in asks) remains a local phenomenon. On the sell side, $12.4M rests at $82,544, $23.0M at $82,593, $29.3M at $82,643 and $2.5M at $82,742, spanning +0.03% to +0.27%. On the buy side, $37.6M is posted at $82,494, $25.2M at $82,445, $3.2M at $82,396 and $5.3M at $82,000 (-0.63%). Price is wedged between two walls of comparable size.
The estimated liquidation zones (a model output, not measured data) are roughly symmetrical. Above, the short pocket near $85,066 would hold about $85M (+3.1%), the $85,165 zone about $61M and the $85,907 zone about $63M, for roughly $640M in total. Below, longs cluster around $79,280 (about $98M, -3.9%), $78,686 (about $57M) and $81,505 (about $36M, -1.2%), for roughly $632M. Annualized funding is -2.2%, and open interest stands at $7.69B (-2.2% over 24 hours, +4.0% over seven days). The long/short ratio is 1.44 across accounts and 1.46 among large traders, while the taker buy/sell ratio is 1.01.
The consequence is a moderate squeeze risk: negative funding signals that sellers are paying to hold positions, and the $85,000 short pocket acts as an upside magnet. A liquidity sweep toward $81,500, or even $79,300, remains plausible because those zones are closer and denser in volume.
Calendar: Catalysts to Watch
Recent releases did little to move the market: the October 21 rebound is attributed by the press to SpaceX rather than to UK or Japanese inflation figures, and the market reaction to remarks by Bailey and Warsh is not documented. Three high-impact events stand out, and the H4 triangle apex on October 26 could anticipate the move. No Deribit expiry or CME settlement appears in the agenda provided.
- Friday, October 23, 01:30 (Zurich) — Japan core CPI (consensus 2.1%, previous 1.7%): a surprise could revive the debate over BoJ policy and liquidity.
- Wednesday, October 28, 19:00 (Zurich) — FOMC rate decision (consensus 4, previous 4), press conference at 19:30: the event most likely to pull Bitcoin out of its current structure.
- Thursday, October 29, 13:30 (Zurich) — US advance GDP (previous 6.1): growth and yield implications in the wake of the Fed decision.
Three Scenarios for the Coming Weeks
The three scenarios below cover the horizon through the October 28 FOMC and the macro sequence that follows. Their probabilities total 100% and reflect a neutral bias with low conviction.
Scenario A — Technical Rebound and a $82,300–$84,300 Range Into the FOMC (probability 40%)
The technical rebound case requires the pivot zone to hold. The trigger is a defense of $82,300–$82,600 with the 15m RSI in oversold territory (~29) and a bullish 15m MACD, followed by a reclaim of $82,750 on a 4H close. The path leads to $83,190, then $84,340, the neckline of the daily double bottom. The R:R (risk/reward) is about 1.9 toward $84,340 from an entry at $82,450. Execution zone: $82,300–$82,600. Invalidation: 4H close below $81,500, implying a stop about $1,000 away, wider than the 4H ATR of $860.
Scenario B — Liquidity Sweep to $79,300, Then Recovery (probability 35%)
The sweep case requires a loss of $81,500 and then $81,200, which would trigger the estimated $79,280 long pocket. Rejection would then develop from $79,650–$80,500, with a recovery toward $81,500 and then $82,500. A possible catalyst is the H4 triangle apex on October 26, followed by the FOMC on October 28. Execution zone: $79,650–$80,500, after a recovery on a 4H close. Invalidation: 4H close below $78,700.
Scenario C — Range Breakdown and Double Top Confirmation (probability 25%)
The bearish case activates with a daily close below $79,700, the October 15 low at $79,732. The path targets the double top objective at $77,680, then the September 15 low at $74,910. A retest of $79,650–$80,500 from below would be the execution zone for short positions. A catalyst would be a FOMC more restrictive than expected on October 28, or inflation that cements a December hike. Execution zone: retest of $79,650–$80,500 from below. Invalidation: daily close above $82,500, with a stop at least one daily ATR away, or $2,100.
Conclusion and Key Takeaways
The overall reading is a range consolidation below $87,400 resistance, following the September impulse that carried price from $74,909 to $87,385. The most recent ETF flows, dated October 7 with $487M of net outflows, were unfavorable, and no fresher data is available. The October 21 rebound, mostly attributed to SpaceX, faded within hours, and the so-called confirmed H4 bullish patterns have not yet delivered: caution remains warranted.
The dominant technical strategy is to wait for a clear reaction around the $82,300–$82,600 pivot before acting. A tactical long approach from that zone is protected below $81,500. Any durable directional bias will require a daily close outside the range, above $84,340 or below $79,700. Critical levels to monitor: $82,300–$82,600 (pivot and double top neckline), $84,340 (daily double bottom neckline), $81,500 (estimated long pocket and scenario A stop), $79,650–$79,700 (range floor) and $87,200–$87,400 (range ceiling).
Sources
- Bitcoin Hits Weekly High as Crypto Market Rebounds — Decrypt, 21/10/2026
- Stocks making the biggest moves midday: SpaceX, Meta Platforms, Super Micro Computer, Roivant Sciences & more — CNBC, 21/10/2026
- Musk’s SpaceX-Tesla Merger Would Create a Bitcoin Treasury Behemoth — Decrypt, 21/10/2026
- U.S. Treasury yields may be poised for a breakout with Fed meeting as catalyst, says BMO — CNBC, 22/10/2026
- CoreWeave’s market confidence erodes as bond yields spike and stock sinks — CNBC, 21/10/2026
- Bitcoin ETF Inflows: How Institutional Money Affects BTC Price — Blockchain Council, 06/10/2026
- Bitcoin Cash: CME Futures Launch on October 19 — CryptoTicker.io, 08/10/2026
- SEC clears 3x leveraged Bitcoin and Ether ETPs — CryptoTicker.io, 04/10/2026
- Standard Chartered Signs Agreement To Acquire Crypto Custodian Zodia Custody — Bitcoin Magazine, 21/10/2026
- Grayscale expands in-kind subscriptions to 10 crypto ETFs and trusts — The Block, 21/10/2026
- American Bankers Association: OCC’s GENIUS rules ‘undermine’ US Congress — Cointelegraph, 21/10/2026
- Drift exploiter sends $109M in Ether to Tornado Cash in 2 days — Cointelegraph, 21/10/2026
Disclaimer: This article is for educational and informational purposes only. It does not constitute investment advice, a recommendation to buy or sell, or an invitation to trade any financial asset. Cryptocurrency markets are extremely volatile; any investment decision should be based on your own research (DYOR) and, where appropriate, the advice of a licensed financial adviser.

