


- Bitcoin trades at $67,150, oversold after a 23% slide from the $87,385 peak of September 21.
- Driver: $2.35B of net spot ETF outflows over two weeks and a Fed pricing in further rate hikes.
- To watch: US retail sales and Nvidia earnings on November 17, against the $68,900 – $69,300 pivot zone.
Bitcoin is trading deep in oversold territory at $67,150 on November 14, 2026, 23% below the $87,385 high reached on September 21. The slide has reached 11% over seven days and 18% over thirty. The $66,428 low printed on the 4H chart marks the latest leg of a liquidation phase triggered by the break of the SMA200 and the $76,270 structure.
Institutional flows remain the dominant force. According to Cointelegraph (November 14), US spot ETFs recorded $185.4M of outflows on Friday, after $1.07B in the week of November 9 to 13 and $1.28B the week before, or $2.35B over two weeks, the heaviest weekly pace since late June. BlackRock’s IBIT has now logged 11 consecutive sessions of outflows since October 30. On derivatives, U.Today (November 13, CoinGlass data) counted $1.65B of liquidations over 24 hours, 88% of them long positions and $920M on Bitcoin.
Macro is weighing on risk assets. US core CPI came in at 0.3% month on month on November 10 against 0.2% expected, and Bitcoin closed about 2% lower that day. On November 13, core producer prices were softer than expected (0.3% against 0.4%), but CNBC flagged an annual PPI at its highest in nearly four years and rising yields; Bitcoin lost 4.4% that day. CNBC (November 13) reports that markets now price a 25-basis-point hike in December and again in January, after the Fed’s first hike in three years in September. Chicago Fed President Austan Goolsbee said the central bank “has definitely got work to do” on inflation.
The rest of the backdrop is secondary. The Fed’s survey ranks AI as the top systemic risk for 87% of respondents, while MarketWatch floats, without measurement, the idea of crypto sales funding Anthropic’s IPO. On regulation, Coinbase National Trust Company received its final OCC approval (Cointelegraph, November 13), with no immediate price impact. This backdrop supports the bearish technical signal, which the three timeframes below confirm one by one.
Multi-Timeframe Technical Analysis
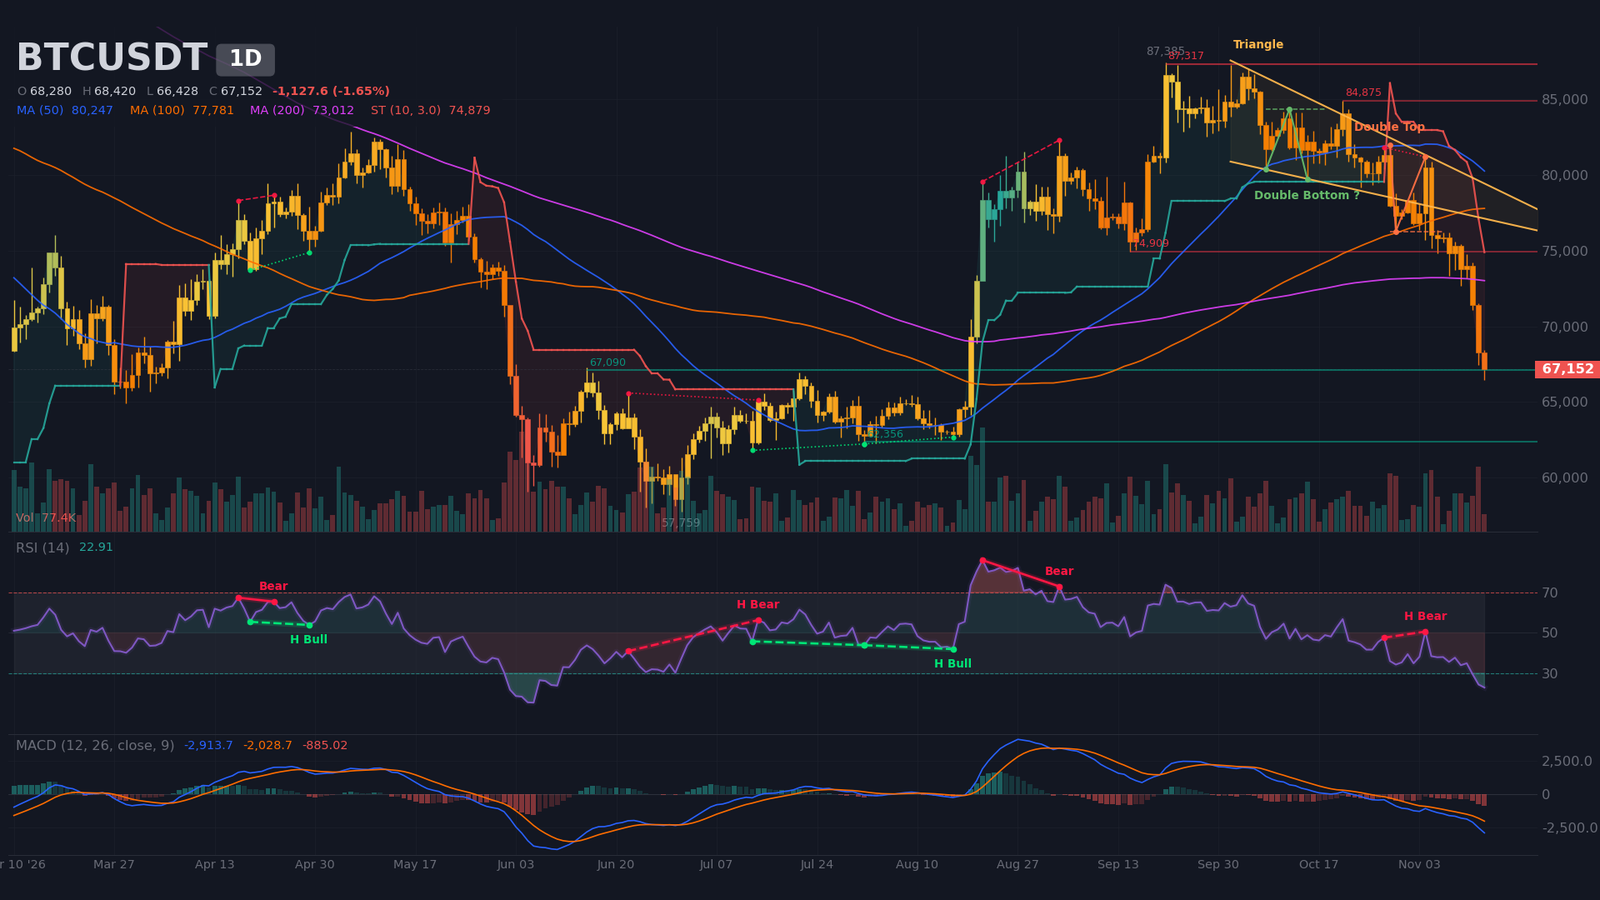
Daily Timeframe (1D): bearish breakdown in oversold territory below the SMA200
On the weekly chart, the move is a confirmed reversal rather than a simple correction: five consecutive weekly declines, a close below the weekly SMA20 (about $73,970) and the SMA10 (about $79,510). The weekly RSI at ~42 is far from oversold, leaving room for further downside. The current week shows a 10% decline.
On the daily chart, the trend is bearish with lower highs and lower lows, and the distribution phase has turned into a downside impulse. ADX (28) signals an established trend with DI- well above DI+. Price sits below the SMA20 ($76,030), SMA50 ($80,250) and SMA200 ($73,010), with no dated 50/200 crossover. Bollinger Bands are expanding and price has broken below the lower band ($68,620). The double top is confirmed, with neckline at $76,270 and objective at $70,970, a target already reached, so it no longer carries weight. The detected double bottom is unconfirmed, and the October wedge broke to the downside (lower boundary $77,980). On the major impulse from July 1 ($57,759) to September 21 ($87,385), price has retraced 68%, sitting between the 61.8% Fibonacci level ($69,080) and the 78.6% level ($64,100).
Daily RSI at ~23 is oversold and falling; only a recent hidden bearish divergence (continuation) from October 28 to November 4 is detected. MACD remains below its signal line and below zero since the bearish crossover of September 29 (46 candles), with a deep negative histogram. Volume on the November 13 candle reached 2.0 times its average, validating the breakdown and resembling capitulation, though without confirmation of a bottom. The volume profile point of control ($64,240) is the next magnet, inside the value area ($60,230 – $78,740).
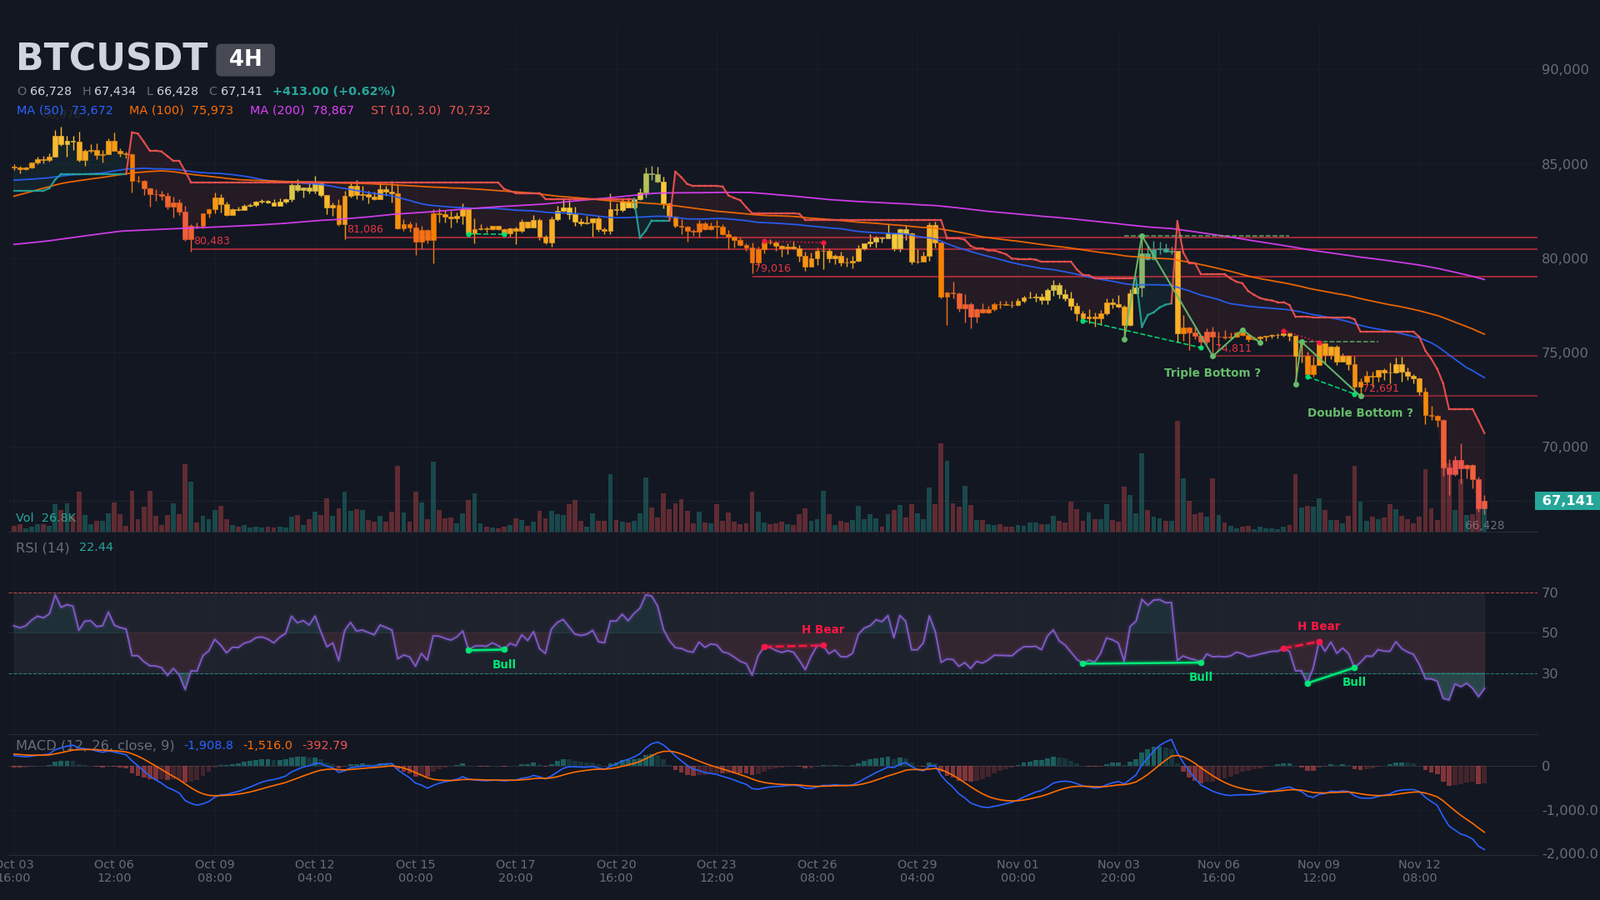
Intermediate Dynamics (4H): bearish extension in oversold territory below the averages
The 4H chart confirms the daily picture, with declining highs and irregular lows, a mixed reading. Price is below the SMA20 ($71,300), SMA50 ($73,670) and SMA200 ($78,870). ADX at 57 with DI- dominant describes a very strong trend, a possible sign of exhaustion that remains unconfirmed. Bands are at their widest in 120 candles. SuperTrend is bearish at $70,730, and price trades below the value area ($77,130 – $86,550), with the nearest volume nodes ($80,770 and $82,910) far above. Detected double and triple bottoms are unconfirmed and distant, so they carry no operational value. On the impulse from October 5 ($86,976) to November 14 ($66,428), Fibonacci rebounds sit at $71,280 (23.6%) and $74,280 (38.2%).
The 4H RSI at ~22 is oversold but rising from its low of 17 on November 13. The regular bullish divergence of November 9 to 10 was not validated, as price subsequently broke $72,800. MACD has been below its signal and below zero since November 12, with a negative histogram. Volume on the latest complete candle (November 14) is 1.7 times average, and the November 13 peak reached 2.9 times: selling is massive, closer to an exhaustion phase than an initial one.
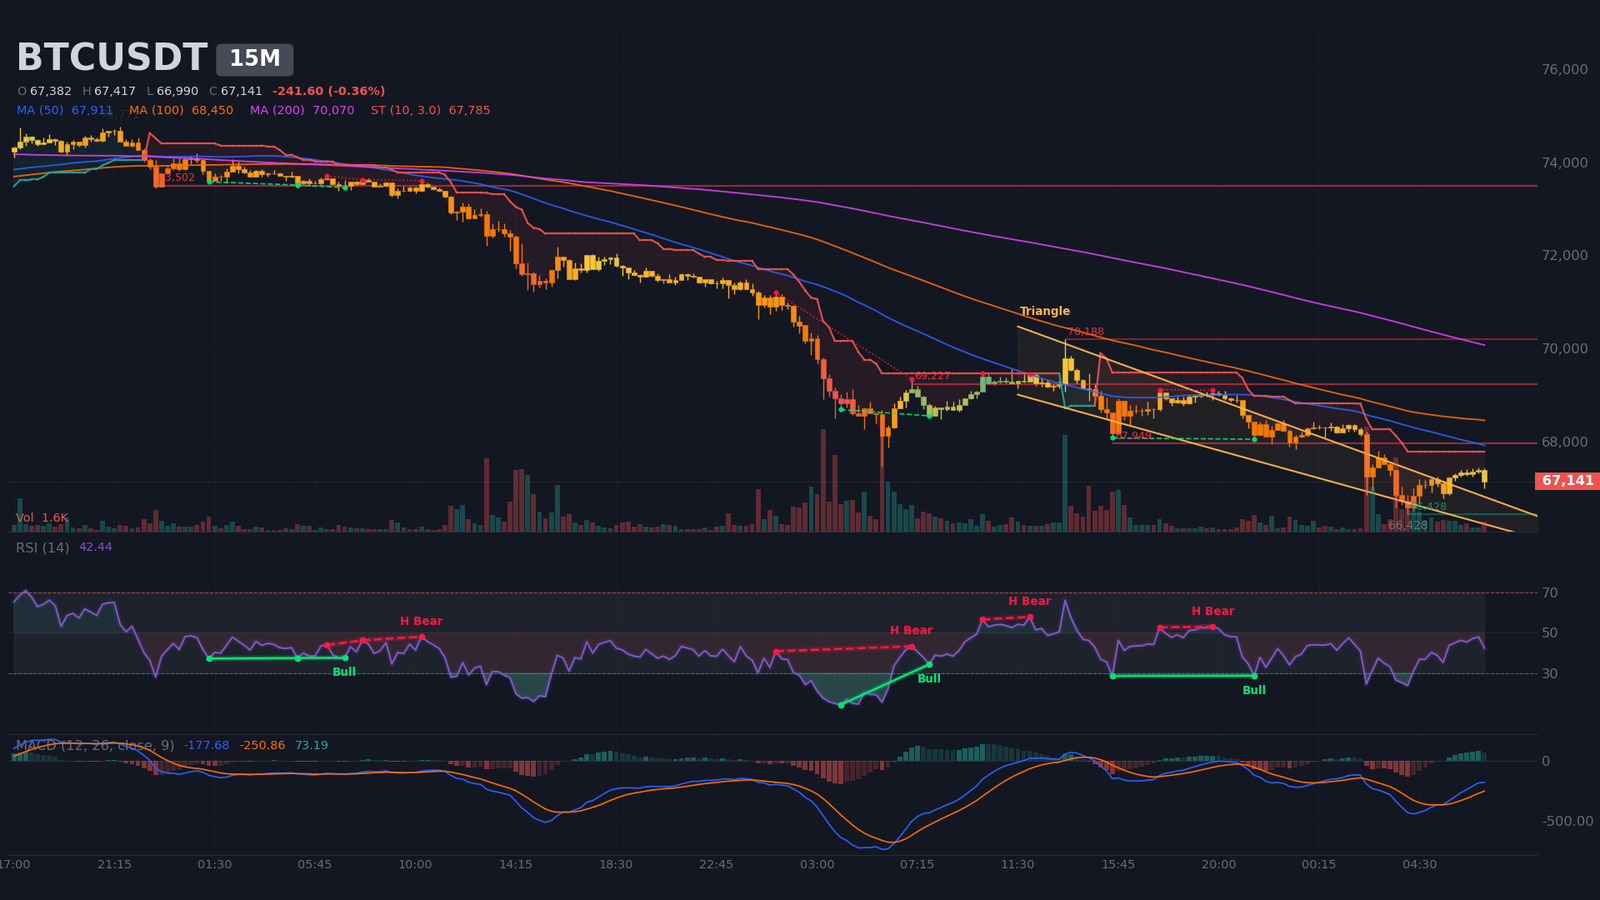
Intraday Structure (15m): compression wedge above the capitulation low
The 15-minute chart remains in a bearish trend (ADX 42, DI- dominant) but is compressing: a wedge is detected between $66,680 and $67,410, with an apex estimated late on November 14. Bollinger Bands are ordinary (1.6% width). RSI at ~42 is neutral, and MACD has crossed up but remains below zero. Price is below the SMA20, SMA50 ($67,910) and SMA200 ($70,070). The $66,428 low formed after a purge at 13.8 times average volume, typical of a liquidity sweep, and the latest complete candle carries only 21% of average volume: compression is happening on thin volume.
Useful boundaries are $66,430 – $66,680 below and $67,410 – $67,950 above, the latter a resistance with two contacts. A 15-minute close outside the wedge serves as a short-term trigger, never as a change of bias. The nearest bullish invalidation is resistance at $69,230.
Multi-Timeframe Synthesis
| Timeframe | Dominant trend | RSI (14) | MACD | Chart pattern |
|---|---|---|---|---|
| Daily (1D) | Bearish (impulse, ADX 28) | ~23 (oversold) | Below signal and zero, bearish crossover on 09/29 | Double top confirmed (target reached) |
| 4 hours (4H) | Bearish (ADX 57, exhaustion possible) | ~22 (oversold, rising) | Below signal and zero, bearish crossover on 11/12 | No confirmed pattern |
| 15 minutes (15m) | Bearish, compressing | ~42 (neutral) | Bullish crossover on 11/14, below zero | Compression wedge |
Key Levels Map and Pivots
The method combines daily and weekly pivots, Fibonacci retracements of the major impulse ($57,759 to $87,385), the daily SMA200, volume nodes, order book walls and estimated liquidation pockets. The short-term central pivot is P, at $69,070. The $68,900 – $69,300 pivot zone is the most important: it stacks the daily pivot, the 61.8% retracement ($69,076) and the M15 resistance at $69,227. It is the level that separates a technical rebound from a resumption of the decline. The detected support at $67,090, where price trades, remains an isolated level.
| Level | Price (USD) | Category | Technical basis |
|---|---|---|---|
| Major resistance 3 (R3) | $74,400 – $75,000 | Daily/H4 | R3 pivot ($74,739), detected resistance $74,909, daily SuperTrend $74,879, H4 resistance $74,811 |
| Major resistance 2 (R2) | $72,500 – $73,200 | Daily | Fibonacci 50% ($72,572), H4 resistance $72,691, daily SMA200 ($73,012), R2 pivot ($73,115) |
| Immediate resistance (R1) | $70,100 – $71,400 | Daily/H4 | M15 resistance $70,188, R1 pivot ($70,697), H4 SuperTrend ($70,732), double top objective ($70,969), Fibonacci 23.6% ($71,277 – $71,373) |
| Central pivot (P) | $68,900 – $69,300 | Daily | P pivot ($69,073), Fibonacci 61.8% ($69,076), M15 resistance $69,227 |
| Immediate support (S1) | $66,200 – $66,700 | Daily/M15 | S1 pivot ($66,656), November 14 low ($66,428), buyer wall and estimated long pocket at $66,289 |
| Major support 2 (S2) | $64,100 – $64,800 | Daily | Fibonacci 78.6% ($64,099), point of control ($64,239), estimated long pocket $64,353 – $64,818, weekly S3 pivot ($63,853) |
| Major support 3 (S3) | $62,200 – $62,650 | Daily | Detected support $62,356, estimated long pocket $62,262, daily S3 pivot ($62,614) |
Order Book and Liquidity Heatmap
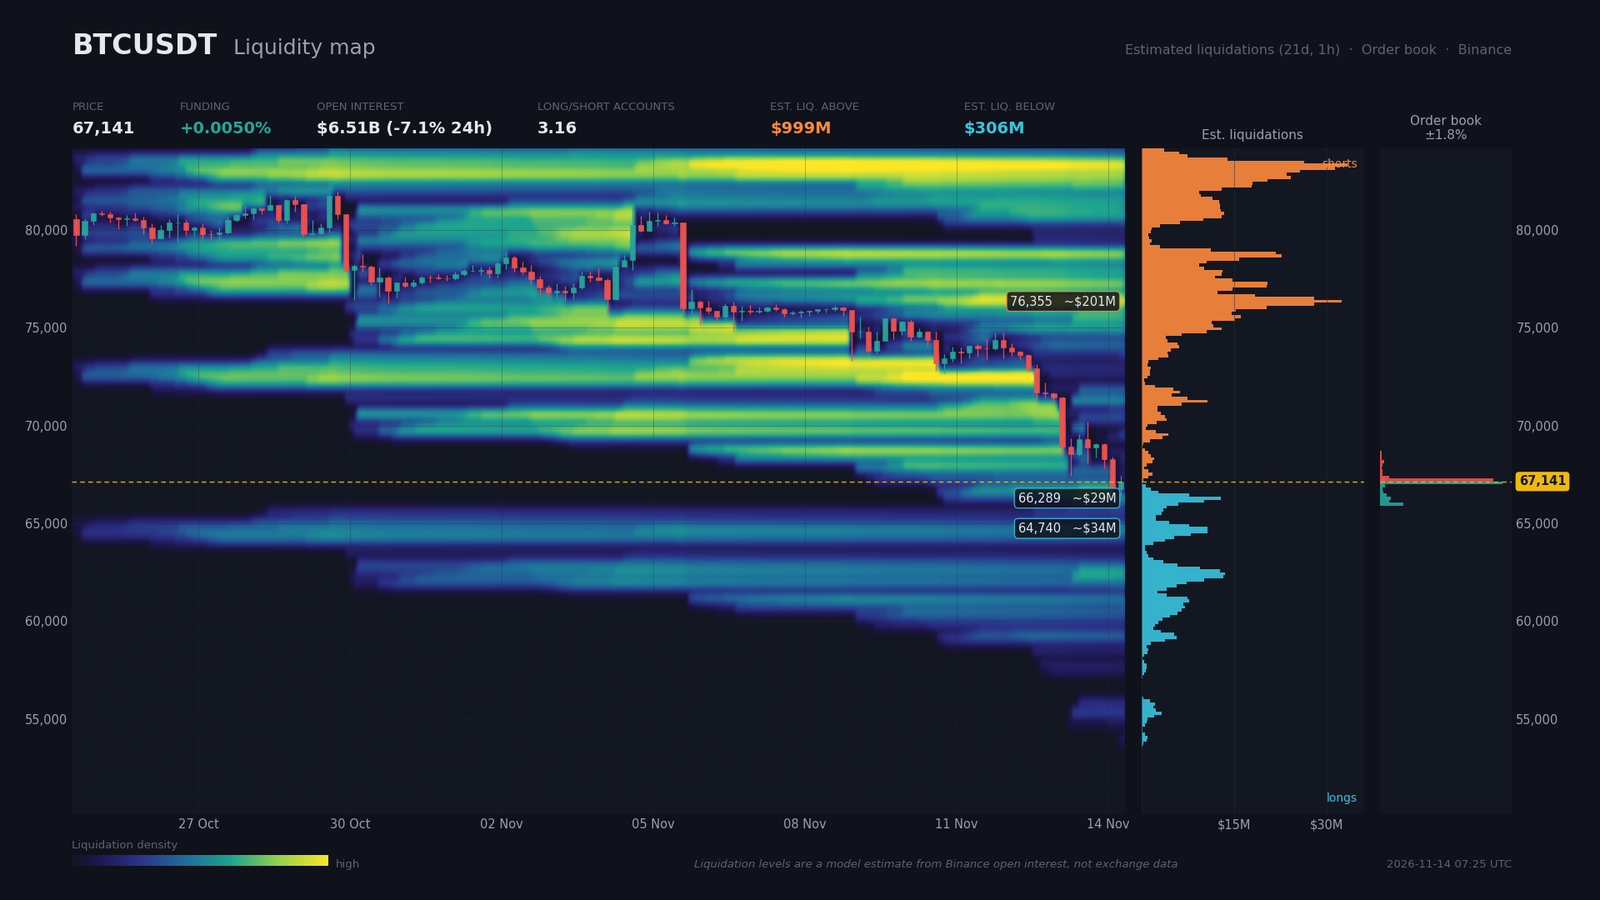
The order book is only visible across 1.83% around price, and depth is thin. Price is sandwiched between a $43.8M buy wall at $67,063 (0.12% below) and a $40.6M sell wall at $67,218 (0.12% above). Further walls are modest: $8.4M at $65,979 on the bid side and $3.1M at $67,373 on the ask side. The overall imbalance of 15.3% favors buyers ($66.6M against $48.9M within 2%), but depth is too shallow to decide.
Estimated liquidation zones (a model, not measured data) show an asymmetry. Above price, shorts total roughly $1B, including $201M between $75,350 and $76,740 (13.7% above), $93M near $80,700 and $239M near $83,320. Below, longs total about $306M: $29M at $66,290 (1.3% below), $34M at $64,740 (3.6%) and $22M at $62,260 (7.3%). This suggests a distant upside magnet and a nearby but shallow downside liquidity pool.
Funding is low (0.005%, or 5.5% annualized) and open interest, at $6.5B, has fallen 7.1% in 24 hours and 10.6% over seven days, confirming ongoing deleveraging. The account long/short ratio (3.16) shows a crowd still long, while the top traders’ ratio (1.96) is more measured, and the taker buy/sell ratio (0.92) confirms selling pressure. The likely consequence: a sweep below $66,200 toward the $64,740 pocket is possible, while a limited squeeze toward $69,000 remains plausible.
Calendar: Catalysts to Watch
No options expiry or CME settlement is listed in the calendar. Three events stand out as capable of pulling price out of its current structure.
- Monday, November 16, time not specified — Fed forum on AI and inflation in San Francisco, chaired by Kevin Warsh (Decrypt, November 13): a possible signal on the rate path.
- Tuesday, November 17, 14:30 (Zurich) — US retail sales ex-autos m/m (consensus 0.4%, prior 0.9%): a test of demand and of rate-hike expectations.
- Tuesday, November 17, time not specified — Nvidia quarterly results (U.Today, November 13): a volatility catalyst for risk assets, after the shock of Jensen Huang’s departure.
Three Scenarios for the Coming Weeks
The three scenarios cover a 1 to 2 week horizon. Their weighting reflects the 4/5 confluence score and the strength of ADX and selling ETF flows, but Daily and 4H oversold readings cap the main bearish case at 50%.
Scenario A — Rejected technical rebound, then resumption of the decline (probability 50%)
The trigger is a 4H rejection below $68,900 – $69,300 after a bounce from $66,400, with US retail sales and Nvidia on November 17 as possible accelerants. The path first targets $66,450 (S1), then $64,500 (S2), with a possible extension toward $62,400 (S3). The risk/reward ratio (R:R) is ($69,100 − $64,500) ÷ ($70,750 − $69,100) = 4,600 ÷ 1,650 = 2.8. Execution zone: sell at $69,100. Invalidation: 4H close above $70,750, a $1,650 stop, or 1.4 times the 4H ATR of $1,201.
Scenario B — Liquidity sweep below S1 followed by a V-shaped recovery (probability 30%)
The trigger is a wick below $66,200, at the estimated long pocket of $66,290, followed by a reclaim of $66,700 on a 4H close. The path leads first to $69,100 (P), then $71,000 (R1). The R:R is ($69,100 − $66,600) ÷ ($66,600 − $65,300) = 2,500 ÷ 1,300 = 1.9, rising to 3.4 at $71,000. Execution zone: buy at $66,600. Invalidation: 4H close below $65,300, a $1,300 stop, or about 1.1 times the 4H ATR.
Scenario C — Bullish reversal and invalidation of the bearish thesis (probability 20%)
The trigger is a daily close above $75,000, which reclaims the $74,900 zone where the daily SuperTrend and detected resistance sit. The path targets $76,350, an estimated short pocket, then $79,400, the 61.8% Fibonacci retracement of the recent impulse. The R:R is ($79,400 − $75,200) ÷ ($75,200 − $72,700) = 4,200 ÷ 2,500 = 1.7. Execution zone: $75,200. Invalidation: daily close below $72,700, a $2,500 stop, roughly 1 times the daily ATR of $2,419.
The signal to watch: a 4H close above $70,750 would shift scenario A toward B, signalling that the rebound is no longer rejected; a daily close above $75,000 would then open the door to scenario C.
Synthesis and Conclusion
The current phase is a bearish impulse in capitulation, inside a weekly reversal. ETF flows, with 11 consecutive outflow sessions on IBIT and $2.35B over two weeks, and a macro backdrop pricing further rate hikes, confirm the selling pressure. The drop in open interest and the heavy volume of November 13 point to deleveraging already well advanced, which makes a rebound probable without signalling a true reversal.
The dominant technical strategy is to sell rebounds below $69,300 rather than chase oversold weakness, with protection above $70,750 on the 4H and above $74,900 on the daily for the whole thesis. Key levels to track: the $68,900 – $69,300 pivot zone, S1 at $66,200 – $66,700 as the probable sweep zone, the S2 target at $64,100 – $64,800, then the daily SMA200 and R2 resistance at $72,500 – $73,200.
Sources
- Bitcoin ETFs Lose $2.35B as BlackRock Outflows Hit 11 Sessions — Cointelegraph, 14/11/2026
- Bitcoin ETFs saw $643M outflows Friday; 2026 barely green — CoinDesk, 02/11/2026
- $26 Billion Bitcoin ETFs Selloff Wipes Out Every 2026 Inflow — BeInCrypto, 06/11/2026 (date not confirmed)
- Nvidia Futures Top XRP in Crypto Liquidations as Jensen Huang’s Exit Sparks $2.14 Billion Surge — U.Today, 13/11/2026
- The common theme driving stocks lower — plus, 3 trades and another we want to make — CNBC, 13/11/2026
- AI risks are the biggest threat to the financial system, Fed survey finds — CNBC, 13/11/2026
- Chicago Fed’s Goolsbee says central bank ‘has definitely got work to do’ on inflation — CNBC Finance, 13/11/2026
- Fed Chair Warsh Wants Answers on AI Inflation—and Bitcoin May Feel the Impact — Decrypt, 13/11/2026
- Bitcoin could fall even further if investors cash out to buy into the Anthropic IPO — MarketWatch, 13/11/2026
- US regulators move ahead on crypto trust charters as Senate scrutiny grows — Cointelegraph, 13/11/2026
- SEC proposes crypto asset custody framework for investment advisers and regulated funds — A&O Shearman, 15/10/2026
- Bill Miller IV: “They’re Not Printing More Bitcoin” — Bitcoin Magazine, 13/11/2026
- Economic calendar provided (releases and agenda, Zurich time) — URL not provided
Disclaimer: This article is for educational and informational purposes only. It does not constitute investment advice, a recommendation to buy or sell, or an invitation to trade any financial asset. Cryptocurrency markets are extremely volatile; any investment decision should be based on your own research (DYOR) and, where appropriate, the advice of a licensed financial adviser.

