

Bitcoin enters early August 2026 in one of its tightest compression phases of the year. Trading around the strategic pivot of $64,950, the flagship asset sits at the intersection of a broadly supportive macro backdrop and a market microstructure shaken by a major security crisis. Between record psychological capitulation and opportunistic whale accumulation, our cross-analysis — macro, on-chain, and multi-timeframe technicals — maps out the scenarios for Q3 2026.
1. The Macro Backdrop: The Fed, US Jobs, and Global Correlations
Bitcoin’s valuation can no longer be assessed in isolation. The asset has firmly established itself as a long-duration instrument, with its risk premium closely tracking global monetary policy. Since late July 2026, market participants have significantly repriced the odds of further Federal Reserve rate hikes this year — a paradigm shift that acts as a powerful catalyst for non-yielding assets.
This dovish repricing rests on a measured cooling of the US labor market: the latest JOLTS report highlighted softening labor demand, with hiring tied to World Cup preparations falling short of expectations. A more pronounced deterioration in employment data over coming months would be the prerequisite for a clearer dovish shift — seen as a necessary condition for pushing BTC durably toward the symbolic $100,000 mark.
Bitcoin’s growing presence in institutional portfolios has also strengthened its correlation with major equity indices, particularly the S&P 500, which is trading at stratospheric levels (~7,710 points), alongside the Nasdaq 100 (~29,430 points), buoyed by hopes of monetary status quo. On the energy front, a relative easing of tensions around the Strait of Hormuz allowed Brent crude to stabilize around $82.35, easing inflationary pressure and reinforcing the Fed’s wait-and-see stance — a backdrop that also benefits gold (~$4,342) and Bitcoin by extension. One liquidity factor worth watching: the $100 billion unlock of newly tradable SpaceX shares could temporarily divert speculative capital away from digital assets.
| Macro Indicator | Current Value (Aug. 2026) | Impact on Bitcoin |
|---|---|---|
| S&P 500 | ~7,710 points | Positive — global risk appetite sustained |
| Brent Crude | $82.35 | Positive — reduced inflationary pressure |
| Gold | ~$4,342 | Neutral to positive — validates safe-haven thesis |
| Fed Rate Expectations | Hike probability declining | Highly positive — favors long-duration assets |
2. Regulation, Taxation, and Industry Dynamics
The US legislative landscape remains mixed. The long-awaited CLARITY Act, meant to establish a definitive framework for client fund segregation and exchange bankruptcy protection, remains stalled in the Senate — prediction markets like Polymarket now assign it only a 14% chance of passage before year-end 2026. On the other hand, the Bitcoin Policy Institute is running an intensive lobbying campaign targeting nineteen congressional offices to push through a de minimis tax exemption for small BTC transactions — a reform that, if passed before midterm election gridlock sets in, could catalyze mass commercial adoption.
Meanwhile, the center of gravity for institutional adoption keeps shifting toward Asia, exemplified by the Bitcoin Asia 2026 conference in Hong Kong later this month. On the mining front, Q2 reports confirm a deliberate hoarding strategy: American Bitcoin grew its reserves to roughly 8,300 BTC (the world’s 16th-largest corporate treasury), while BitFuFu reported 14.2 EH/s of managed hashrate and 112 BTC produced in July. Having absorbed the halving shock, miners are no longer forced to systematically liquidate output, mechanically drying up part of the structural sell pressure.
3. The Coldcard Shock: When Self-Custody Falters
In early August, market microstructure was violently rattled by the discovery of a critical vulnerability affecting Coinkite’s Coldcard hardware wallets. Its root cause traces back to a firmware change from March 2021, which replaced a secure hardware component with a predictable software pseudo-random number generator. The result: instead of the standard 128 bits of entropy, affected models produced only about 72, allowing attackers to reconstruct private keys entirely offline via brute force — with no physical access and no phishing required.
A first wave drained 594 BTC in just twenty-five minutes in late July. By early August, confirmed losses were estimated at a minimum of 1,596 BTC, with total potential damage projected around 2,055 BTC — over $130 million — and more than fifteen independent attackers identified.
The real shock, however, is behavioral. Victims were not novices but diligent holders who had followed industry best practice by withdrawing funds from exchanges. CryptoQuant identified a sudden rush of 39,600 BTC back onto centralized platforms — a volume statistically comparable to the 39,900 BTC moved during the 2022 FTX panic, effectively an “FTX reversal.” The resulting debate pits self-custody advocates like Adam Back (Blockstream) against more pragmatic voices such as Bloomberg’s Eric Balchunas, who argues the incident strengthens the case for Spot Bitcoin ETFs.
4. Market Sentiment and On-Chain Flows
The Crypto Fear & Greed Index collapsed to 6/100 in early August, plunging into “Extreme Fear” — a level seen only twice before in the index’s history (August 2019 and June 2022). Historically, such psychological lows often signal exhausted marginal sellers and, under a contrarian reading, represent asymmetric entry points for long-term investors.
Behavior diverges sharply by investor type. Weekly inflows into US Spot Bitcoin ETFs dropped 55% week-over-week to just $33.79 million in late July — an 83% decline from recent peaks. Conversely, whales (wallets holding over 1,000 BTC) resumed aggressive accumulation starting July 23, while long-term holder (HODLer) accumulation slowed by 47%, signaling broad-based caution as the market awaits a clear technical resolution.
| Investor Type | Recent Behavior | Market Reading |
|---|---|---|
| ETF (institutional) | Massive inflow pullback (-83% from peak) | Extreme caution ahead of August seasonality |
| Whales (>1,000 BTC) | Resumed aggressive accumulation in late July | Opportunistic “buy the dip” |
| Long-term holders | Marked accumulation slowdown (-47%) | Defensive stance pending technical direction |
| Overall sentiment index | Dropped to 6/100 (Extreme Fear) | Psychological capitulation, potential contrarian signal |
5. Microstructure: What the Order Book Heatmap Reveals
Analyzing the order book heatmap helps pinpoint the dormant liquidity that acts as a magnet for price. Above the current $64,953 level, a first zone of intense friction appears between $65,500 and $66,000, followed by extreme sell-side liquidity saturation between $67,000 and $70,000 — a wall that would require substantial spot buying volume to break through, an unlikely event given the current drought in ETF inflows.
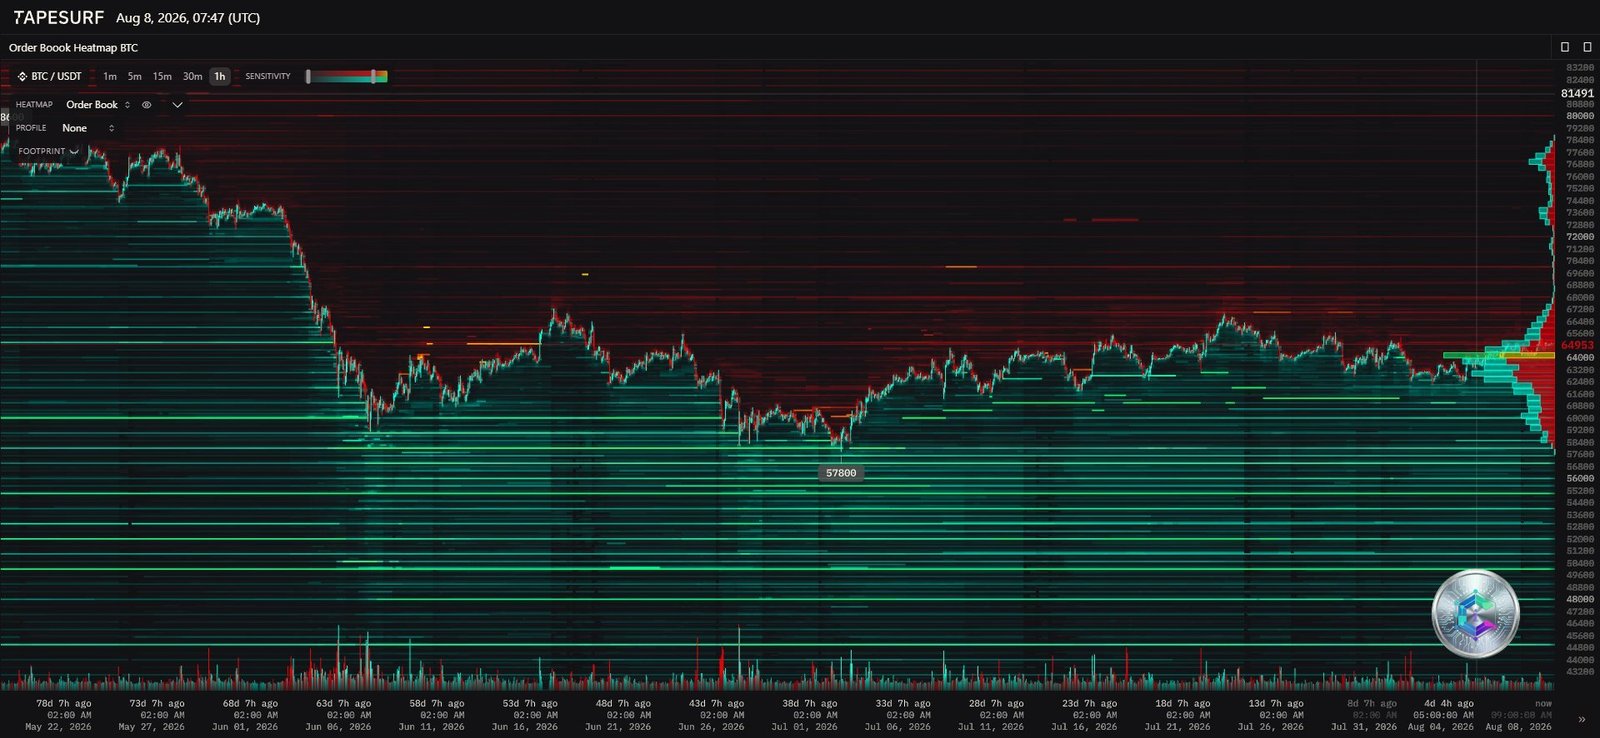
On the support side, a modest liquidity cushion sits between $62,000 and $63,000. But the most striking feature is a blindingly intense line at $57,800, revealing a titanic accumulation of buy orders, likely institutional in origin. Should short-term supports fail, price would inevitably be drawn toward this level. Below it, the order book thins out considerably down to the $52,000–$54,000 zone.
6. Multi-Timeframe Technical Analysis
6.1. Intraday Micro-Structure — 15-Minute Chart
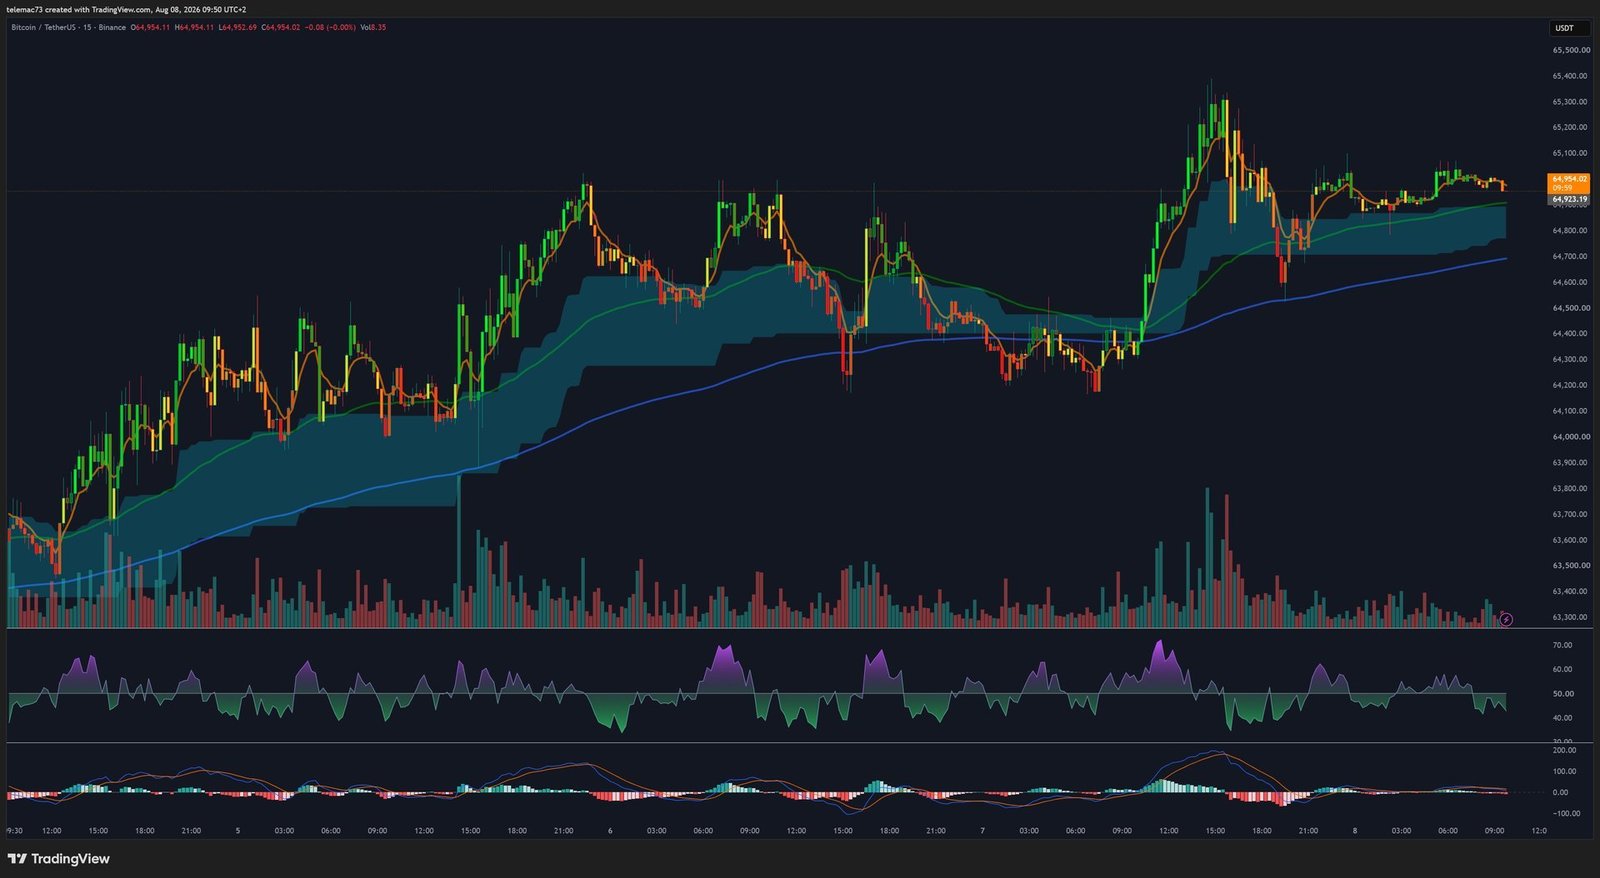
The 15-minute chart illustrates the market’s current paralysis. Price, hovering around $64,950, drifts aimlessly through a flattening Ichimoku cloud, generating repeated whipsaws. The RSI lazily hugs the 50 neutrality line while the MACD histogram has flattened entirely along the zero line — an extreme volatility compression that typically precedes an imminent breakout once an external catalyst emerges.
6.2. Swing Trading — 4-Hour Chart
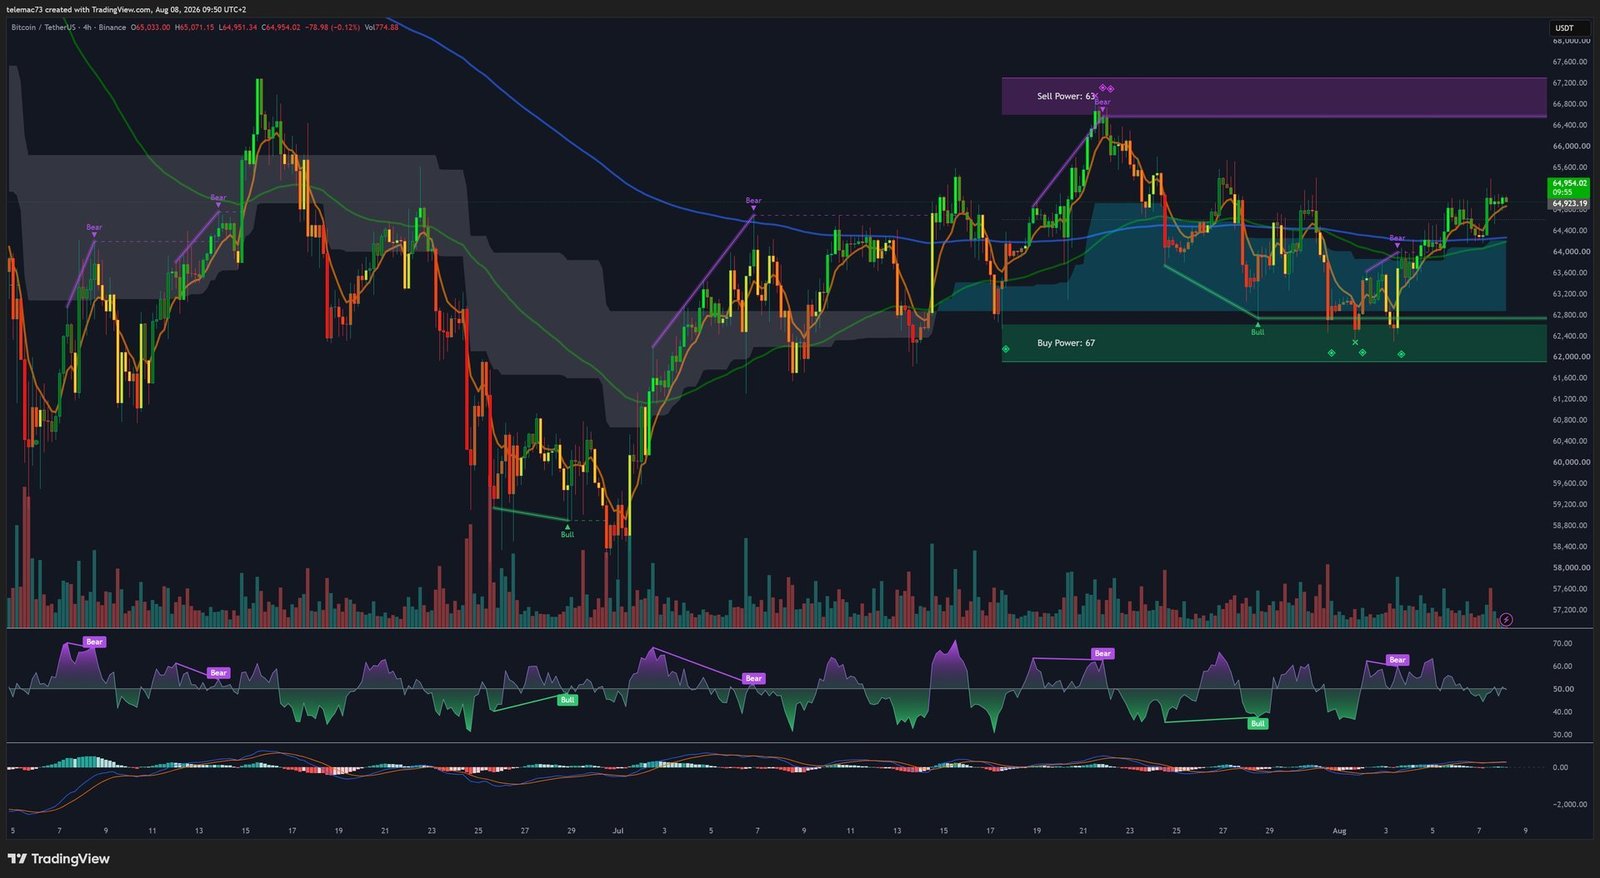
The 4H chart reveals a fierce tug-of-war between a purple “Sell Power” zone concentrated between $66,000 and $67,000 — consistent with the heatmap — and a green “Buy Power” zone between $62,000 and $63,000. Recent price action, with progressively higher lows, is tracing a symmetric compression triangle, possibly a broad bull flag. The MACD has confirmed a golden cross below the zero line, pointing to renewed short-term buying initiative, though a flattening RSI approaching overbought territory warrants caution given the imposing sell wall looming above.
6.3. The Underlying Trend — Daily Chart
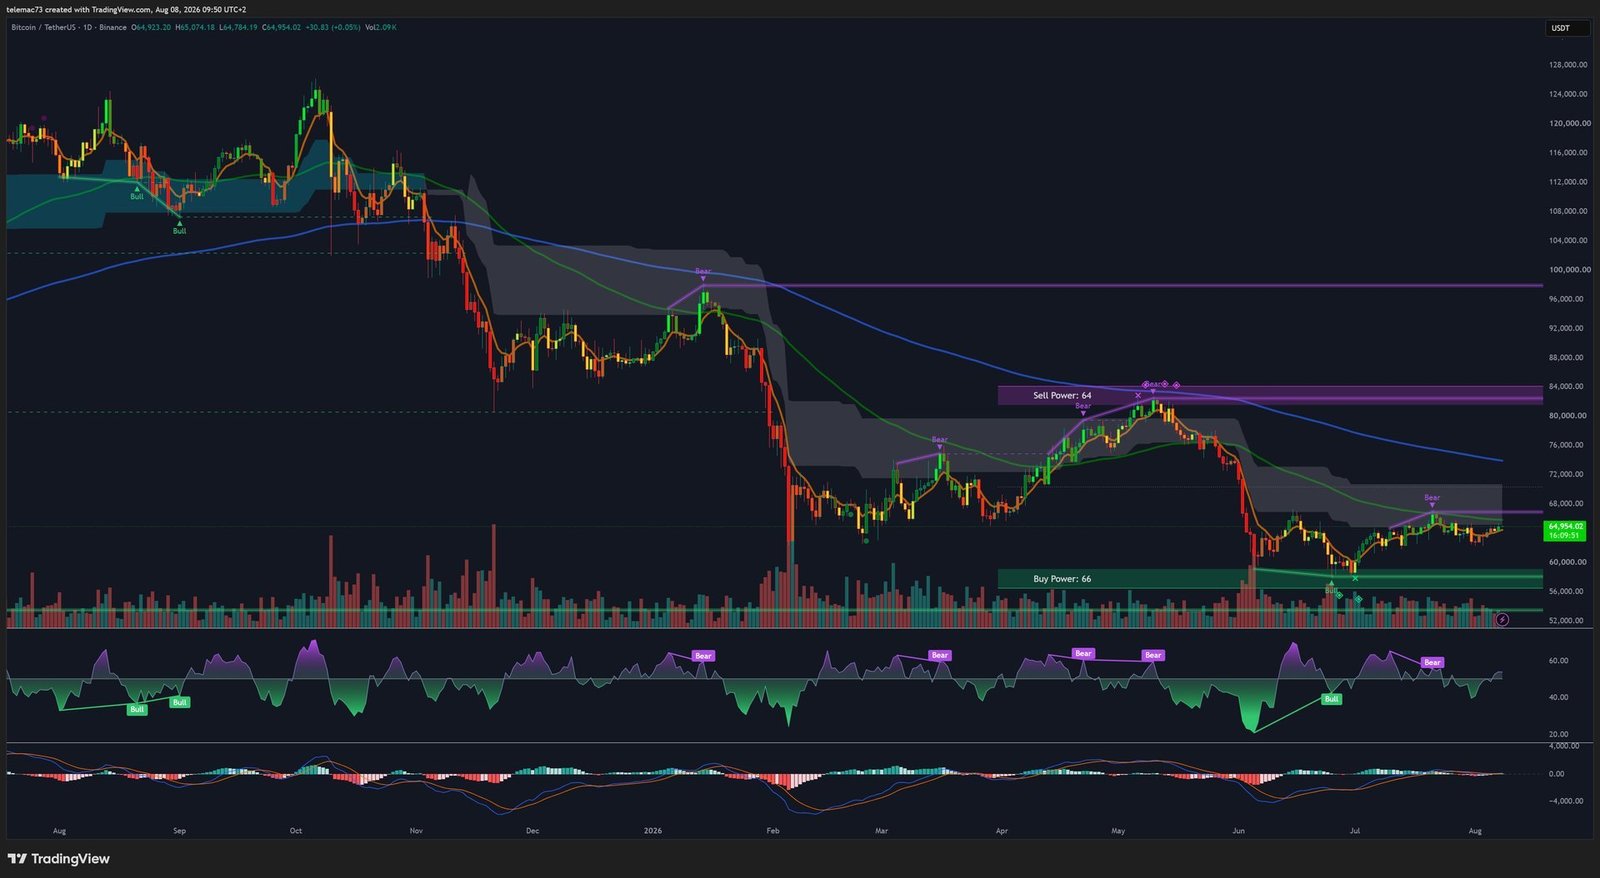
The daily chart exposes the severity of technical damage sustained since all-time highs. Short-term moving averages have crossed below long-term ones, confirming a structural “death cross.” More concerning, a classic bearish “Head and Shoulders” pattern has been developing since March, with the right shoulder apparently forming alongside a marked pullback in spot buying volume — a textbook exhaustion signal. The pattern’s neckline stretches from $60,965 down toward $54,000: holding this level is the single biggest technical stake of August. A decisive daily close below it would open the door to theoretical downside targets near $41,266, while a full invalidation would require reclaiming the lofty $82,931 level.
7. Price Projections: Short-Term Noise vs. Long-Term Thesis
Despite near-term turbulence, institutional analysts’ long-term outlook remains firmly bullish. Binance’s algorithmic models point to a $97,000–$99,000 range between June and August 2026, while Kraken’s forecasting tools target $127,878 for the year. Reports cited by Yahoo Finance point to a $150,000 target by end-2026, driven by institutional demand via ETFs, and veteran trader Peter Brandt places a cycle target between $300,000 and $500,000 by 2029 — while warning the road will be paved with violent corrections.
| Source / Analyst | Price Target | Horizon |
|---|---|---|
| Binance (modeling) | $97,000 – $99,000 | Summer 2026 |
| Kraken (forecasting tool) | ~$127,878 | Full year 2026 |
| Yahoo Finance consensus | $150,000 | End of 2026 |
| Peter Brandt | $300,000 – $500,000 | 2029 |
8. Strategic Takeaway
A three-dimensional read of Bitcoin — fundamental, behavioral, and technical — in early August 2026 reveals an asset under maximum compression. The macro backdrop remains broadly favorable, supported by dovish rate expectations and imported energy disinflation. Yet this positive backdrop collides head-on with a degraded crypto microstructure: the Coldcard trauma has rattled the self-custody paradigm, driving the sentiment index into a historic capitulation zone.
Technically, Bitcoin is squeezed between an institutional sell wall above $66,000 and a massive buy wall at $57,800, with the $60,965 neckline serving as the central pivot. Two scenarios compete: a capitulation that has already flushed out marginal sellers, opening the door to a short squeeze if price holds above $60,965; or stealth distribution masked by weak buyback volumes, whose support breakdown would unleash a liquidation cascade toward $57,800, or even $54,000.
Disclaimer: This article is provided for purely informational and educational purposes. It does not constitute investment advice, a recommendation to buy or sell, nor a solicitation to engage in any financial market transaction. Cryptocurrencies are highly volatile and risky assets. Always do your own research (DYOR) and consult a licensed financial advisor before making any investment decision.

