


Bitcoin trades near $81,810 on October 20, 6.4% below the period high of $87,385 reached on September 21 and about 9% above the September 15 low of $74,909. Price is coiling around the 50-day simple moving average (SMA50, near $81,550), in a compression phase rather than an outright correction.
The dominant driver remains institutional flow. US spot bitcoin ETFs drew $527M on Monday, their best session since September, after two weeks of net outflows of $681M and then $229M, according to Cointelegraph (October 20). October nonetheless remains negative, with a net outflow of about $88M according to Farside. Strive bought 4,045 BTC between October 12 and 16 at an average near $82,800, lifting its holdings to 36,818 BTC per Decrypt (October 19), while Strategy added only 1,666 BTC in the third quarter against 83,901 in the second.
Macro weighs more heavily. The Fed raised rates in September, its first increase in more than three years, with a restrictive tone set by Kevin Warsh according to Fidelity (September 22). Coincall, whose date is not confirmed on the page, puts the odds of another hike at the October 27-28 meeting near 22%. Data released on October 14 and 15 came in hotter than expected: core CPI rose 0.3% month over month against 0.2% expected, and producer prices rose 0.7% against 0.3%. Price slid from $84,000 back toward the $79,700 area. On regulation, the SEC consultation on « Regulation Crypto Assets » closes today with about 140 comments, and JPMorgan is extending JPM Coin to Ethereum: structural signals with no direct short-term effect expected.
This setup calls for a two-speed reading: a daily chart still structurally bullish but carrying a double top, and shorter frames where compression acts as the arbiter.
Multi-Timeframe Technical Analysis
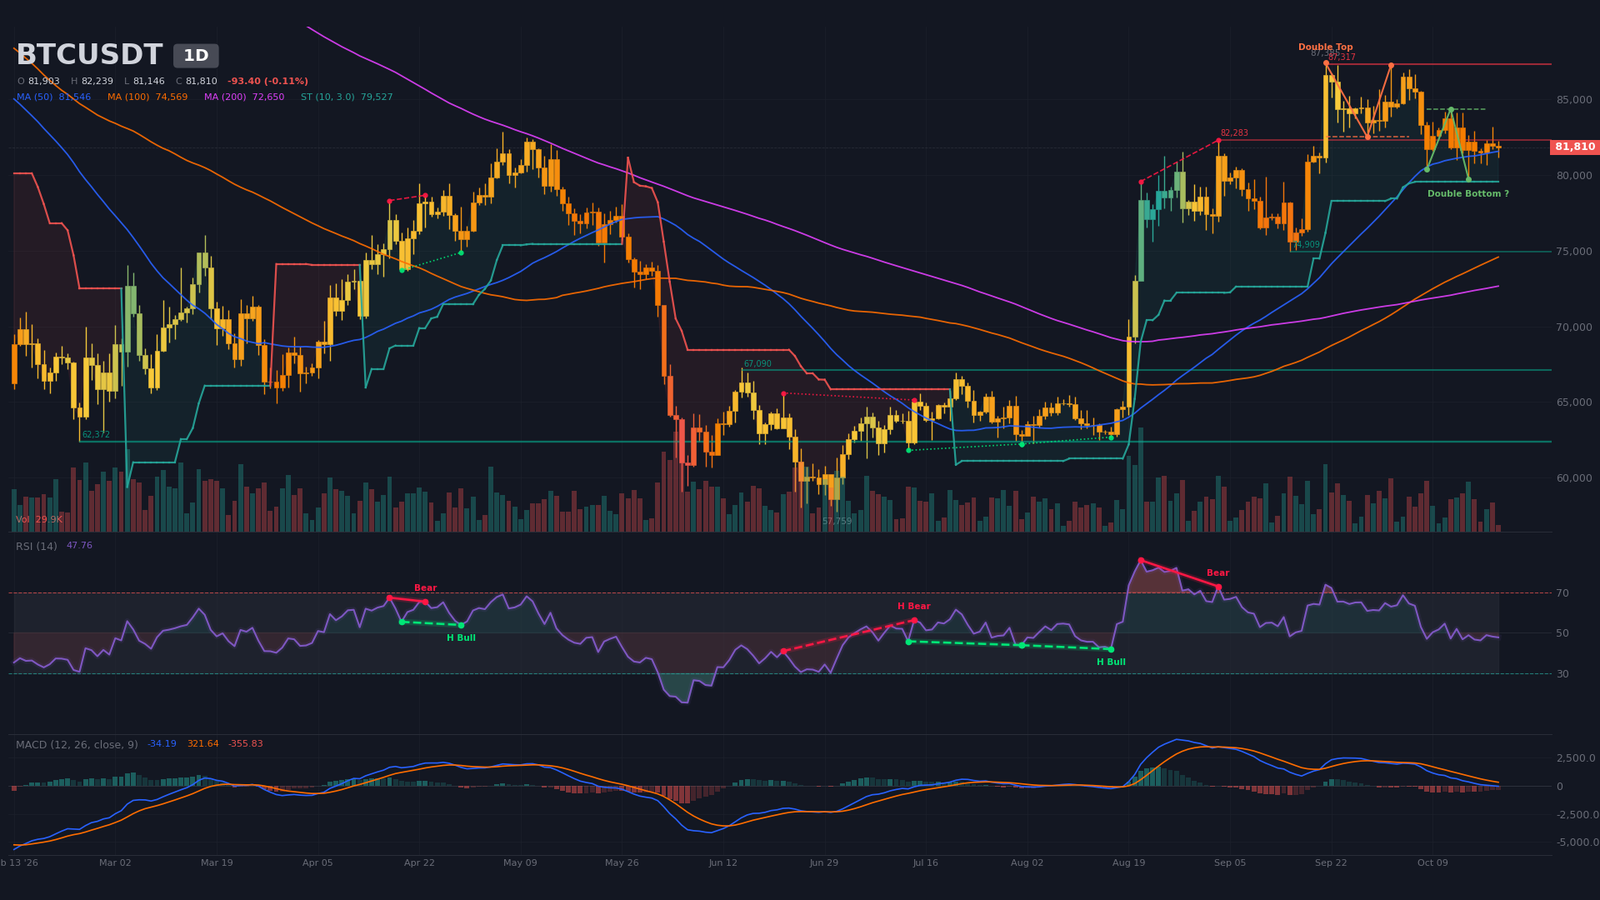
Daily Timeframe (1D): double top under resistance
The primary trend remains bullish: price holds above the SMA50 and the SMA200 (near $72,650), and the 50/200 golden cross dates from September 8. The phase is nonetheless a consolidation with distribution characteristics below $87,385, with price back under the SMA20 (near $83,180).
The algorithm flags a confirmed double top, with a neckline at $82,500 and a target at $77,680, measured from the October 2 pivot. It follows a regular bearish RSI/price divergence between August 21 and September 3, with RSI falling from 86 to 73. Facing it, an unconfirmed double bottom has its neckline at $84,340 and its target at $88,640; it remains a hypothesis until $84,340 closes on the daily chart. The daily SuperTrend stays bullish at $79,530.
RSI at ~48 is neutral with no exploitable divergence. MACD sits below its signal line and below zero since the bearish crossover of September 29. Volume on the current candle is only 23% of its 20-day average, a provisional reading until the session closes, and the average true range (ATR) is about 2.5% of price, near $2,020. The double top has been activated without reaching its target, so the bullish and bearish figures offset each other, hence the neutral bias.
Intermediate Dynamics (4H): symmetrical triangle compression
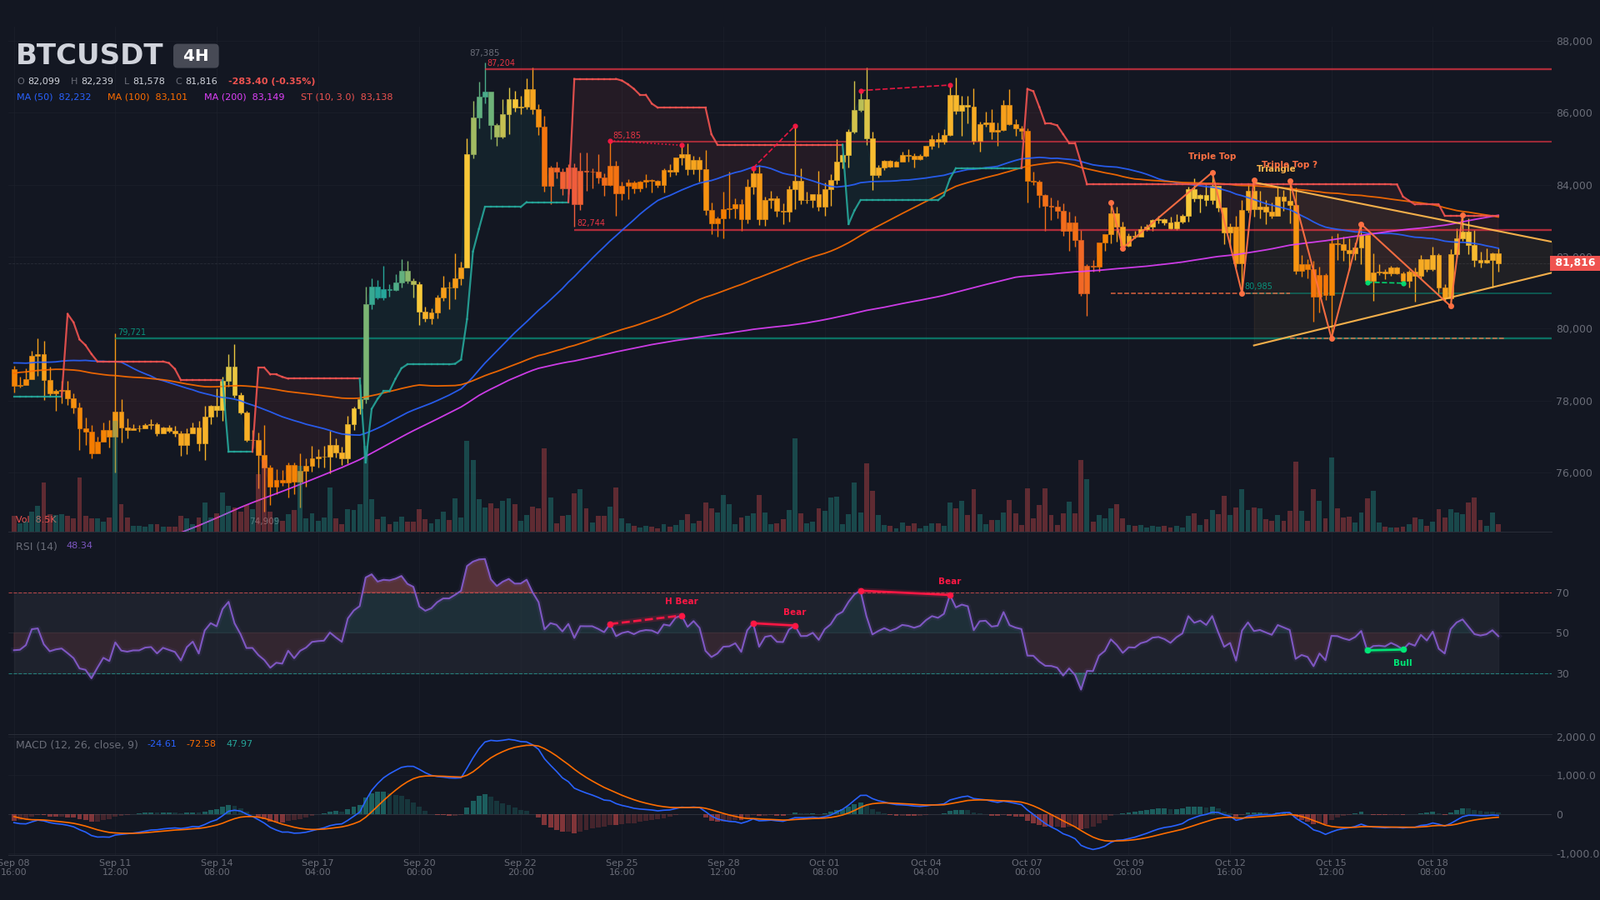
On the H4, a symmetrical triangle has been forming since October 13, bounded by resistance near $82,910 and support near $80,950, with an estimated apex on October 23. The structure is made of lower highs ($84,134, $82,900, then $83,158). Price trades below the SMA50 (near $82,230) and the SMA200 (near $83,150), after a bearish 50/200 crossover dated October 16, and just above the SMA20 (near $81,790). The H4 SuperTrend is bearish at $83,140.
Two bearish triple tops are flagged. The first, confirmed, has a neckline at $80,985 and a target at $77,980; the second, unconfirmed, has a neckline at $79,732 and a target at $76,070. A regular bullish RSI divergence (October 16 to 17) supported the bounce, and MACD crossed higher on October 18 below zero: a technical rebound that is not yet validated. Volume has fallen to 56% of its average, confirming the compression. H4 ATR is about $780.
Intraday Structure (15m): rebalancing range
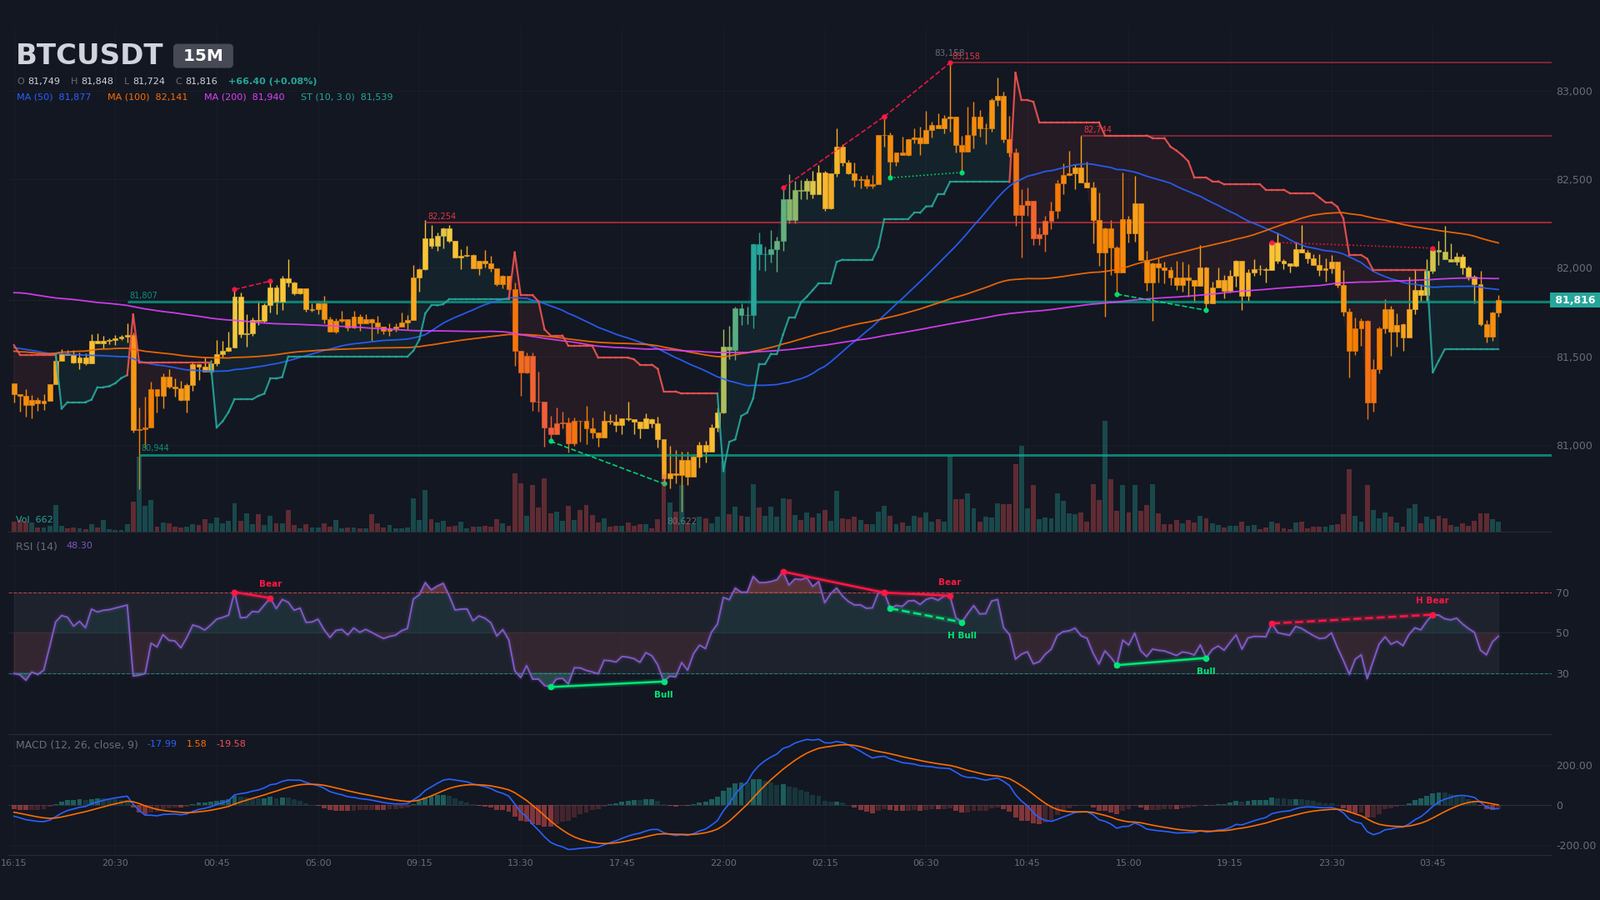
After the October 20 wick toward $81,146, on spike volume with RSI below 30, price is rebuilding an intraday range between $81,600 and $82,250. Supports sit at $81,807 and $80,944; resistances at $82,254, $82,744 and $83,158. The SMA20, SMA50 and SMA200 are tangled, signaling no trend. MACD has crossed lower, the M15 SuperTrend holds bullish at $81,539, and a hidden bearish divergence (October 19 at 21:00 to October 20 at 03:45) argues for further selling.
Triggers: an M15 close above $82,254 targets $82,744, while a close below $81,540 targets $80,944.
Multi-Timeframe Synthesis
| Timeframe | Dominant trend | RSI (14) | MACD | Chart pattern |
|---|---|---|---|---|
| Daily (1D) | Bullish in consolidation, distribution bias | ~48 | Below signal and zero, bearish crossover on 29/09 | Confirmed double top under resistance |
| 4 hours (4H) | Bearish (SuperTrend bearish) | ~48 | Bullish crossover on 18/10 below zero | Symmetrical triangle compression |
| 15 minutes (15m) | Neutral (range) | ~48 | Bearish crossover on 20/10 | Range $81,600–$82,250 |
Level Mapping: Technical Levels and Pivots
The map combines detected swings and supports, classic pivots, chart-pattern targets and estimated liquidation pockets. The short-term central pivot sits between $81,800 and $82,300. No Fibonacci extension is retained, as no calculation was provided in the data.
| Level | Price (USD) | Category | Technical basis |
|---|---|---|---|
| Resistance 3 (R3) | $87,200–$87,400 | Resistance | September 21 swing high ($87,385), daily resistance at $87,317 (2 touches), H4 resistance at $87,204 |
| Resistance 2 (R2) | $84,200–$85,300 | Resistance / magnet | Double-bottom neckline ($84,340), estimated short pockets ($84,290, $84,570, $85,200), H4 resistance at $85,185 |
| Immediate resistance (R1) | $82,750–$83,150 | Resistance | H4 resistance at $82,744 (3 touches), H4 SuperTrend at $83,138, H4 SMA200, M15 swing at $83,158 |
| Central pivot (P) | $81,800–$82,300 | Pivot | Daily pivot at $82,254, daily resistance at $82,283, M15 support at $81,807 |
| Immediate support (S1) | $80,900–$81,000 | Support | H4 triple-top neckline ($80,985), triangle floor ($80,946), buy wall at $80,993 ($6.1M) |
| Major support 2 (S2) | $79,100–$79,750 | Support | October 15 swing ($79,732), H4 support at $79,721 (3 touches), estimated long pockets ($79,120, $79,290), daily SuperTrend at $79,527 |
| Major support 3 (S3) | $77,700–$78,800 | Support | Daily double-top target ($77,683), H4 triple-top target ($77,979), estimated long pocket at $78,720 |
Order Book and Liquidity Heatmap
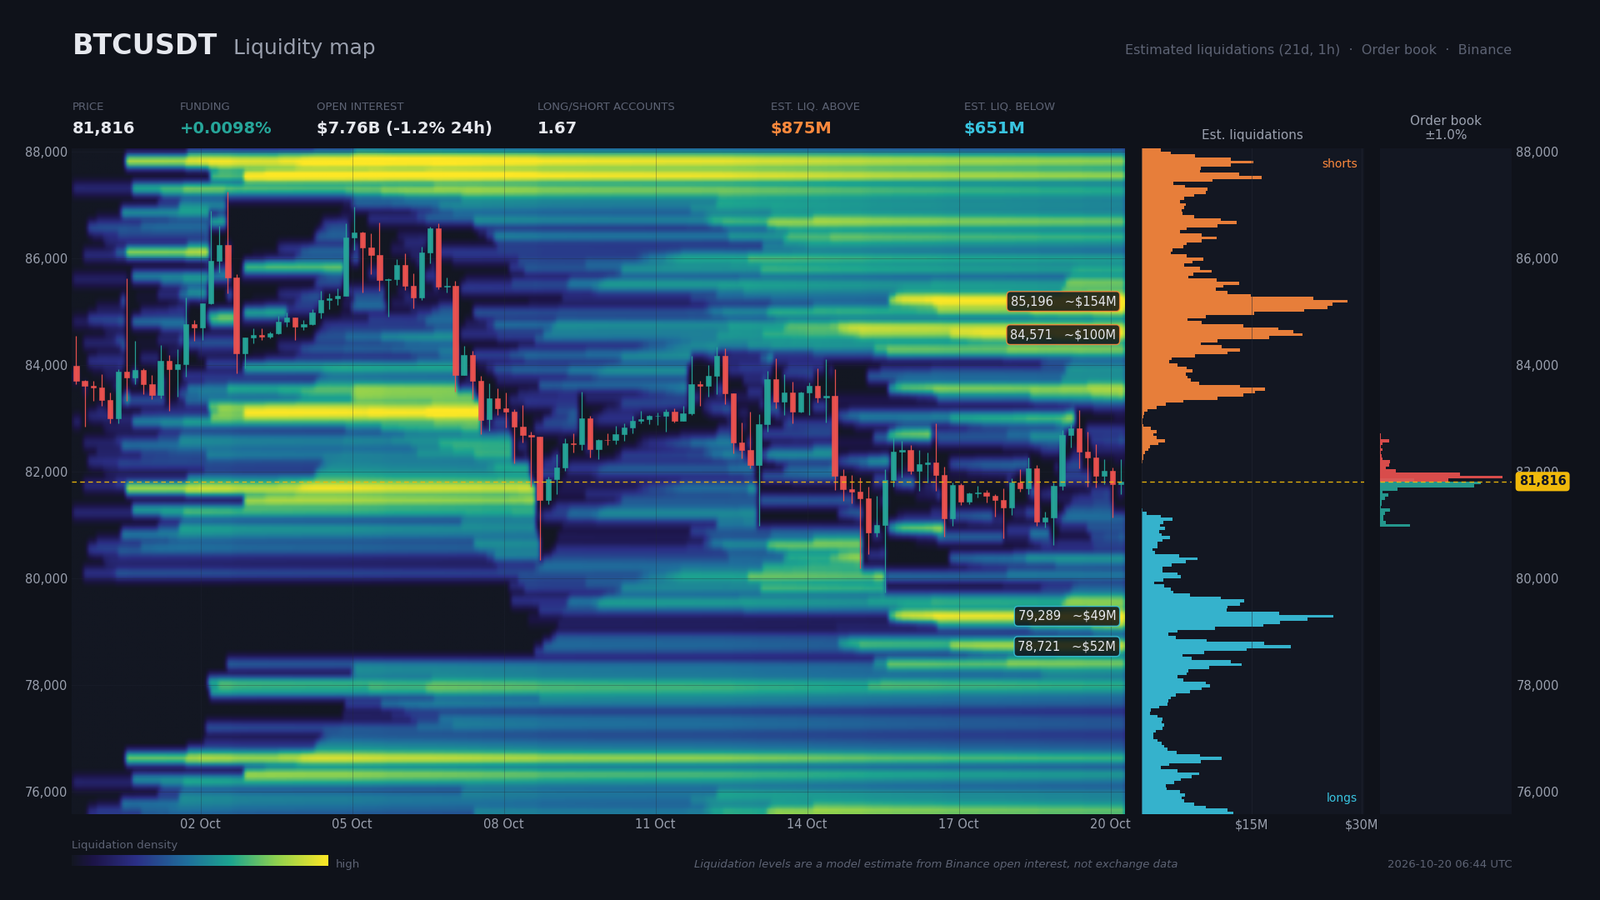
The order book covers only 1.04% around price, so it speaks to the very short term. On the sell side, the heaviest wall sits at $81,902 ($25.1M, 0.10% above price), followed by $81,958 ($16.4M), $81,845 ($13.9M) and $82,015 ($3.3M). On the buy side, $81,788 ($20.6M), $81,731 ($19.3M) and $80,993 ($6.1M, 1.01% below price) stand out. Within 2%, bids total $65.5M against $67.2M in asks, an imbalance of only 1.3%: a near-symmetric book that confirms the M15 range.
Estimated liquidations, produced by a model and not measured, are asymmetric. Above price, short positions would total about $875M, including $154M between $84,940 and $85,280, the heaviest pocket at 4.1% above price. Below, long positions would total about $651M, including $52M between $78,690 and $78,810 (3.8% below price). This imbalance suggests a magnet toward $84,300–$85,200, though not with certainty, since the model removes levels already crossed.
Funding at 0.0098% (10.7% annualized) is neutral to slightly positive, and open interest of $7.76B fell 1.18% over 24 hours, with no excessive leverage. The long/short ratio is 1.67 for accounts and 1.78 for top traders, a net long positioning, while the 24-hour taker buy/sell ratio of 0.99 reflects balanced aggressive flow. The risk is a sweep toward $79,100–$79,750 before any extension, or a short squeeze above $84,300.
Calendar: Catalysts to Watch
Three markers dominate the week: the H4 triangle apex, then the Fed meeting on October 27-28 and the October 30 options expiry.
- Tuesday October 20, 14:30 (Zurich) — US building permits and housing starts (consensus 1.4 and 1.31; previous -2.1 and 1.275): moderate crypto impact.
- Wednesday October 21, 08:00 (Zurich) — UK annual CPI (consensus 3.4%; previous 3.1%): an upside surprise would feed the inflation-and-rates narrative.
- Thursday October 22, 14:30 (Zurich) — US initial jobless claims (consensus 200,000; previous 199,000): a read on labor-market strength.
- Friday October 23, 01:30 (Zurich) — Japan inflation (consensus 2.1%; previous 1.9%): a firmer yen can weigh on risk assets.
- Tuesday October 27 and Wednesday October 28 — Fed meeting (time not specified; cited by Coincall, absent from the supplied calendar): the major macro catalyst.
Three Scenarios for the Coming Weeks
Probabilities are the analyst’s and total 100%. The bias is neutral with low conviction (confluence 2/5): each scenario is a conditional plan, not a forecast.
Scenario A — Rejection below $83,150 and return to the range floor (probability 50%)
Trigger: a failure under $82,750–$83,150, ideally an H4 close below $82,900. The path leads first to the triangle floor at $80,950, then to $79,730, the October 15 swing, against a backdrop of UK CPI on October 21 and US jobless claims on October 22. Stop at $83,300, roughly one H4 ATR above $82,500. Targets: $80,950 (R:R ≈ 1.9), then $79,730 (R:R ≈ 3.5). Execution zone: sell between $82,300 and $82,750. Invalidation: H4 close above $83,150.
Scenario B — Bullish liquidity sweep (probability 25%)
Trigger: an H4 close above $83,150, after an exit from the $82,910 upper boundary. The path targets $84,290, the $84,340 double-bottom neckline, then $85,200, an estimated short pocket, possibly helped by sustained ETF inflows. Stop below $82,400 (about $800, at least one H4 ATR); the $85,200 target gives R:R ≈ 2.5. A daily close above $84,340 would validate the double bottom, with a target at $88,640. Execution zone: $83,200–$83,500 after a confirmed close. Invalidation: H4 close below $82,400.
Scenario C — Bearish triangle breakdown (probability 25%)
Trigger: an H4 close below $80,950, the confirmed triple-top neckline, ideally under pressure from hot macro data or the Fed on October 27-28. The path leads to $79,730, then the estimated long pocket between $78,700 and $79,300, before $77,980 and $77,680, the pattern targets. Stop near $81,700, at least $780 above entry. Losing $79,530 (daily SuperTrend), then $77,680, would invalidate the consolidation reading and push the daily chart toward a deeper correction. Execution zone: $80,700–$80,950 after a close. Invalidation: H4 close back above $81,800.
Synthesis and Conclusion
The market is in late-range compression: the move since September 21 forms a consolidation between $79,700 and $84,300. ETF inflows and treasury buying support the lows, but a monthly balance still negative, hotter US data and a restrictive Fed rule out any clean recovery call. The context therefore neutralizes the technical signal.
The dominant technical stance is to wait for the H4 triangle to break, with an apex around October 23, rather than anticipate it. Selling rebounds under $83,150 with a stop above is the preferred posture; buying only makes sense after an H4 close above $83,150. Protection for the neutral reading sits at $79,700, and only a daily close below $79,530 would truly degrade the bias. Critical levels:
- $83,150 (H4 SMA200 / H4 SuperTrend)
- $84,340 (double-bottom neckline)
- $80,950–$81,000 (triangle / triple top)
- $79,730 (October 15 swing)
- $77,680 (daily double-top target)
Sources
- US Bitcoin ETFs draw $527M in biggest showing since September — Cointelegraph, October 20, 2026 07:39
- Bitcoin Treasury Buying Could Rebound, Analysts Say — Cointelegraph, October 20, 2026
- Strive Buys $335 Million in Bitcoin After Investors Pour In $369 Million — Decrypt, October 19, 2026 23:46
- BlackRock files for bitcoin ETF offering downside protection and upside exposure to IBIT — The Block, October 20, 2026 00:00
- Super League Stockholders Approve Metaplanet’s 2,100 BTC Investment — Bitcoin Magazine, October 19, 2026 21:32
- Market participants weigh in on SEC’s proposed crypto regulations — Cointelegraph, October 19, 2026 21:54
- October 14, 2026 – Bitcoin Holds Near $84K as Crypto ETF Outflows Top $1.1B… — Coincall, October 14, 2026 (date shown by search engine, unconfirmed)
- How high could interest rates go — Fidelity, September 22, 2026
- JPMorgan expands ‘JPM Coin’ deposit token to Ethereum for institutional clients — The Block, October 19, 2026 10:31
Disclaimer: This article is for educational and informational purposes only. It does not constitute investment advice, a recommendation to buy or sell, or an invitation to trade any financial asset. Cryptocurrency markets are extremely volatile; any investment decision should be based on your own research (DYOR) and, where appropriate, the advice of a licensed financial adviser.

