


Bitcoin is under pressure as October closes. Price stands at $80,758, about 7.6% below the recent high of $87,385 (September 21) and nearly 40% above the period low of $57,759. It has slipped back below the neckline of the daily double top at $82,500 and below the 20 and 50-day simple moving averages. The phase looks like a bearish consolidation following a distribution.
The immediate driver remains US spot ETF flows. According to Decrypt and Bitcoin Magazine (October 23), these products recorded $635.6M in net outflows on October 22, the largest single-day exit since June according to Yahoo Finance, including $254.1M from IBIT. October now sits at a net outflow of roughly $176M.
Macro added stress. WTI above $102 and Brent at $116, the highest since mid-March, are fuelling inflation fears ahead of the October 28 FOMC, amid fears of US strikes on Iran (Cointelegraph, October 23). AI credit is tightening, with CoreWeave credit default swaps above 11% (CNBC, October 23), while Moody’s kept France at Aa3 with a negative outlook. Among recent releases, Chinese retail sales beat expectations at 1.1% year on year against 0.5% expected, while US building permits fell to -0.2 against 1.39 expected, with no identifiable price reaction.
For the technical read, the bearish case therefore hinges on one test: whether the cost basis of ETFs and treasury companies, between $80,000 and $80,200 according to Glassnode (October 21), holds.
Multi-Timeframe Technical Analysis
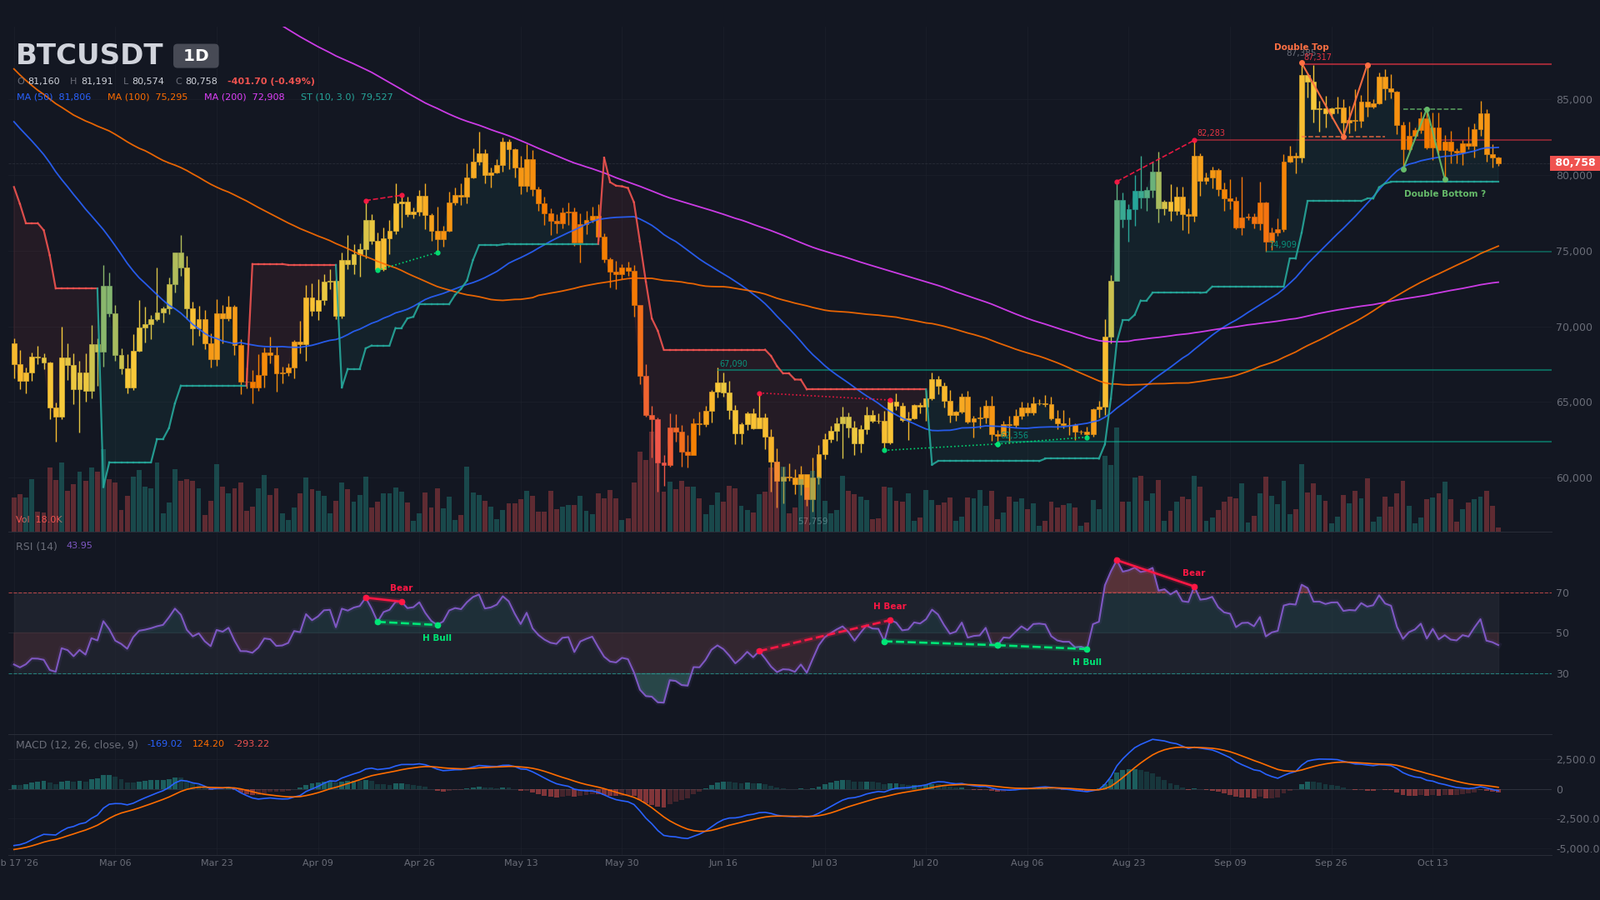
Daily Timeframe (1D): double top confirmed below $82,500
The long-term trend remains bullish, with price above the 200-day moving average (around $72,900). The phase, however, is a distribution: peaks are shrinking, from $87,385 (09/21) and $87,250 (10/02) to $84,340 (10/12) and $84,875 (10/21). Price sits below the 20-day average (around $82,600) and the 50-day average (around $81,800).
The double top is confirmed, with a neckline at $82,500 and an algorithmic target of $77,680, and several sessions have closed below that line. An unconfirmed double bottom ($84,340 neckline, $88,640 target) remains a reversal hypothesis. The daily SuperTrend, bullish at around $79,530, coincides with support: losing it would be a warning sign. The RSI at about 44 is neutral, after a bearish divergence between August 21 and September 3 (price from $79,556 to $82,283 while RSI fell from 86 to 73). The MACD sits below zero with a bearish crossover dated September 29 and a marked negative histogram; today’s volume, at 14% of its 20-period average, is not yet meaningful.
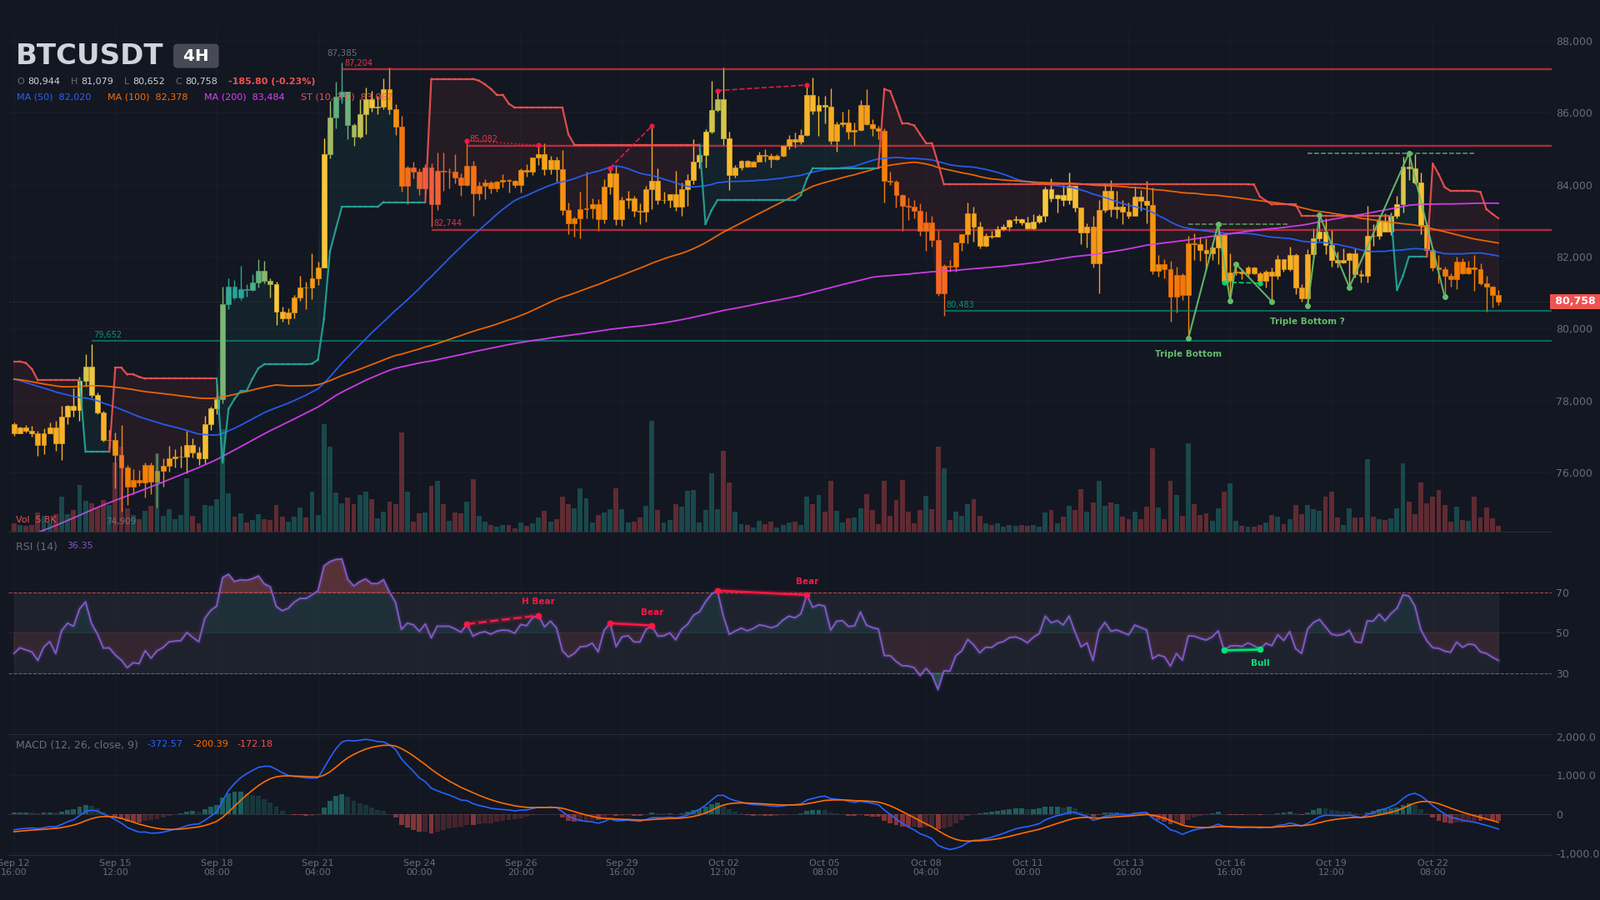
Intermediate Dynamics (4H): aborted triple bottom
The 4-hour chart reinforces the bias: price trades below the 20, 50 and 200-period averages (around $82,200, $82,000 and $83,500), with a bearish 50/200 crossover dated October 16 and a bearish SuperTrend near $83,070. Peaks are falling ($84,875 on October 21, then around $82,035 on October 23) while lows hold between $80,600 and $80,900.
A confirmed triple bottom, with a $82,900 neckline and a $85,380 target, produced a rebound to $84,875, but price then fell back below the neckline, which neutralises its reach. The RSI at about 36 approaches oversold territory, with a bullish divergence flagged on October 16 and 17. The MACD has sat below zero since the October 22 crossover. Supports: $80,480 and $79,650. Resistances: $82,740, $85,080 and $87,200.
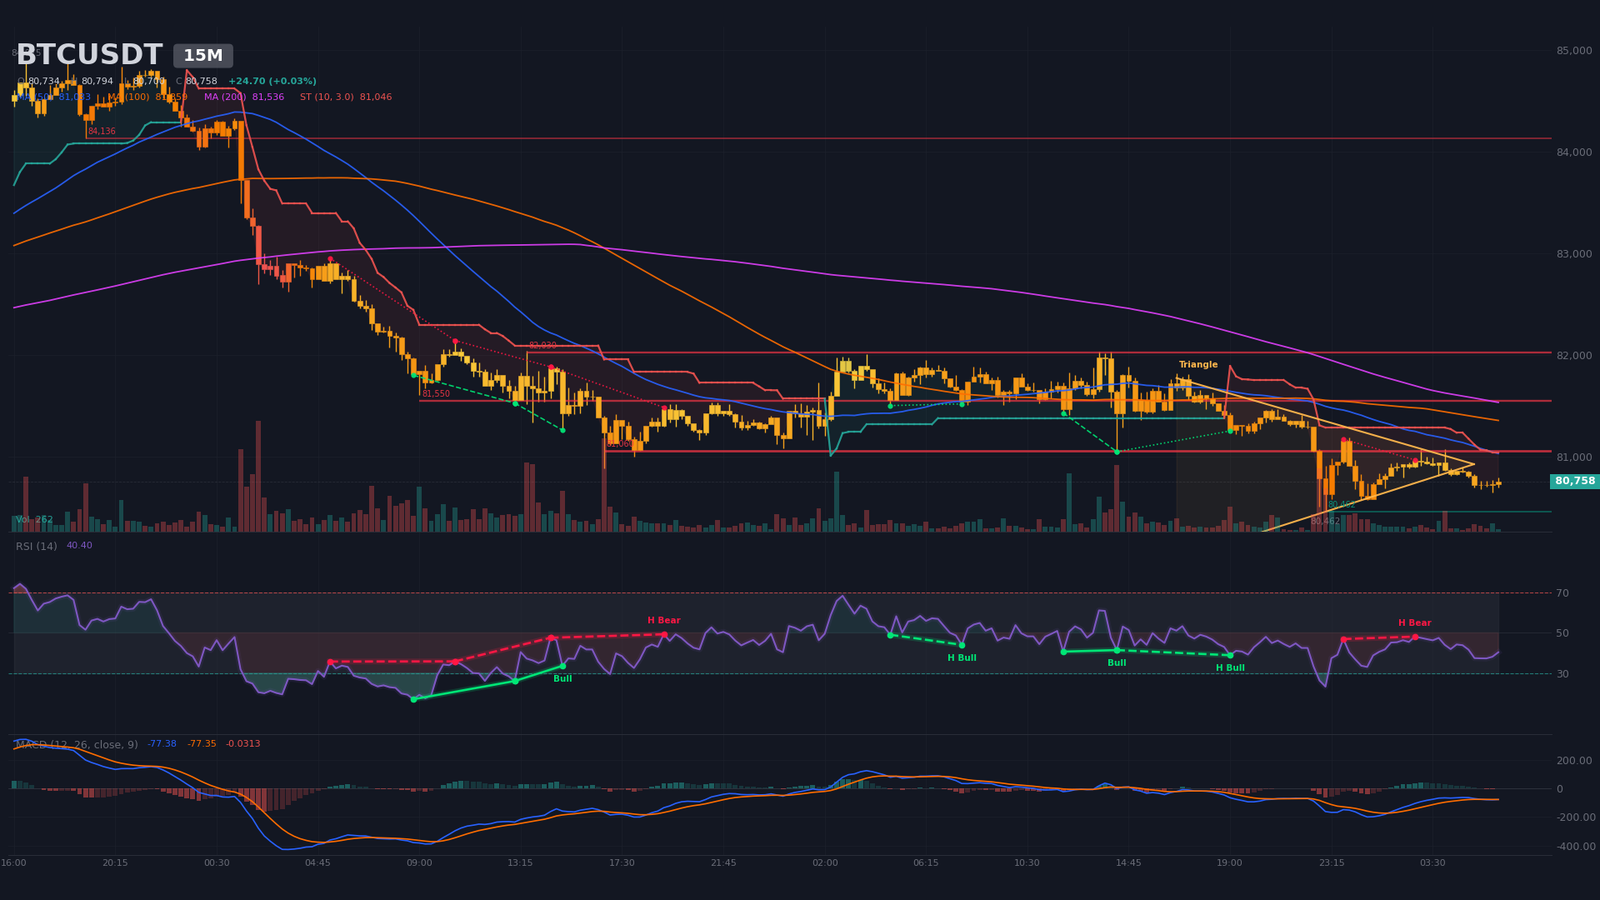
Intraday Structure (15m): breakdown from a symmetrical triangle
A symmetrical triangle detected since October 23 at 16:45, with an upper boundary near $81,010 and a lower boundary near $80,840, has been broken to the downside, but the move still needs a candle close to be confirmed. The SuperTrend is bearish, the RSI sits near 40 and the MACD crossed lower on October 24 at 05:45. Intraday ceiling: $81,060 (four contacts); a 15-minute close above it would cancel the immediate read. The $80,460 floor was swept by a wick.
Multi-Timeframe Synthesis
| Timeframe | Dominant trend | RSI (14) | MACD | Chart pattern |
|---|---|---|---|---|
| Daily (1D) | Long-term bullish, bearish distribution | ~44 | Bearish crossover on 09/29, below zero | Confirmed double top (target $77,680) |
| 4 hours (4H) | Bearish | ~36 | Bearish crossover on 10/22, below zero | Aborted triple bottom, falling peaks |
| 15 minutes (15m) | Bearish | ~40 | Bearish crossover on 10/24, histogram near zero | Symmetrical triangle breakdown (to confirm) |
Map of Technical Levels and Pivots
The daily classic pivot sits at $81,219. Fibonacci retracements of the move from $74,909 (09/15) to $87,385 (09/21) give about $82,620 (38.2%), $81,150 (50%) and $79,680 (61.8%), levels that coincide with the neckline, the pivot and the S2 support. The short-term central pivot zone is $81,000 to $81,250.
| Level | Price (USD) | Category | Technical basis |
|---|---|---|---|
| Major resistance 3 (R3) | $87,200 to $87,600 | Resistance | September 21 high ($87,385), 4H resistance at $87,204, estimated short pocket $87,519 to $87,584 |
| Major resistance 2 (R2) | $84,300 to $85,250 | Resistance | Daily double bottom neckline ($84,340), October 21 high ($84,875), estimated short pocket $84,919 to $85,244 (~$149M) |
| Immediate resistance (R1) | $82,300 to $82,800 | Resistance | Double top neckline ($82,500), 4H resistance at $82,744, daily 20-period average, 38.2% Fibonacci |
| Central pivot (P) | $81,000 to $81,250 | Pivot | Daily pivot $81,219, 15m resistance at $81,060 (four contacts), 50% Fibonacci |
| Immediate support (S1) | $80,250 to $80,500 | Support | 4H support at $80,483, daily S1 at $80,403, estimated long pocket $80,238 to $80,433, 15m low at $80,462 |
| Major support 2 (S2) | $79,500 to $79,700 | Support | 4H support at $79,652, daily S2 at $79,645, daily SuperTrend near $79,530, 61.8% Fibonacci |
| Major support 3 (S3) | $77,600 to $78,900 | Support | Estimated long pocket $78,613 to $78,938 (~$102M), double top target $77,683, True Market Mean near $77,600 (Glassnode) |
Order Book, Derivatives and Liquidity Heatmap
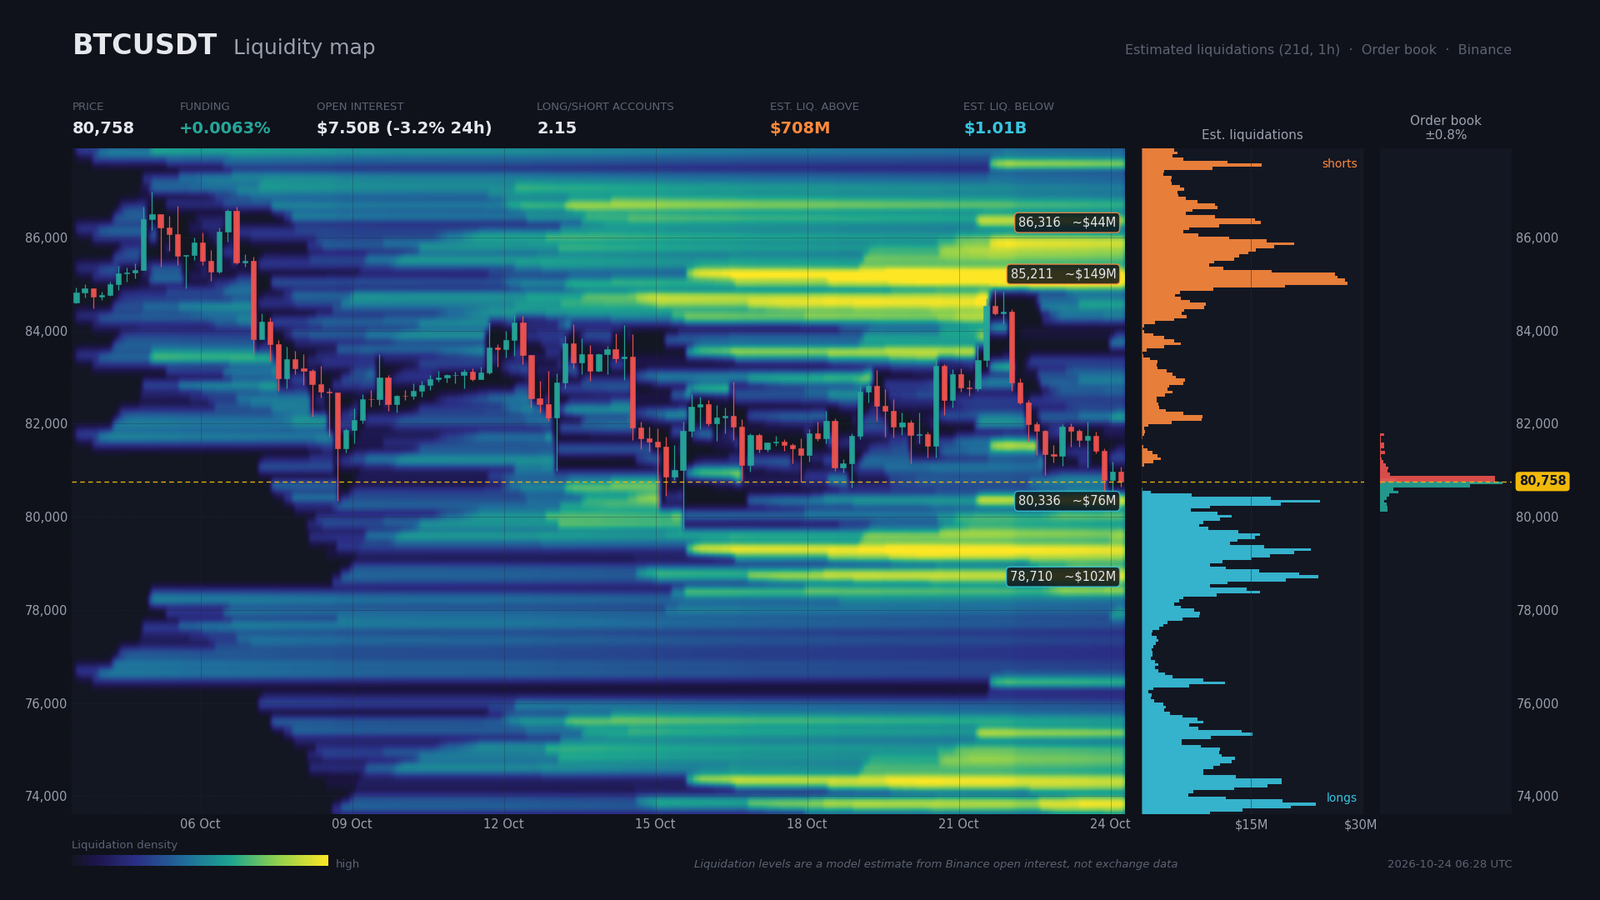
Binance order book coverage (perpetual and spot) reaches only 0.81% around the price, so the read stays local. Sell walls sit at $80,791 ($28.9M) and $80,856 ($29.0M), buy walls at $80,726 ($30.8M) and $80,661 ($22.8M). Within 2%, bids and asks are balanced at $75.3M against $71.2M: a near-neutral book with no directional signal.
Estimated liquidation zones, based on a model built on open interest rather than measured data, are heavier below price: roughly $1.01B of longs exposed underneath against $708M of shorts above. Funding is low at 0.0063% (about 6.9% annualised), open interest fell to $7.50B (down 3.2% over 24 hours) and the taker buy/sell ratio of 0.96 shows slight selling pressure. Long/short ratios still lean long (2.15 on accounts), which raises the risk of a liquidity sweep toward $78,900 to $79,650. On the upside, a squeeze toward $85,000 would first require reclaiming $82,500.
Calendar: Catalysts to Watch
No Deribit options expiry or CME settlement appears in the calendar provided. Three high-impact events stand out, with the FOMC the most likely to pull price out of its current structure.
- October 28, 19:00 (Zurich) — Fed rate decision (consensus 4, previous 4), followed by the press conference at 19:30: a restrictive tone in the face of oil-driven inflation would weigh on Bitcoin.
- October 29, 13:30 (Zurich) — US advance GDP (consensus 3.5%, previous 6.1%), core PCE m/m (0.5% versus 0.3%) and personal income (0.3% versus 0.2%): a PCE print above consensus would feed the inflation thesis.
- October 29, 14:15 (Zurich) — ECB deposit rate (consensus 2.5%, previous 2.5%): a secondary event unless the tone surprises.
Three Scenarios for the Coming Weeks
The three scenarios cover the next few weeks and pivot on the October 28 FOMC. The analyst’s probabilities total 100%.
Scenario A — Bearish extension toward the double-top target (probability 50%)
The trigger is a rejection below $81,060 followed by a 15-minute or 4-hour close under $80,460, in the wake of the October 28 FOMC at 19:00 and the October 29 PCE. The path targets $79,650, then $78,610 to $78,940, with a final objective at $77,680. The stop, at $81,800 (about 1.06 4H ATR), sits above the pivot and the 15m resistance at $81,550, for a R:R of about 1.7 toward $79,650 and 2.7 toward $78,800. Execution zone: sell the rebound between $80,900 and $81,050. Invalidation: 4H close above $81,800, then above $82,740.
Scenario B — Floor sweep then rebound (probability 30%)
The trigger is a wick below $80,000, the cost basis of ETFs and treasury companies, followed by a recovery above $80,500 on a 4-hour close, amid the volatility expected around the FOMC. The path leads to $81,060, then $82,740, with a possible extension toward $85,000 to $85,240. The stop, at $79,000 (about 1 4H ATR below $79,650), frames a buyer position. Execution zone: $79,650 to $80,000, after the rejection is confirmed. Invalidation: 4H close below $79,500, which would shift the setup toward Scenario A.
Scenario C — Double-top invalidation (probability 20%)
The trigger is a Fed seen as accommodative or an easing of oil prices, with a daily close above $82,500, then above $84,340. The path leads to $85,200, $87,300, then $88,640, the double-bottom target. The stop, at $81,300 (more than one 4H ATR below the reclaimed level), sets the protection. Execution zone: only after a 4H close above $82,750. Invalidation: a daily close back below $80,400.
Synthesis and Conclusion
The phase is a distribution below $87,000 that is sliding into a bearish consolidation. The daily double top is confirmed and all three timeframes point lower. The $80,000 floor holds thanks to the ETF cost basis, but the October 22 outflows ($635.6M) show that institutional demand no longer defends it actively. Derivatives, with low funding and falling open interest, show neither excess nor capitulation.
The dominant technical strategy is to favour sell rebounds below $81,250, with protection above $81,800 and then $82,750 for the structural read, and to avoid selling lows, since the sweep of $79,650 to $80,000 could trigger a reaction. Critical levels: $82,300 to $82,800 (double-top neckline), $81,000 to $81,250 (pivot), $80,250 to $80,500 (immediate support), $79,500 to $79,700 (S2 and daily SuperTrend, where a loss would open $78,900 then $77,680) and $84,300 to $85,250 (bullish reversal zone). Reassess after the FOMC.
Sources
- Bitcoin ETFs Bleed $636 Million as October Turns Red Again — Decrypt, October 23, 2026
- Bitcoin ETFs Lose Over $635M In One Day Following Oil Price Spike — Bitcoin Magazine, October 23, 2026
- Bitcoin ETFs See Outflows Return As Market Volatility Worsens — Yahoo! Finance, October 23, 2026
- Bitcoin seeks support above $81K as Brent crude oil hits highest level since March — Cointelegraph, October 23, 2026
- CrowdStrike CEO’s alarming prediction — plus, the sell-off spreads beyond tech — CNBC, October 23, 2026
- Turmoil hits AI buildout as neoclouds face pressure, credit risks mount and Solidigm pulls IPO — CNBC, October 23, 2026
- Moody’s holds steady on France’s credit rating as country grapples with turmoil and higher yields — CNBC, October 23, 2026
- Swept and Refilled — Glassnode Research, October 21, 2026
- SEC proposes crypto asset custody framework for investment advisers and regulated funds — A&O Shearman, October 15, 2026
- SEC proposes custody rule amendments to address crypto assets (To the Point) — EY, date not confirmed
- Franklin Templeton Clears Final Hurdle For ETFs That Turn Stock Dividends Into Bitcoin — Bitcoin Magazine, October 23, 2026
- Board of Governors of the Federal Reserve System (FOMC calendar, October 27-28) — federalreserve.gov, October 7, 2026
Disclaimer: This article is for educational and informational purposes only. It does not constitute investment advice, a recommendation to buy or sell, or an invitation to trade any financial asset. Cryptocurrency markets are extremely volatile; any investment decision should be based on your own research (DYOR) and, where appropriate, the advice of a licensed financial adviser.

