


- Bitcoin is digesting a confirmed double top and holding below its resistances, 26% under its September record.
- Driver: $2B of liquidations, $643M of ETF outflows and a Fed considering a rate hike in December.
- Watch: FOMC minutes on November 18 at 20:00 after the Anthropic IPO, and any H4 close above $67,600.
Bitcoin trades at $64,570 on November 17, 2026, 26% below the $87,385 peak of September 21. The recent low of $61,956, set on November 15, is the lowest since July, and the price sits only about 4% above it. After six consecutive weekly declines, the market is stabilizing below its weekly SMA10 and SMA20 at $78,100 and $73,930.
The immediate engine is a leverage flush. According to Decrypt (November 16, citing CoinGlass), the November 14-15 weekend produced roughly $2B in liquidations, $1.8B of them on long positions, while The Block puts 24-hour liquidations at $2.02B. Open interest fell 19% over seven days. On the flows side, US spot ETFs lost $643M on October 30, their largest outflow since June 25 (CoinDesk, November 2).
Macro points the same way. US core inflation printed 0.3% month-on-month on November 10 against 0.2% expected, and the price closed that day about 2% lower. On November 13, core producer prices came in at 0.3% versus 0.4% expected, yet the price still lost roughly 4%. On November 16, Fed Chair Kevin Warsh described an AI-driven inflection point, and CNBC reported that the Fed could consider a rate hike in December. The dollar sits at an 18-month high (MarketWatch).
Anthropic’s IPO, which could raise up to $64B at a $1.4T valuation, is pulling capital toward AI. On regulation, the SEC crypto custody proposal and the CFTC approval of blockchain derivatives infrastructure have no identifiable price effect at this horizon. The bias stays bearish, but a positioning already flushed limits the downside acceleration.
Multi-Timeframe Technical Analysis
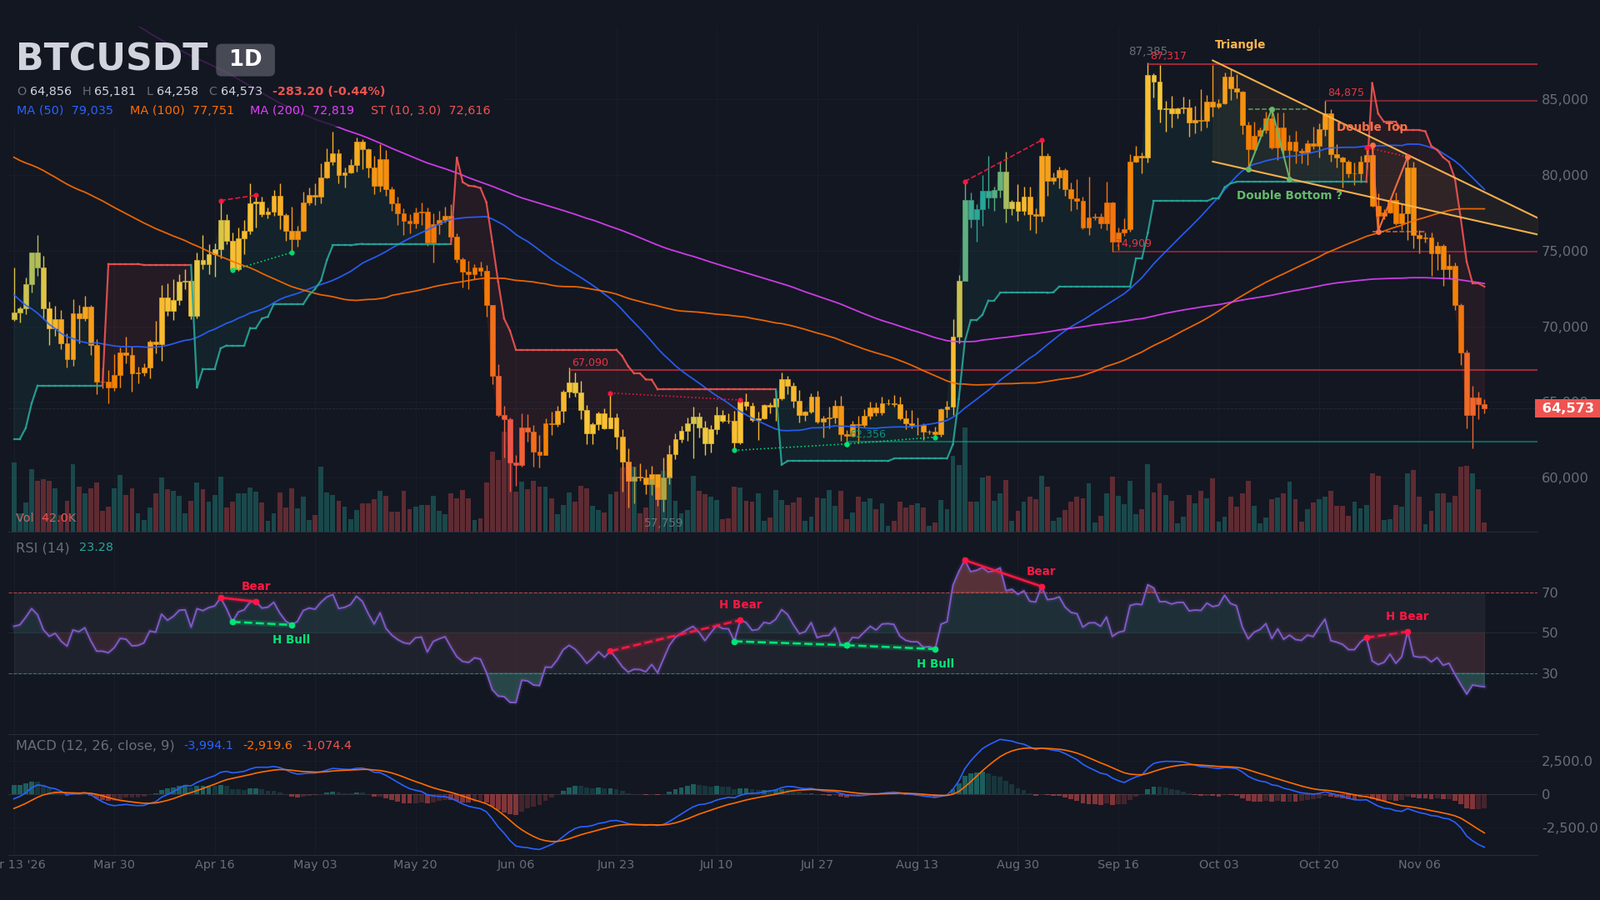
Daily Timeframe (1D): bearish impulse after a confirmed double top
The latest weekly decline reaches 12.7%, weekly RSI has dropped to 40, and the price remains below the weekly SMA10 ($78,100) and SMA20 ($73,930). This is a reversal, not a simple correction. On the daily chart, the close below the $76,270 low confirms lower highs and lower lows. ADX at 37, with DI- far above DI+, points to an established trend that favors continuation. Price trades below the daily SMA20 ($73,500), SMA50 ($79,040) and SMA200 ($72,820), with no 50/200 cross recorded so far.
The double top (October 2 at $87,250, then November 4) is confirmed by its neckline at $76,270, and its $70,970 target has been reached and exceeded, so it no longer serves as an argument. The SuperTrend remains bearish at $72,620. On the major impulse from $57,759 to $87,385, price sits at the 78.6% Fibonacci retracement (Fibonacci retracement) at $64,099, the last barrier before the July low. The 61.8% level stands at $69,076, while the 23.6% retracement of the recent impulse, at $67,960, is the first rebound target.
Daily RSI, at 23, is oversold and flat, with no validated bullish divergence. MACD has stayed below its signal line and below zero since the bearish crossover of September 29, with a negative histogram in expansion, and price hugs the lower Bollinger band. Volume on November 16 reached 112% of average, after a 194% spike on November 14, a sign of capitulation. A break below $62,000 would quickly drive the price toward the bottom of the value area ($58,990 – $78,130).
Intermediate Dynamics (4H): stabilization below the SMA20 after capitulation
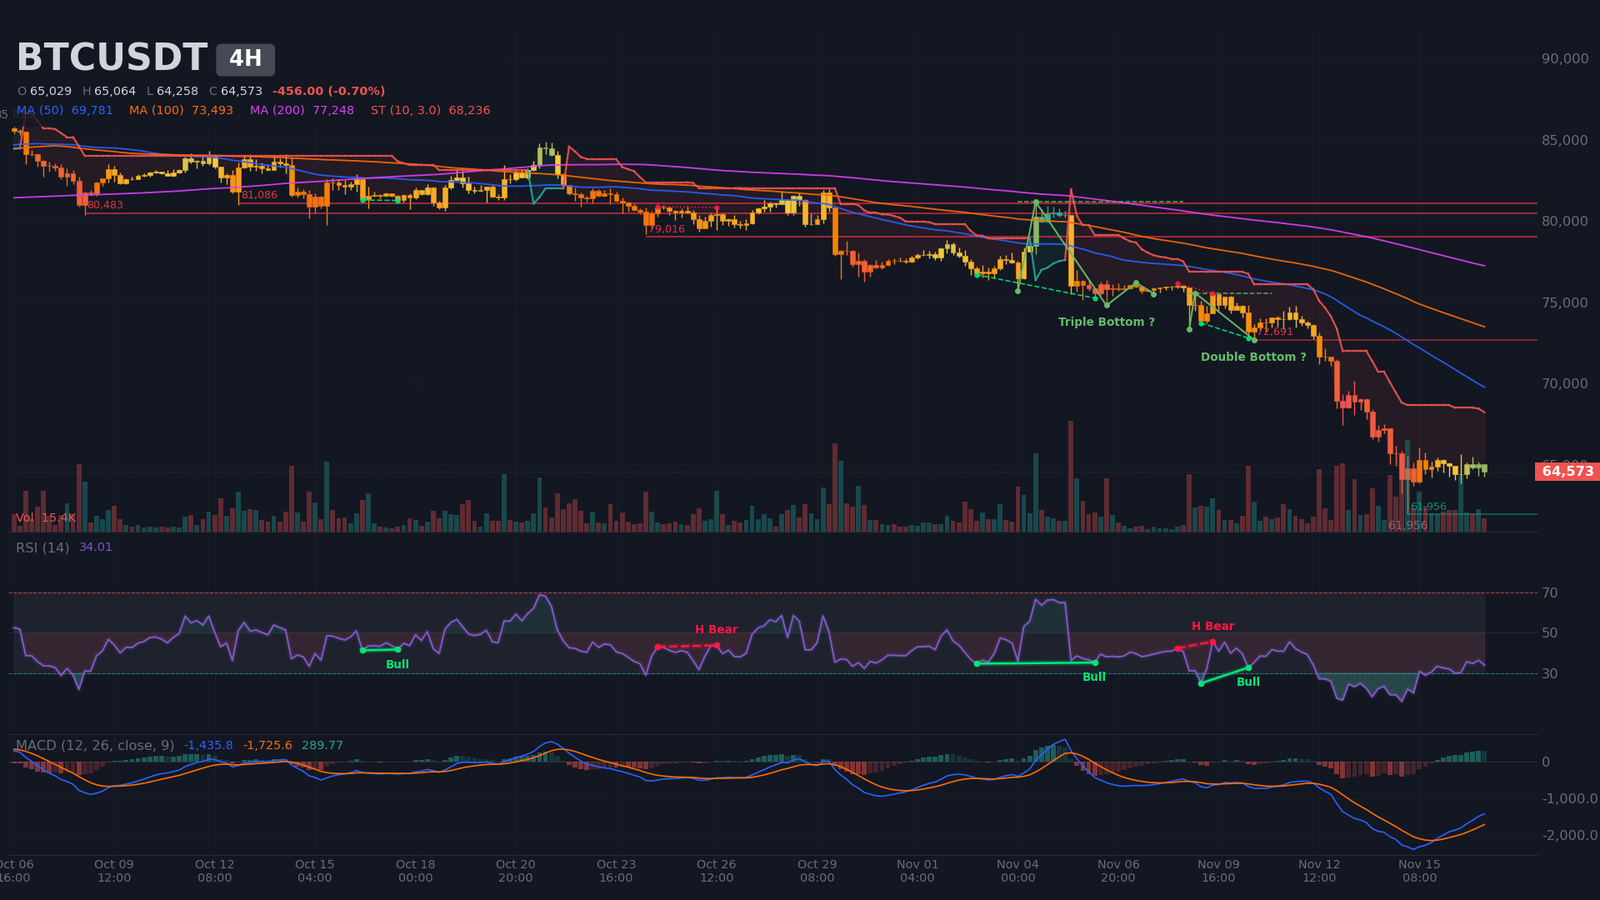
On the four-hour chart, ADX at 57 signals a very established trend dominated by sellers. Price remains below the SMA20 ($65,200), SMA50 ($69,780) and SMA200 ($77,250). Since November 15 it has oscillated between $63,870 and $65,680, a stabilization range in the analyst’s reading. RSI at 34 is neutral, and MACD crossed higher on November 15 with a positive but weak histogram. This technical rebound does not contradict the daily view. The detected patterns, a double bottom with a $75,575 neckline and a triple bottom at $81,190, remain unconfirmed and too distant.
The H4 Fibonacci, drawn from $76,210 to $61,956, places the 23.6% level at $65,320, already tested, and the 38.2% level at $67,400, which coincides with the daily resistance at $67,090. Volumes on the last complete H4 candle stand at 70% of average, and the H4 SuperTrend at $68,240 remains bearish.
Intraday Structure (15m): symmetrical compression triangle
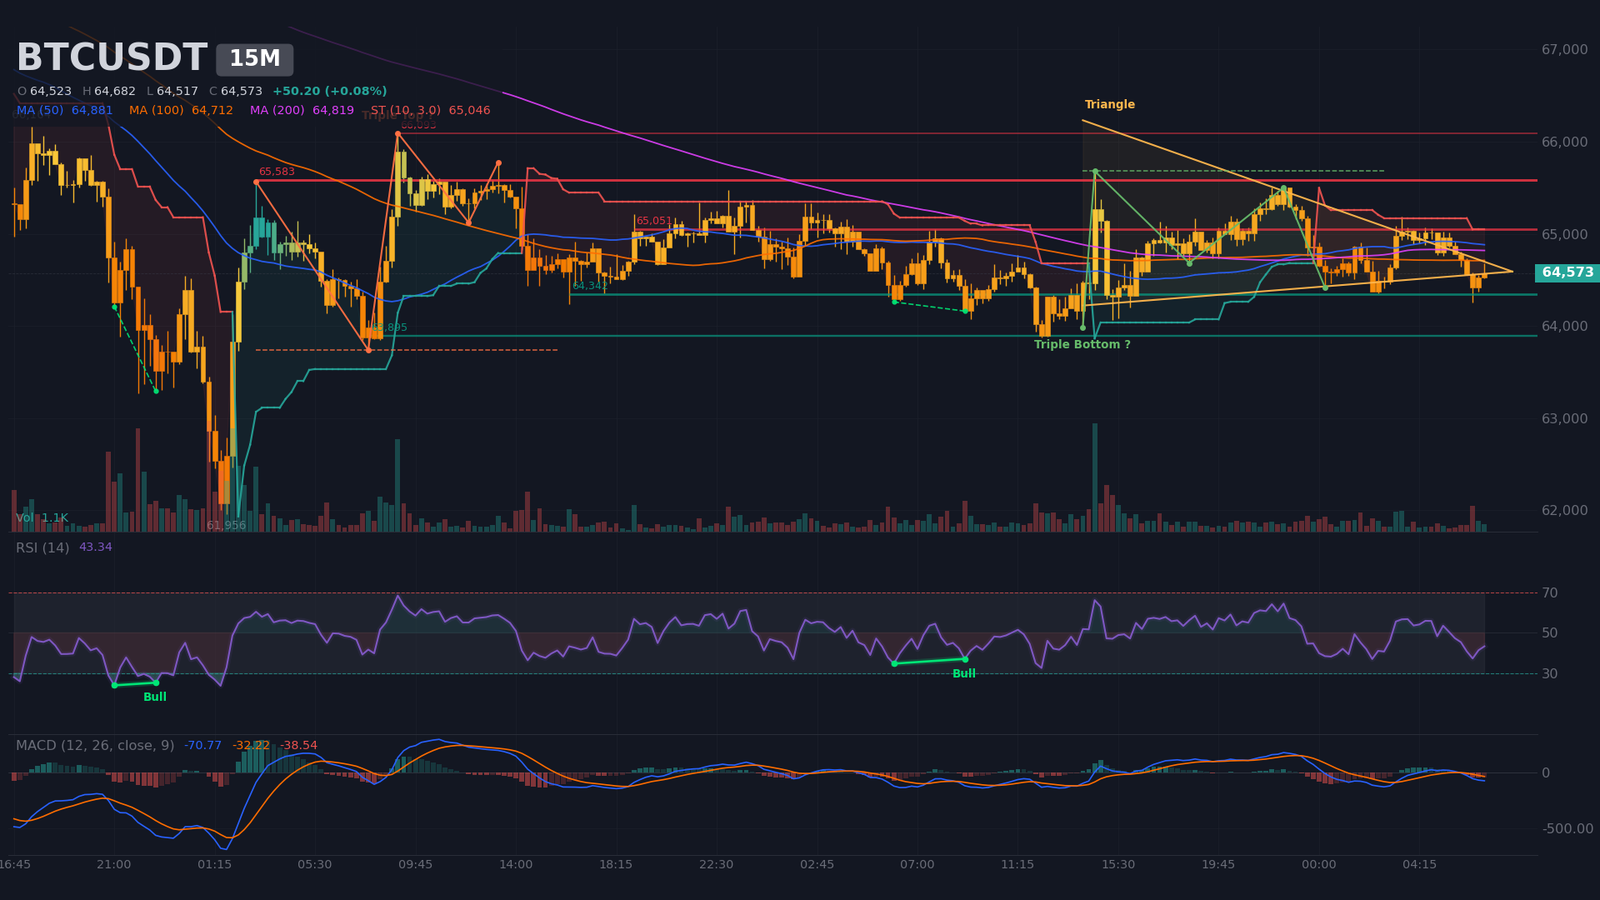
ADX at 20 signals a range with no trend. The symmetrical triangle, active since November 16, is bounded by $65,010 and $64,495, with an apex around the early morning of November 17, pointing to an imminent resolution. The SMA20, SMA50 and SMA200 are squeezed between $64,755 and $64,880, and the price closed below its last low ($64,760) after a bearish MACD crossover. Supports sit at $64,340 then $63,895, and resistances at $65,050 then $65,583. A 15-minute signal against the daily trend remains only a short-term trigger.
Multi-Timeframe Synthesis
| Timeframe | Dominant trend | RSI (14) | MACD | Chart pattern |
|---|---|---|---|---|
| Daily (1D) | Bearish (impulse, ADX 37) | ~23 (oversold, flat) | Below signal and zero, histogram expanding | Confirmed double top (target reached) |
| 4 hours (4H) | Bearish (stabilization in range) | ~34 (neutral, flat) | Bullish crossover on November 15, weak | Range $63,870 – $65,680 |
| 15 minutes (15m) | Range, sell bias | ~43 (declining) | Bearish crossover on November 17 | Symmetrical triangle |
Mapping Technical Levels and Pivots
The map combines daily pivots, Fibonacci retracements, detected supports and resistances, the volume profile and order book walls. The densest area is the $63,850 – $64,250 pivot zone, where the S1 pivot ($63,925), the daily point of control ($64,239), the 78.6% retracement ($64,099) and a buy wall ($63,956) overlap.
| Level | Price (USD) | Category | Technical basis |
|---|---|---|---|
| Major resistance 3 (R3) | $67,000 – $67,600 | Major resistance | Daily resistance $67,090 (2 contacts), R3 pivot $67,541, H4 Fibonacci 38.2% $67,400 |
| Major resistance 2 (R2) | $66,000 – $66,650 | Major resistance | R2 pivot $66,610, H4 swing high of November 15 at $66,093, sell wall $66,070 |
| Immediate resistance (R1) | $65,300 – $65,750 | Resistance | R1 pivot $65,733, H4 high $65,679, M15 resistance $65,583 (6 contacts), H4 Fibonacci 23.6% $65,320 |
| Central pivot (P) | $64,650 – $64,900 | Pivot | P pivot $64,802, M15 volume node $64,717, M15 point of control $64,893, sell wall $64,661 |
| Immediate support (S1) | $63,850 – $64,250 | Support | S1 pivot $63,925, daily point of control $64,239, Fibonacci 78.6% $64,099, buy wall $63,956 |
| Major support 2 (S2) | $62,350 – $63,000 | Major support | S2 pivot $62,994, daily support $62,356 (2 contacts), estimated long liquidation pocket $62,460 – $62,810 |
| Major support 3 (S3) | $61,950 – $62,150 | Major support | S3 pivot $62,117, November 15 low at $61,956, H4 support $61,956 |
Order Book and Liquidity Heatmap
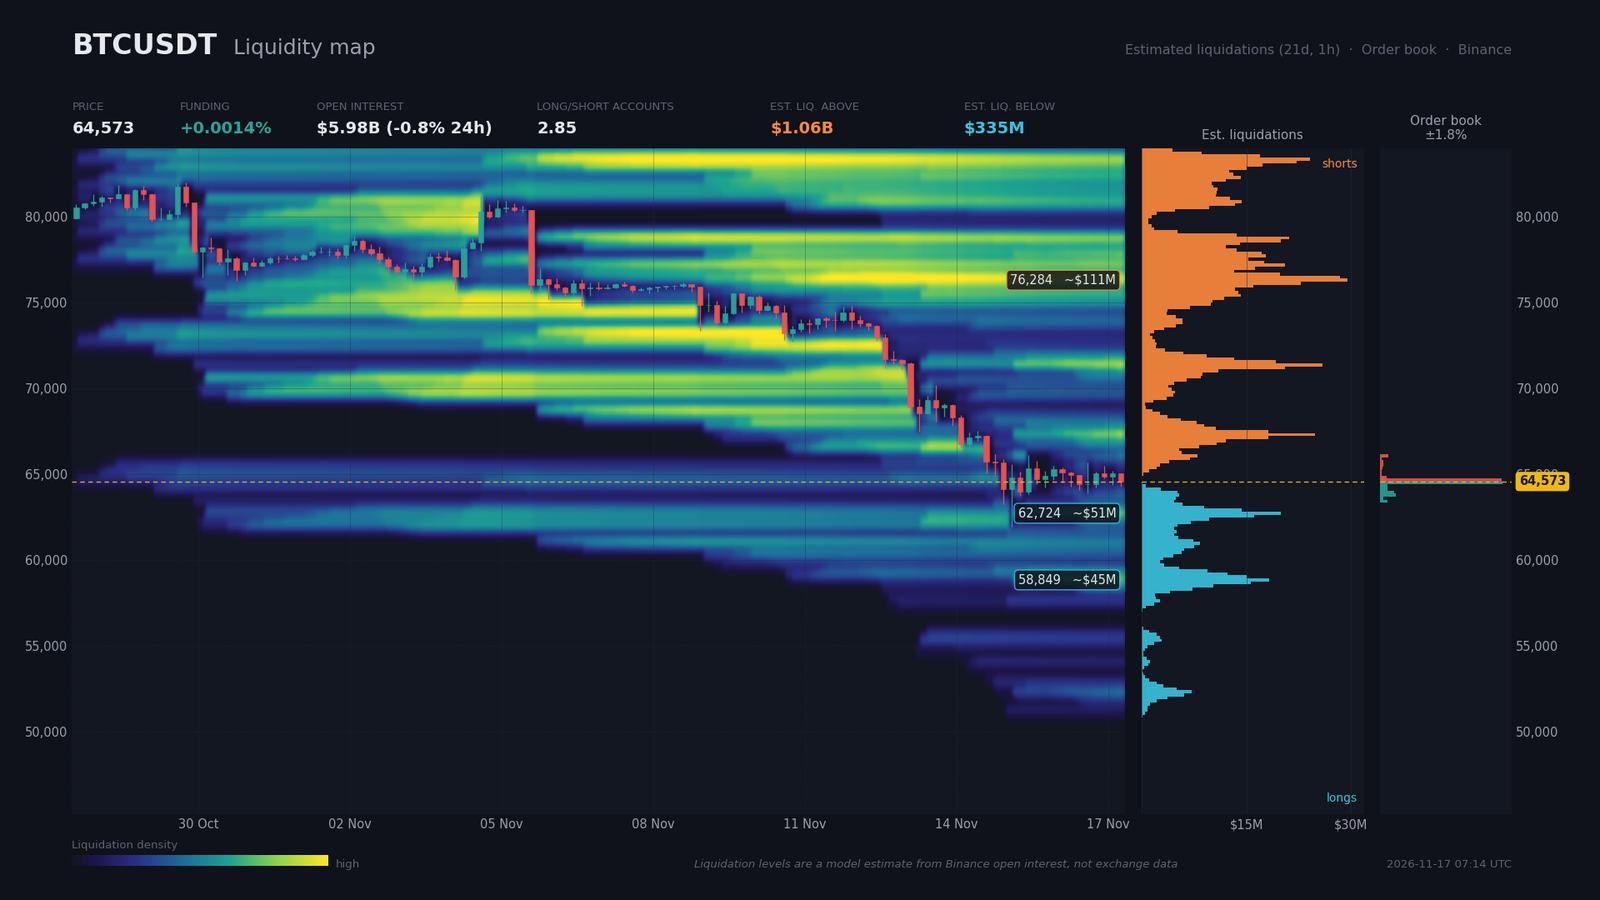
The Binance order book, readable only up to 1.83% from the price, shows two symmetrical $49M walls: a bid at $64,485 and an ask at $64,661, each about 0.14% from the price, framing it in the very short term. The 2% depth imbalance favors buyers by 13% ($72.9M of bids against $56.2M of asks).
Estimated liquidation zones, produced by a model rather than measured, are heavier above: roughly $1.06B of shorts between $71,090 and $83,590, including $110.8M between $76,020 and $76,720. Below, about $335M of longs sit between $62,460 – $62,810 ($51.3M) and $58,590 – $59,470. The $62,500 pocket is the closest. Funding at 0.0014% is neutral, and open interest of $5.98B fell 19% over seven days. The account long/short ratio (2.86) remains bullish, while the top-trader ratio (1.76) is more cautious, and the taker buy/sell ratio of 0.97 points to slightly dominant sellers. The likely consequence is a liquidity sweep toward $62,500 before any durable rebound, with limited squeeze risk while funding stays neutral.
Calendar: Catalysts to Watch
Two events dominate the week, and the second could pull the price out of its structure.
- Tuesday, November 17, 14:30 (Zurich) — US core retail sales (consensus 0.4%, previous 0.9%): an upside surprise would feed the rate-hike scenario.
- Wednesday, November 18, time not communicated — pricing of the Anthropic IPO (CNBC): risk of liquidity drain from risk assets.
- Wednesday, November 18, 20:00 (Zurich) — FOMC minutes (no consensus): the tone on December is the key issue.
- Friday, November 20, 14:25 (Zurich) — Waller speech (FOMC): the last Fed signal on the rate path this week.
Three Scenarios for the Coming Weeks
The horizon is one to two weeks. The probabilities, which total 100%, weigh the daily trend regime, the 3/5 confluence score and the macro backdrop. Risk-reward ratios (R:R) are calculated from the levels in the research note.
Scenario A — Rejection of the bounce and retest of $62,000 (probability 45%)
The central case expects a bounce rejected in the $66,000 – $66,650 zone, with a dated catalyst: the FOMC minutes on November 18 at 20:00. The trigger is an H4 close below $63,850 after that rejection. The path leads to $62,400, the daily support at $62,356 (S2), then to $59,000, the estimated long liquidation pocket between $58,590 and $59,470 and the bottom of the $58,990 value area. The stop sits above $67,600 (R3 and H4 Fibonacci), a $1,600 risk compared with the H4 ATR of $1,225. The R:R toward $62,400 reaches 2.25: ($66,000 – $62,400) ÷ ($67,600 – $66,000) = 3,600 ÷ 1,600. Execution zone: $65,900 – $66,300, reference entry $66,000. Invalidation: H4 close above $67,600.
Scenario B — Technical rebound toward $67,000 (probability 35%)
This case assumes weak retail sales on November 17 or a well-absorbed Anthropic IPO. The trigger is an H4 close above $65,750. The path targets $66,600 (R2), then $67,100 – $67,600 (R3), with a possible extension toward $67,960 (daily 23.6% Fibonacci). The stop sits below $62,300, a $2,500 risk, and the R:R toward $67,100 is only 0.92: ($67,100 – $64,800) ÷ ($64,800 – $62,300) = 2,300 ÷ 2,500. That is not enough to trade B from the long side; this bounce is mainly a selling zone for A. Execution zone: $64,700 – $64,900, entry $64,800. Invalidation: H4 close below $62,300.
Scenario C — Reversal above $71,700 (probability 20%)
This case requires a daily close above $71,700, supported by less hawkish FOMC minutes and a daily RSI that leaves oversold territory. The path crosses the estimated short pocket near $71,350, then $73,500 (daily SMA20 and SMA200) and $76,270, the double-top neckline, where estimated shorts sit between $76,020 and $76,720. The stop sits below $69,100 (61.8% Fibonacci at $69,076), a $2,700 risk against a daily ATR of $2,558. The R:R toward $76,300 reaches 1.67: ($76,300 – $71,800) ÷ ($71,800 – $69,100) = 4,500 ÷ 2,700. Execution zone: above $71,700, entry $71,800. Invalidation: daily close below $69,100.
The signal to watch: an H4 close above $65,750 with above-average volume opens scenario B, while a daily close above $67,960 would shift the view toward scenario C. Conversely, an H4 close below $63,850 reinforces scenario A.
Synthesis and Conclusion
The phase is a bearish impulse digesting a capitulation. ETF outflows and fears of a rate hike weigh on the price, while deleveraging, with open interest down 19% and neutral funding, limits the acceleration. The rebound rests only on short-term signals, such as the H4 MACD or the M15 divergences, which are not enough to reverse the daily picture.
The dominant technical strategy is to sell rallies toward $65,700 – $66,650 rather than chase the decline, with protection at an H4 close above $67,600, ahead of the daily switch level at $71,700. Key levels to watch are $66,000 – $66,650 (expected rejection zone), $63,850 – $64,250 (daily pivot), $62,350 – $63,000 (probable sweep), $58,600 – $59,500 (next target if the November 15 low breaks) and $71,700 (daily invalidation).
Sources
- CZ denies Binance sold crypto, Bitwise sees Solana at $1,100 by 2031, and more — The Block, 17/11/2026
- Bitcoin’s $2 Billion Liquidation Weekend Leaves Traders Watching $60,000 — Decrypt, 16/11/2026
- Bitcoin Price Holds Near $65,000 as Nvidia Turmoil Drags Nasdaq Down 2.5% — Bitcoin Magazine, 16/11/2026
- Why Bitcoin’s June Low May Not Be the Bottom — $58K the Key Test — Bitcoin Magazine, 16/11/2026
- Analysis: The Fed’s chairman sees an AI revolution coming. Now he has to figure out what it means — CNBC, 16/11/2026
- Bitcoin ETFs saw $643M outflows Friday; 2026 barely green — CoinDesk, 02/11/2026
- Bitmine edges toward 5% of ETH supply as treasuries report buys amid market slump — Cointelegraph, 16/11/2026
- U.S. dollar’s AI-driven breakout could become a stock-market wrecking ball — MarketWatch, 16/11/2026
- CFTC backs blockchain-based derivatives infrastructure as Backpack, tZERO win approvals — The Block, 17/11/2026
- SEC proposes crypto asset custody framework for investment advisers and regulated funds — A&O Shearman, 15/10/2026
Disclaimer: This article is for educational and informational purposes only. It does not constitute investment advice, a recommendation to buy or sell, or an invitation to trade any financial asset. Cryptocurrency markets are extremely volatile; any investment decision should be based on your own research (DYOR) and, where appropriate, the advice of a licensed financial adviser.

