


Bitcoin trades near $80,000 on October 26, 8.4% below the September 21 high of $87,385 and barely 1% above the October 24 intraday low of $79,179. The market is in a corrective distribution phase: the short-term structure is bearish, while the long-term trend remains positive above the 200-period simple moving average (SMA200, near $73,000), inherited from the 50/200 golden cross of September 8. Traders are now waiting for the Federal Reserve, whose decision will set the tone for the next sessions.
Leverage remains the immediate engine. On October 24, long positions lost $404M in four hours as the price slipped below $80,000, according to The Block. US spot ETFs recorded $773M of outflows on Thursday and Friday, including $137.9M on Friday, according to Decrypt (October 25). The week still shows +$301M, but October stands at a net outflow of $314M. Crypto Briefing (October 26) counts another $117M of long liquidations over 24 hours, of which $22M to $32M on BTC: a moderate purge rather than a capitulation. Deleveraging is under way but slow: open interest stands at $7.5B, down 4% over seven days from $7.68B on October 17, according to PrimeXBT (October 18).
The macro calendar concentrates the risk. On Wednesday, October 28, the Fed announces its decision, with consensus pointing to a hold at 4.00%; the probability of a December hike has nonetheless risen sharply after September’s CPI and PPI readings. On Thursday, October 29, US GDP and the PCE deflator, the Fed’s preferred inflation gauge, complete the picture. Among the releases of the past week, US housing starts fell 5.2% on October 20, well below the +1.3% consensus, while building permits reached 1.40M against 1.39M expected. In the United Kingdom, unemployment came in at 4.7% against 4.9% expected. The rejection at $85,000 on October 21 and the slide toward $79,200 on October 24, with $404M of longs liquidated, fit this backdrop, although no causal link with these figures has been demonstrated. MarketWatch (October 25) notes that financial conditions are tightening, and Journal du Coin (October 26) describes investors cutting exposure ahead of the Fed.
For the Bitcoin technical analysis that follows, this backdrop neutralizes the signal rather than confirming it. Tensions between Iran and the United States and high bond yields already weighed in early October (CoinDesk, October 8), and negative ETF flows this month point to persistent caution. On the regulatory side, the SEC approved on October 2 3x leveraged exchange-traded products (ETPs) on BTC and ETH, which are not yet listed (CryptoTicker, October 4). Franklin Templeton is also launching two « Bitcoin DRIP » ETFs whose prospectus takes effect on October 27, with 5% bitcoin at launch: their flow impact will be slow (Cryptoast, October 26). The Senate is also awaiting documents from Tether before November 3 (Decrypt, October 23).
Multi-Timeframe Technical Analysis
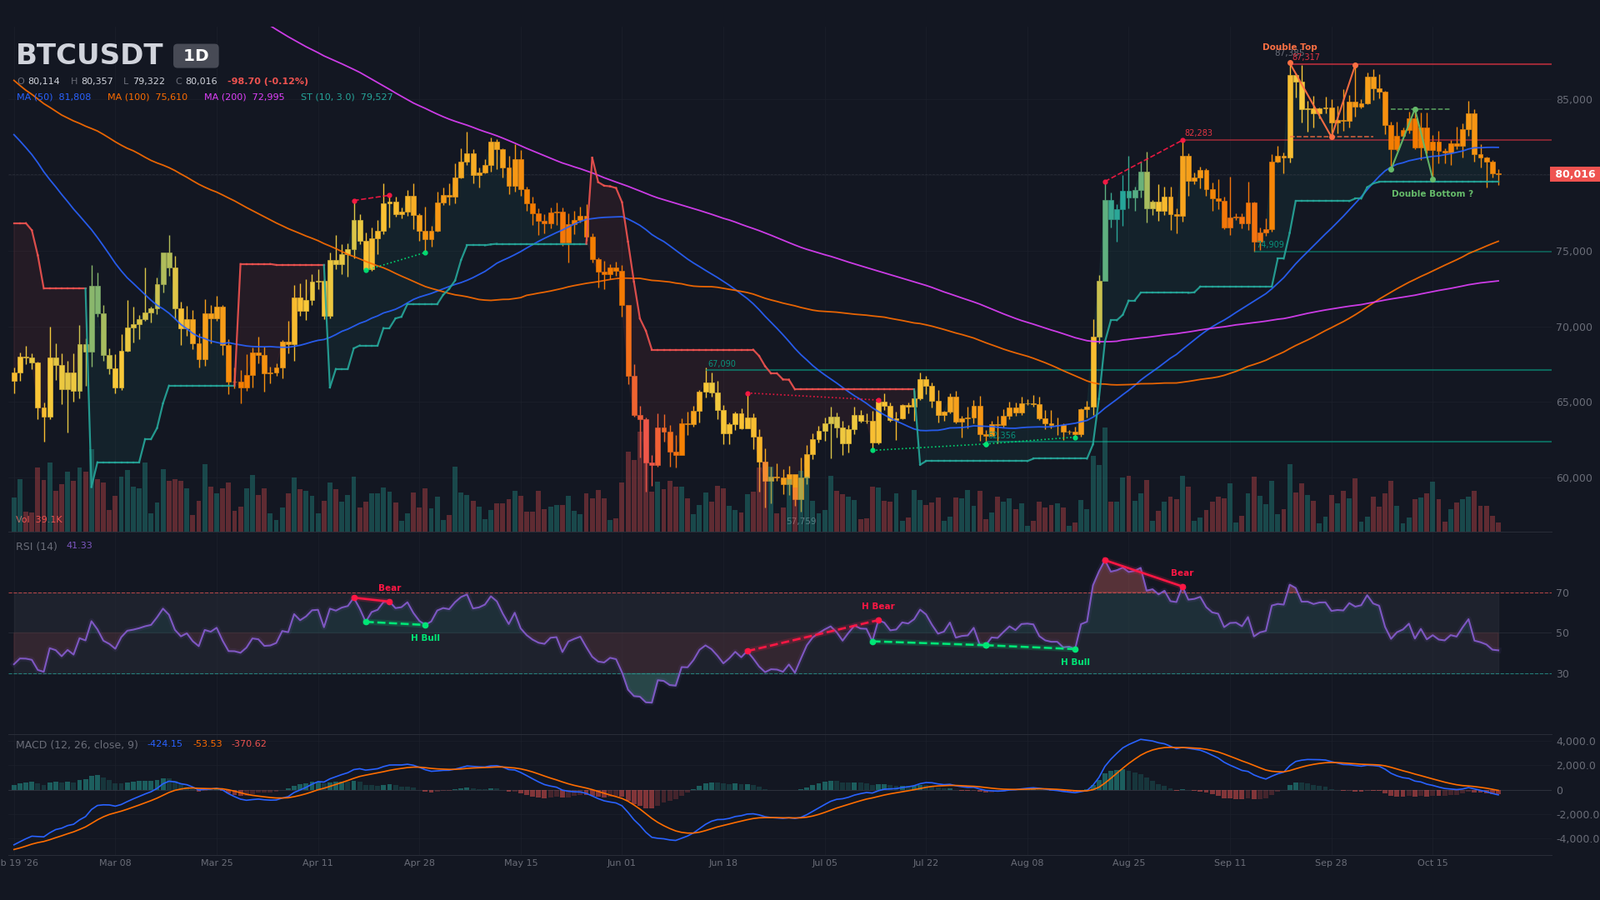
Daily Timeframe (1D): Confirmed Double Top Under Resistance
On the daily chart, the long-term trend stays bullish above the SMA200, but the current phase is a corrective distribution that has been running since the September 21 peak. Lower highs are setting in: $87,250 on October 2, then $84,875 on October 21, while the lows sit at $79,730 (October 15) and $79,179 (October 24). Price trades below the SMA20 (near $82,030) and the SMA50 (near $81,810), which now act as dynamic resistance. The daily SuperTrend remains bullish at $79,530; a break of that level would be a major signal.
The dominant pattern is a confirmed bearish double top, with a neckline near $82,500 and a measured objective at $77,680; the breakdown has already occurred. The algorithm also flags an unconfirmed bullish double bottom, with a neckline at $84,340 and an objective at $88,640. The two formations contradict each other, but the bearish reading is better supported as long as $84,340 is not reclaimed. Resistances to watch are $82,280 (one contact) and $87,320 (two contacts); supports are $74,910 (one contact) and $67,090 (two contacts).
On the oscillators, RSI (~41) is neutral and has lost the 50 to 57 zone it held in mid-October. The last regular bearish divergence, between August 21 and September 3 (RSI moving from ~86 to ~73), is old. MACD has been below zero and below its signal line since the bearish crossover of September 29, with a wide negative histogram. Finally, the current candle’s volume is only 31% of its 20-period average: it is provisional and says little about real commitment.
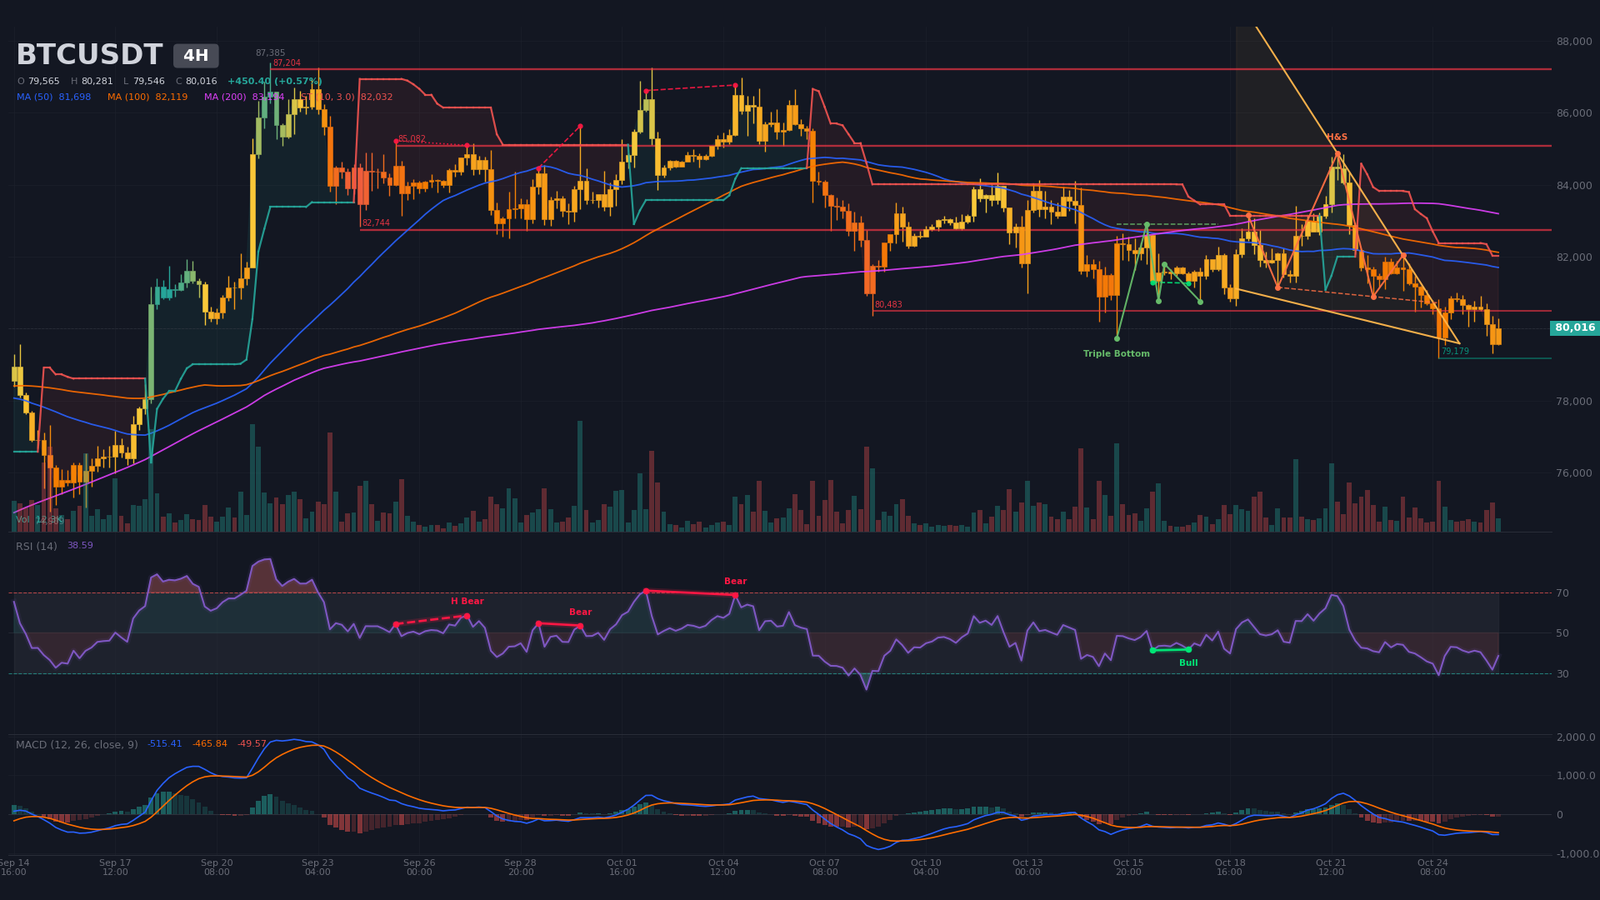
Intermediate Dynamics (4H): Confirmed Head-and-Shoulders
The 4H chart validates and reinforces the daily scenario. Lower highs keep coming ($84,875 on October 21, $82,035 on October 23, $81,000 on October 25), and price stays under its three moving averages: SMA20 (near $80,760), SMA50 (near $81,700) and SMA200 (near $83,190). The SuperTrend is bearish around $82,030. A bearish head and shoulders pattern is confirmed, with a neckline at $80,890 and an objective at $76,920. A bullish triple bottom also presented as « confirmed » (neckline $82,900, objective $85,380) is contradicted by current dynamics, since price remains below its resistances. The wedge detected between $80,490 and $79,730 has passed its estimated apex of October 25.
RSI (~39) is leaving oversold territory after a low near ~29 on October 24. The regular bullish divergence of October 16 and 17 is too marginal to support a signal, with RSI barely above 41. MACD has been below zero and below its signal line since the bearish crossover of October 22, with a slightly negative histogram. Volume is at 75% of its average. Resistances stack up at $80,480 (two contacts), $82,740 (three) and $85,080 (three), with immediate support at $79,180.
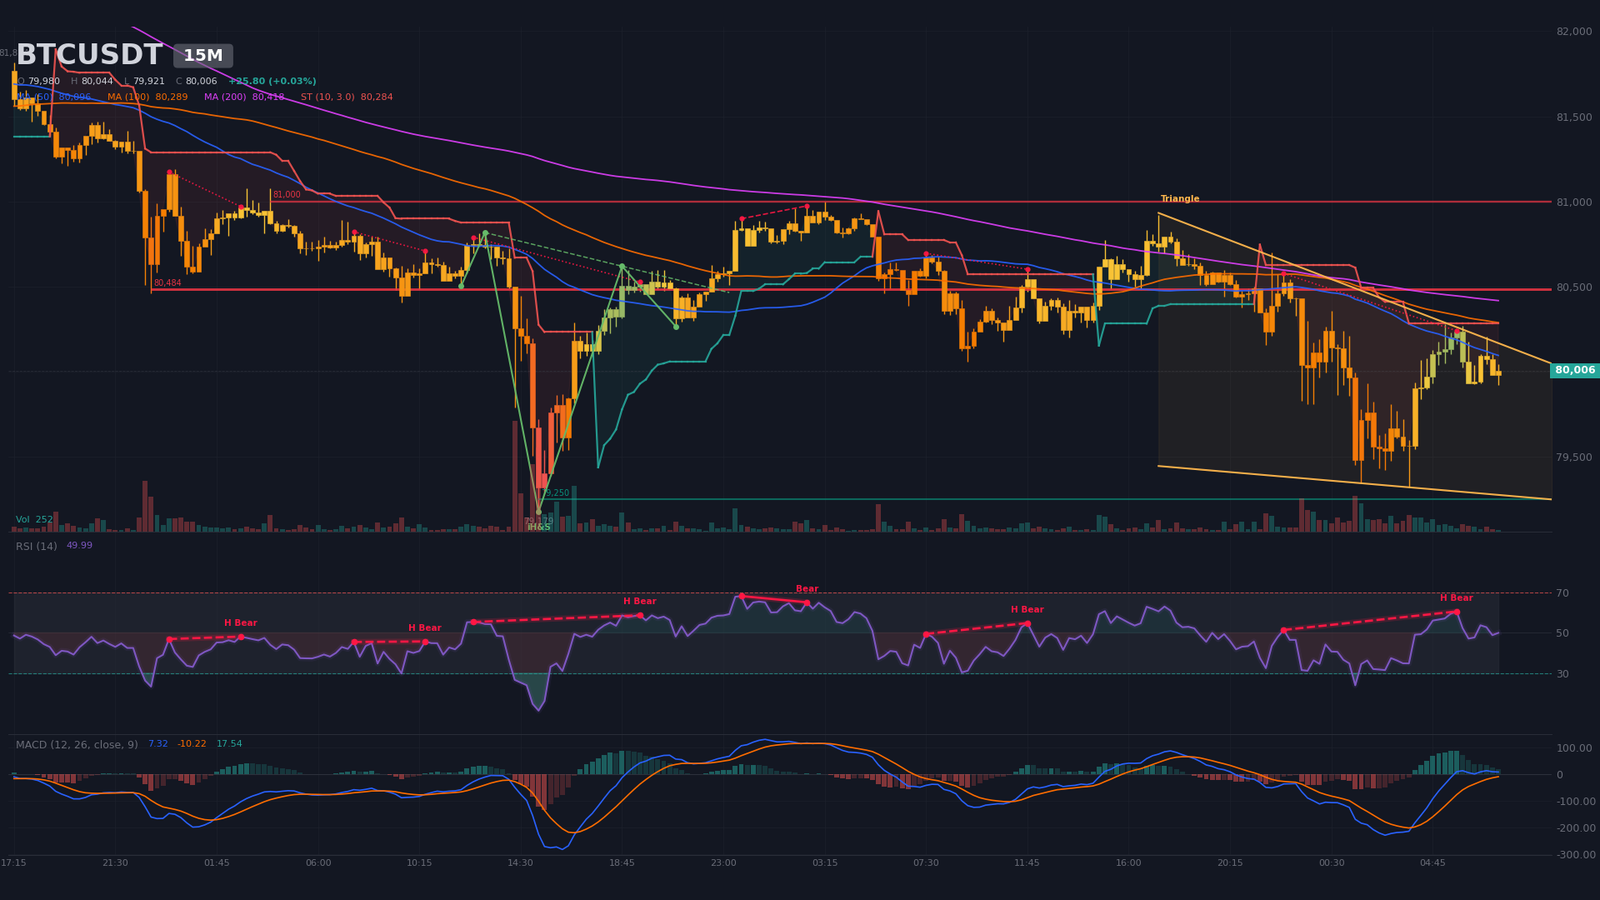
Intraday Structure (15m): Compression Wedge $79,300–$80,290
Intraday, price forms a compression wedge (wedge) with an upper boundary near $80,290, a lower boundary near $79,300 and an estimated apex on October 27 around 04:50. Price (near $80,000) holds above the SMA20 (near $79,930) but below the SMA50 (near $80,100) and SMA200 (near $80,420); the SuperTrend is bearish at about $80,280. MACD has moved back above zero following its bullish crossover on October 26 at 04:00, with a positive histogram, while RSI (~50) stays neutral.
The signal remains fragile. A recent hidden bearish divergence (price from $80,580 to $80,240 while RSI moves from ~51 to ~61) is a reminder that rallies are being sold. The confirmed inverse head and shoulders (neckline $80,620, objective $82,100) is old and has failed, so its reading is neutralized. Resistances sit at $80,480 (eight contacts) and $81,000 (three), with support at $79,250 (two contacts). Volume is only 24% of average: the compression is happening without conviction, leaving the decision to the next macro catalyst.
Synthesis Across Timeframes
| Timeframe | Dominant trend | RSI (14) | MACD | Chart pattern |
|---|---|---|---|---|
| Daily (1D) | Long-term bullish, corrective bearish leg | ~41 | Below zero, bearish crossover on September 29 | Confirmed double top (inverse case: unconfirmed double bottom) |
| 4 hours (4H) | Bearish | ~39 | Below zero, bearish crossover on October 22 | Confirmed bearish head and shoulders |
| 15 minutes (15m) | Neutral (compression) | ~50 | Bullish crossover on October 26, above zero | Compression wedge |
Map of Technical Levels and Pivots
The map combines classic pivots (daily, 4H, 15m), detected supports and resistances, pattern objectives and modeled liquidation pockets; no Fibonacci extension is retained. The central short-term pivot sits near $80,000: while price holds above the $79,750–$80,300 zone, selling pressure is not validated, but a move below this area opens the way to the major supports.
| Level | Price (USD) | Category | Technical basis |
|---|---|---|---|
| Major resistance 3 (R3) | $84,950 – $85,250 | Resistance / liquidity | Estimated short pocket (peak near $85,070), 4H resistance at $85,080 (3 contacts), rejection of October 21 |
| Major resistance 2 (R2) | $82,000 – $82,750 | Resistance | Daily SMA20, 4H SuperTrend (near $82,030), daily resistance at $82,280, double top neckline, 4H resistance at $82,740 |
| Immediate resistance (R1) | $80,480 – $81,000 | Resistance | 4H/15m resistance at $80,480 (8 contacts on 15m), 4H neckline at $80,890, 15m resistance at $81,000 |
| Central pivot (P) | $79,750 – $80,300 | Pivot | Daily pivot (near $80,310), 15m pivot (near $80,020), 4H pivot (near $79,750) |
| Immediate support (S1) | $79,180 – $79,530 | Support | October 24 low ($79,179), 15m support at $79,250, daily SuperTrend (near $79,530) |
| Major support 2 (S2) | $78,600 – $78,850 | Support / liquidity | Estimated long pocket (peak near $78,714), daily S2 at near $79,120 just above |
| Major support 3 (S3) | $76,900 – $77,700 | Support / objective | Double top objective (near $77,680), 4H head-and-shoulders objective (near $76,920) |
Order Book and Liquidity Heatmap
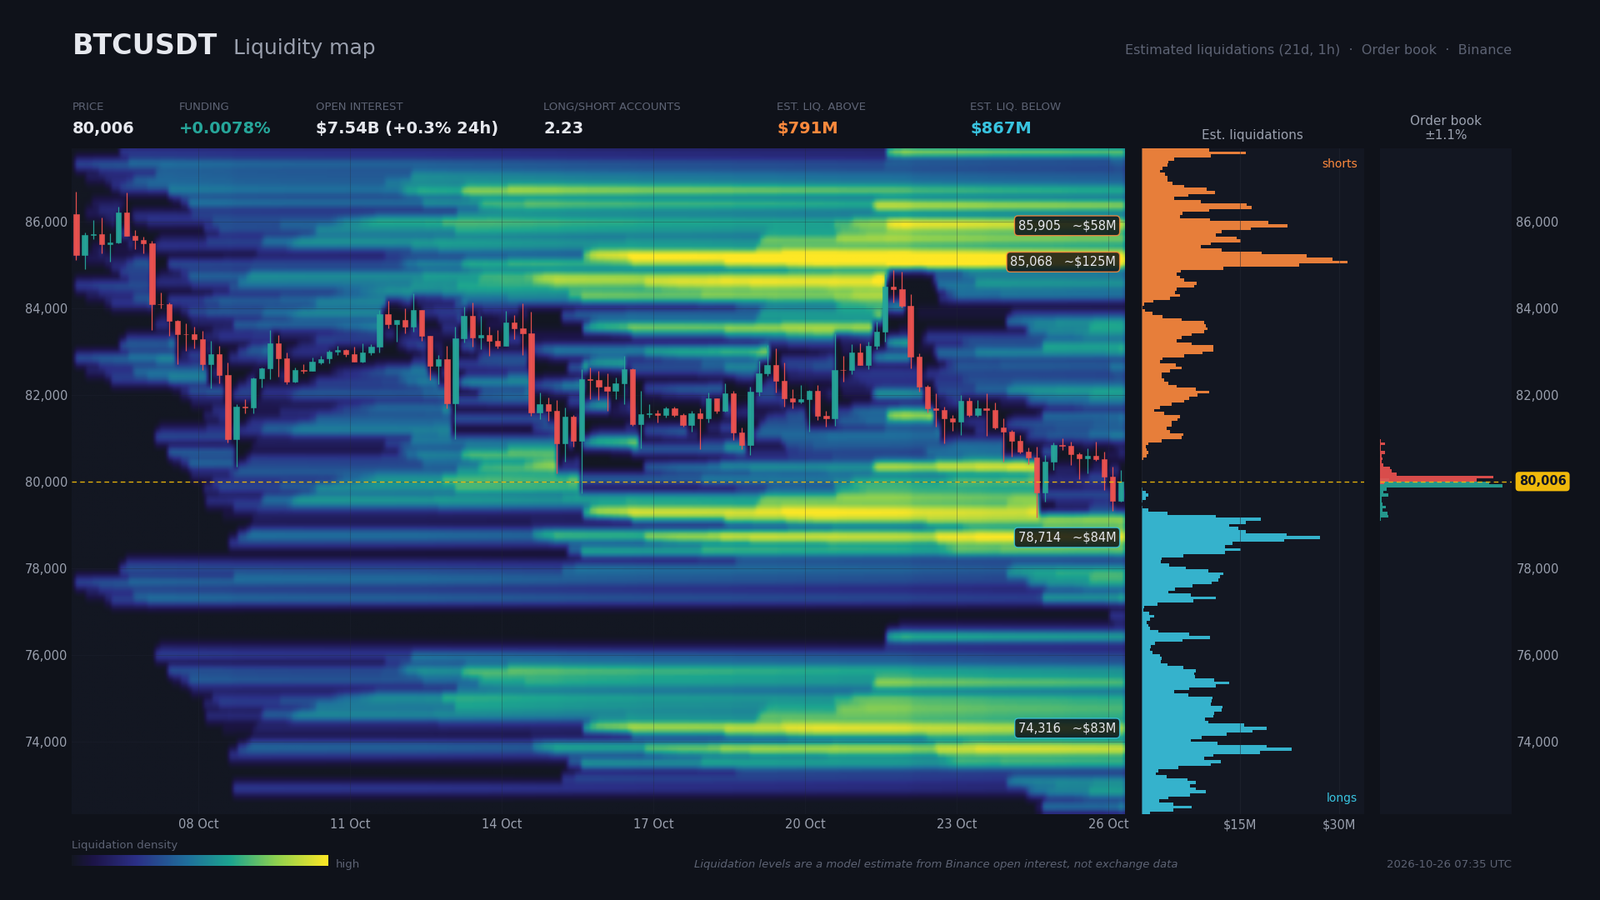
The order book is visible only within 1.05% of price (Binance perpetual and spot), which limits the read to the immediate term. Sell walls sit at $80,040 ($21.9M), then $80,110 ($25.6M, or +0.13%), with $3.7M at $80,180 and $2.5M at $80,250. On the buy side, walls are at $79,970 ($24.7M) and $79,900 ($27.7M), then much smaller levels ($1.7M at $79,690, $1.9M at $79,200). The imbalance is only +2.5% in favor of buyers ($64.5M versus $61.3M within a 2% band): the market is nearly symmetric and reflects waiting.
Modeled liquidation zones, which come from a model rather than a direct measurement, are more telling. Below price, a long pocket runs from $78,610 to $78,820 (peak near $78,714, about $84M, or –1.6%), followed by pockets at $74,070–$74,420 (about $83M) and $73,720–$74,000 (about $79M), for roughly $867M in total. Above price, the main short pocket sits between $84,960 and $85,240 (about $125M, or +6.3%), followed by pockets at $85,870–$86,010 and $86,290–$86,430 (about $791M in total). The lower pocket is closer, which makes it the most probable magnet.
Funding is slightly positive (0.0078%, or about 8.5% annualized), open interest is stable over 24 hours (+0.35%) and down 4.1% over seven days. The accounts long/short ratio (2.23) shows a buying crowd, while the top traders’ position ratio (1.67) is more measured, and the taker flow (0.97) leans slightly toward selling. This setup points to a risk of a liquidity sweep toward $78,700 before any durable rebound; a squeeze toward $85,000 would first require reclaiming $82,500.
Calendar: Catalysts to Watch
The week’s calendar is dense and will shape how the current structure resolves. Releases from the past week have not produced a clear causal link with price. The upcoming events below carry the highest impact.
- Wed, October 28, 19:00 (Zurich) — Fed rate decision and FOMC statement (consensus 4.00%, previous 4.00%): the tone on a December hike is the key stake. A restrictive message would weigh on Bitcoin, while a softer tone would support a rebound. Microsoft and Alphabet also report that day.
- Thu, October 29, 13:30 (Zurich) — core PCE m/m (consensus 0.5%, displayed previous 3.4%, to be read with caution) and advance GDP q/q (consensus 3.5%, previous 6.1%): a hot PCE combined with strong growth would be a headwind.
- Thu, October 29, 14:15 (Zurich) — ECB deposit rate (consensus 2.5%, previous 2.5%): secondary impact, to be integrated into the global liquidity read.
- Tue, November 3 — US midterm elections: Polymarket gives Democrats a 93% chance of winning the House (BeInCrypto, October 26), a scenario markets may already partly anticipate.
Three Scenarios for the Coming Weeks
The three scenarios below cover a horizon of a few sessions to two weeks, up to the Fed and PCE releases. The analyst’s probabilities total 100%.
Scenario A — Rejection Below $81,000 and Long Liquidation Sweep (probability 50%)
The central scenario rests on a failure below the $80,480–$81,000 zone, which would be confirmed by a 4H close below $79,500 around the FOMC on October 28 at 19:00 and the PCE on October 29 at 13:30. The path would first lead to $79,180, then to the estimated long pocket at $78,700; the double top objective sits at $77,680, and a cautious extension toward $76,920 would match the 4H head-and-shoulders objective. Risk management places the stop at $81,700, about 1.5 times the 4H ATR (near $741) from $80,600, with an R:R of about 1.7 toward $78,700 and 2.6 toward $77,680. Execution zone: sell into rallies between $80,450 and $80,900. Invalidation: 4H close above $81,700, the 4H SMA50.
Scenario B — Compression Then Range $79,200–$81,000 (probability 30%)
In this scenario, price stays trapped in the 15-minute wedge until its apex on October 27 around 04:50, holding above $79,250. Oscillations unfold between $79,300 and $80,500, with a possible test of $81,000; a rebound toward $82,030–$82,280 would be a selling opportunity rather than a recovery. The stop should be at least 1 ATR on the 15m (near $202), roughly $200 to $300 beyond the wedge boundary. Execution zone: tactical buying near $79,300 or selling near $80,500. Invalidation: 15m close outside the wedge, then a 4H close below $79,180 or above $81,000.
Scenario C — Bullish Invalidation (probability 20%)
The bullish scenario requires a daily close above $82,500, with the SMA20 and SMA50 reclaimed together. The path leads to the double bottom neckline at $84,340, then to the estimated short pocket near $85,070, and finally to the double bottom objective at $88,640, a hypothesis still to be confirmed. It would be fueled by a softer Fed tone, a moderate PCE and accelerating ETF inflows. Execution zone: buy on a retest of $82,000–$82,500 after a close above that band. Invalidation: daily close below $79,500.
Summary and Conclusion
Bitcoin is going through a correction-distribution phase below the $82,000–$82,750 zone, within a long-term trend that remains positive above the SMA200. Negative ETF flows in October (a net outflow of $314M for the month) and still-crowded long positioning do not support an immediate recovery. On the other hand, accumulation by large holders, highlighted by Santiment, and the long purge of October 24 prevent a disorderly breakdown: the context neutralizes rather than contradicts the technical signal. Santiment’s on-chain data is ten days old, and the firm notes that simultaneous accumulation by smaller holders could cap a rally toward $90,000.
The dominant technical strategy is to favor selling into rallies below $81,000 as long as the 4H close stays under $81,700, with protection above that zone. A break of the daily SuperTrend and of the $79,180 low would open the estimated long pocket toward $78,700. Critical levels are $82,000–$82,750 for a recovery, $80,480–$81,000 for rejection, $79,180–$79,530 for immediate support, $78,600–$78,850 for the long pocket and $77,680 for the double top objective. Execution will wait for the reaction to the FOMC, since volatility on October 28 and 29 can invalidate any intraday setup.
Sources
- A Perfect Storm for Bitcoin? Fed, PCE, GDP and Big Tech Earnings Ahead — CryptoPotato, 26/10/2026
- Bitcoin : ce nouvel ETF transforme les dividendes du S&P 500 en BTC — Cryptoast, 26/10/2026
- Bettors Expect a Democratic Midterm Win. How Gold, Bitcoin, and Stocks Could Feel It — BeInCrypto, 26/10/2026
- Bitcoin Drops Below $80,000 Facing Three Threats This Week — Journal du Coin, 26/10/2026
- Bitcoin ETFs Snap Two-Week Losing Streak Despite Late-Week Slide — Decrypt, 25/10/2026
- Crypto longs lose $404 million in four hours as bitcoin briefly slips below $80,000 — The Block, 24/10/2026
- Here’s the real signal to watch for the Fed’s next move — MarketWatch, 25/10/2026
- $117M in crypto long positions liquidated in 24 hours as leveraged bulls get flushed — Crypto Briefing, 26/10/2026
- Bitcoin ETFs bleed nearly $500 million in one day: Crypto Daily — CoinDesk, 08/10/2026
- Bitcoin Whale Wallets Reach Record 20,338 as Large Holders Defy October Slide — BigGo Finance, 16/10/2026
- SEC clears 3x leveraged Bitcoin and Ether ETPs — CryptoTicker.io, 04/10/2026
- Bitcoin Futures Open Interest Falls to $7.68 Billion as Funding Stays Positive — PrimeXBT, 18/10/2026
- Senate Democrat Probes Tether Payments to Ex-White House Crypto Adviser’s Firm — Decrypt, 23/10/2026
Disclaimer: This article is for educational and informational purposes only. It does not constitute investment advice, a recommendation to buy or sell, or an invitation to trade any financial asset. Cryptocurrency markets are extremely volatile; any investment decision should be based on your own research (DYOR) and, where appropriate, the advice of a licensed financial adviser.

