


Bitcoin trades near $73,590 on November 11, 15.8% below the period high of $87,385 set in early October. The recent low of $72,690, printed on November 10, closes a 9.6% slide over twenty candles. Price now sits on the 200-period simple moving average on the daily chart (SMA200, about $73,140), which it holds only narrowly. The move looks less like a routine pullback than a distribution phase turning into a bearish impulse, with a medium-conviction bearish bias and a confluence score of 4/5.
Derivatives positioning is the immediate driver. According to the estimated liquidation model, long positions cluster between $72,060 and $72,650, just below the market, while shorts sit between $75,950 and $76,540. Funding is slightly positive at 0.0079% (8.7% annualized), and open interest, at $7.38B, has fallen 4.2% over seven days, a moderate deleveraging.
Macro, however, dominates the sequence. Core CPI released on November 10 rose 0.3% month over month against 0.2% expected, and according to The Block (November 10), Bitcoin promptly slipped below $74,000. CNBC flags rising odds of a Fed rate hike, ING tells investing.com of “a pause before a December hike,” and MarketWatch reports the 10-year Treasury yield back at 5%. Earlier, November 6 payrolls beat expectations with 165K jobs against 65K forecast, while unemployment came in at 4.1% versus 4.2% expected.
On the regulatory and sector side, the signals remain structural. Project Faro is raising about $270M for a dollar stablecoin targeted for the first half of 2027 (Cointelegraph, November 10), and the SEC’s proposal on crypto custody by advisers and regulated funds, published in the Federal Register on October 6 with a 60-day comment period, has no immediate price effect. Bitmine reported a $6.3B net loss tied to a 44% drop in ether, while SOL touched a near three-month low around $82. ETF flows and on-chain data are unavailable, so demand cannot be confirmed.
Multi-Timeframe Technical Analysis
Daily Timeframe (1D): Confirmed Double Top Below the Neckline
The trend is bearish and the structure reads as a series of lower highs: $87,250 on October 2, then $84,340, $81,950 and $81,190 on November 4. Lows follow the same slope, from $82,500 to $76,270 on October 30, then below $73,000. Price remains under the SMA20 (about $77,770) and SMA50 (about $81,160), and sits only 0.6% above the SMA200. The SuperTrend is bearish (about $80,230) and no 50/200 crossover is signaled. A daily close below the SMA200 would be a major signal.
The algorithm flags a confirmed bearish double top, with a neckline at $76,270 and a target of $70,970, its last pivot dating from November 4. The wedge opened on October 2, whose lower boundary stood at $77,980, has broken to the downside. A bullish double bottom, with a neckline at $84,340 and a target of $88,640, is detected but unconfirmed: it remains a hypothesis far above the current price.
The RSI (14) sits near oversold at about 34, after readings between roughly 36 and 51 since early October. A hidden bearish divergence, a continuation signal, links October 28 to November 4: price printed a lower high ($81,800 then $81,190) while the RSI climbed from 48 to 51. The MACD remains below its signal line and below zero, with a bearish crossover dated September 29 and a negative histogram still expanding. Today’s volume, at about 19% of its average, is provisional. The November 5 session, down 5.5%, carried the highest volume of the last 40 candles, which validates the breakdown.
Intermediate Dynamics (4H): Sequence of Lower Highs and Lows
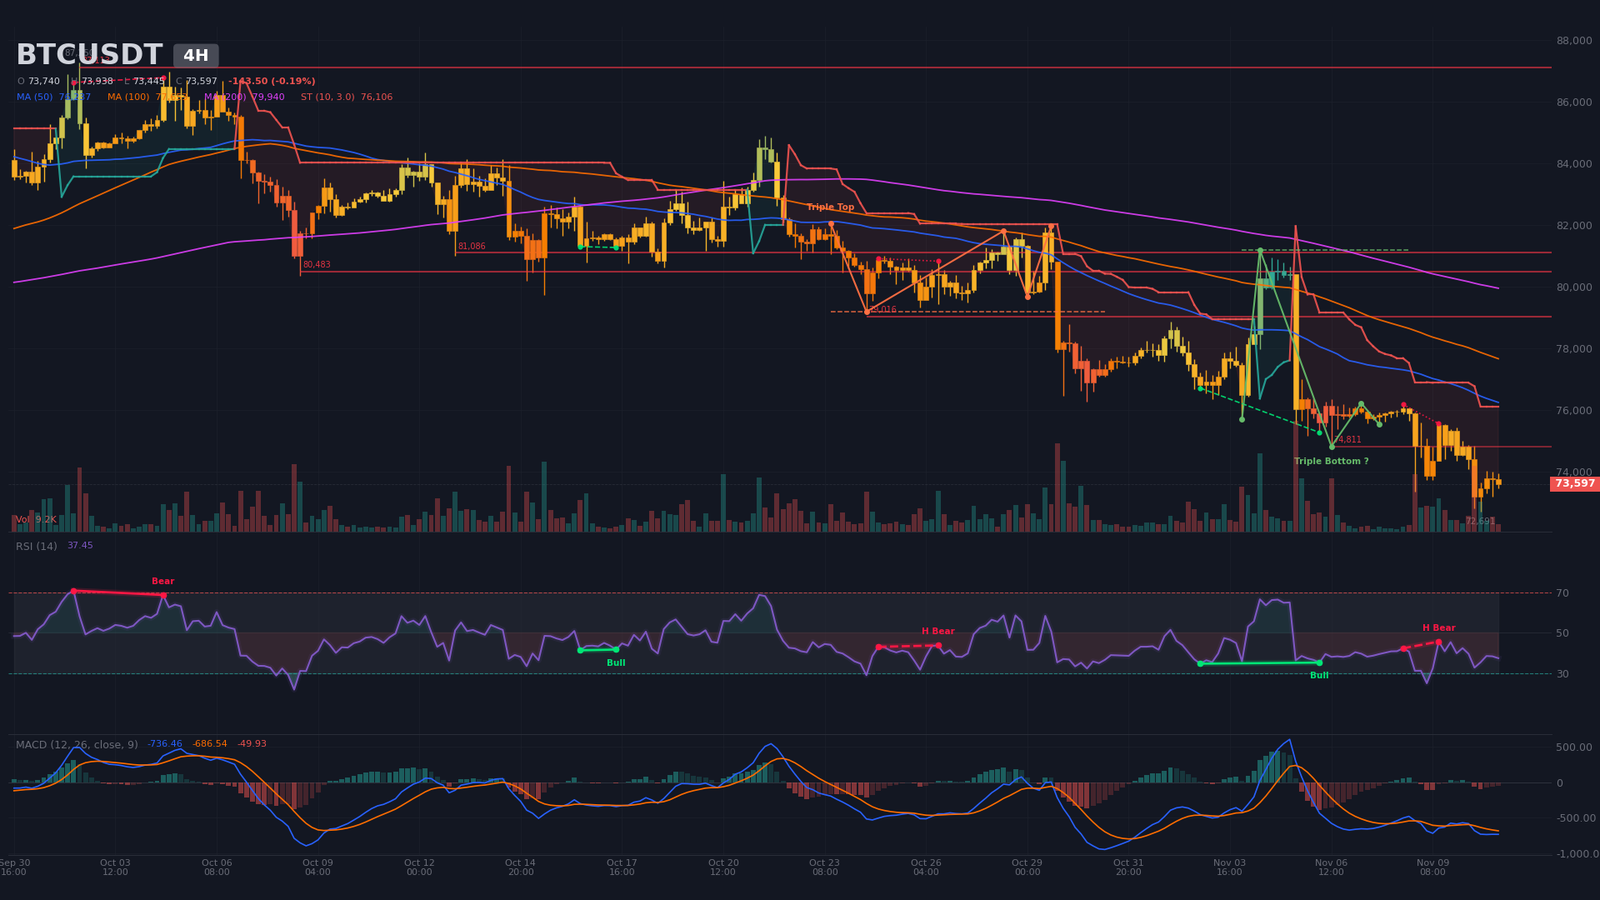
On the 4-hour chart, lower highs succeed one another: $81,190 on November 4, then $76,350, $76,210, $76,170 and $75,550. Lows follow: $75,160, $74,810, $73,330 and $72,690 on November 10. Price sits below the SMA20 (about $74,730), SMA50 (about $76,240) and SMA200 (about $79,940), and the bearish SuperTrend lies near $76,110. The RSI, at about 37, is neutral. The MACD is below zero with a bearish crossover on November 10 and a slightly negative histogram, while volume runs at only 41% of its average.
A regular bullish divergence appeared between November 2 and 6, with price moving from $76,700 to $75,260 while the RSI held at 35. It is weak and never produced a durable rebound, especially since a hidden bearish divergence on November 8 and 9 offsets it. The bullish triple bottom, with a neckline at $81,190 and a target of $87,030, remains unconfirmed and should be set aside in the short term. The bearish triple top, with a neckline at $79,180, is confirmed, and its $76,430 objective has already been reached. Next 4H resistances are $74,810, then $79,020 and the $80,480–$81,090 zone.
Intraday Structure (15m): Compression Wedge Below $73,955
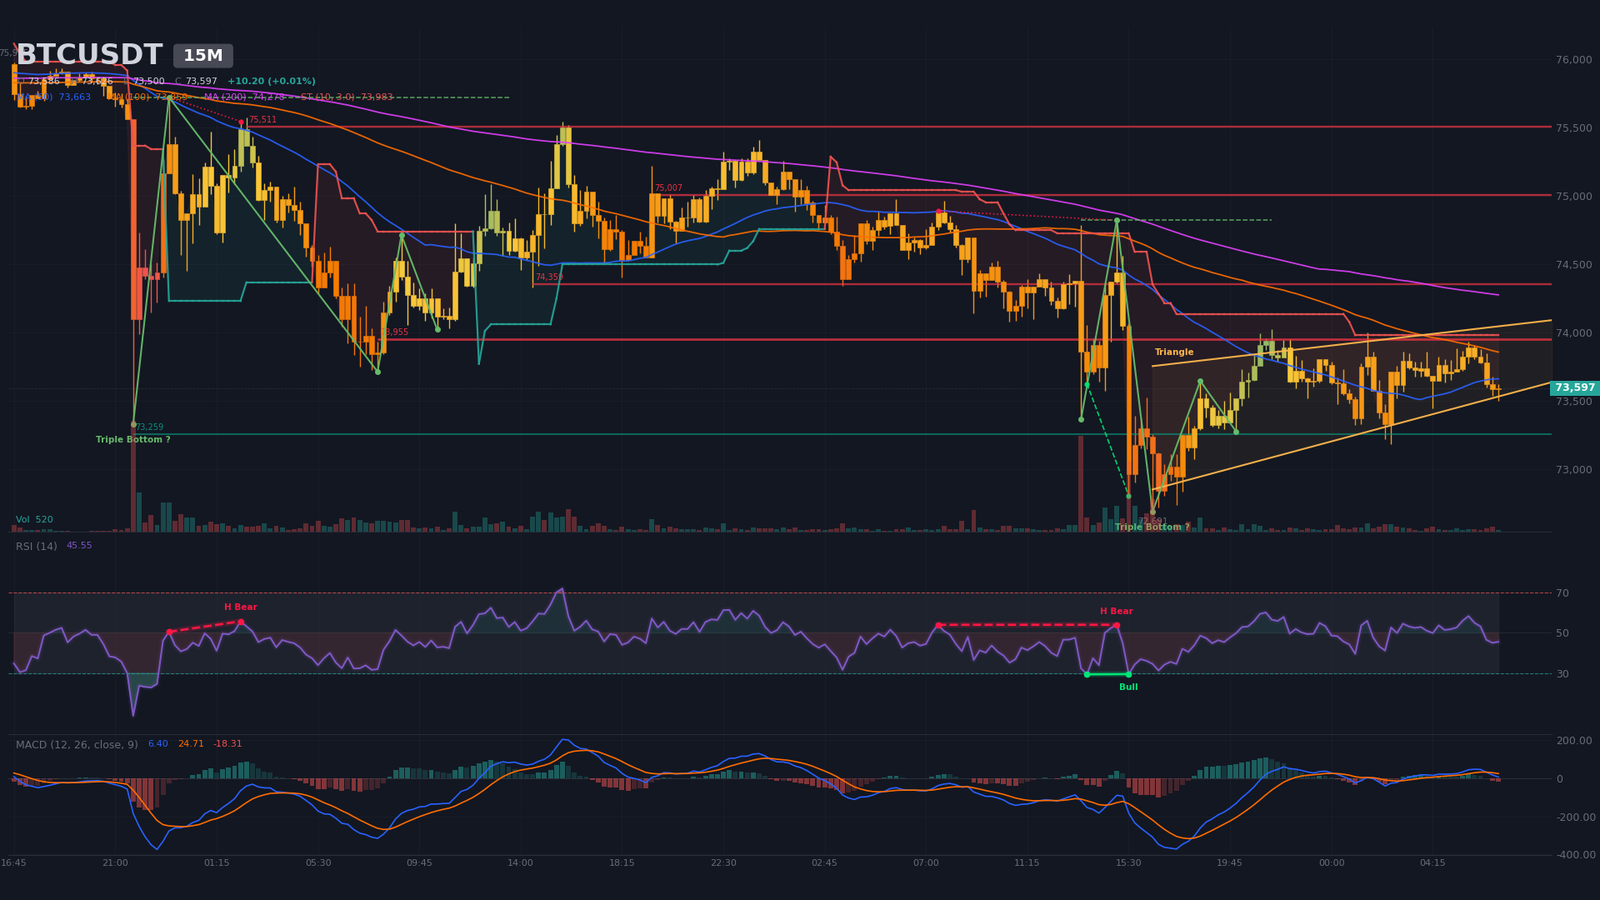
The wedge detected since late on November 10 is bounded between $73,475 and $74,020, with an estimated apex in the early hours of November 12, so resolution is imminent. Resistances stand at $73,955 (four contacts), $74,360, $75,010 and $75,510, while immediate support sits at $73,260 (two contacts). Price is below the 15-minute SMA20, SMA50 and SMA200 (about $73,700, $73,660 and $74,280), with a bearish SuperTrend near $73,980. The RSI is at 46, the MACD crossed down on November 11, and volume runs at 60% of its average.
The bullish 15-minute triple bottoms, with a neckline at $74,820 and a target of $76,540, are unconfirmed. A break and 15-minute close below $73,470 would give the bearish signal, while a reclaim of $74,020 would invalidate the wedge. The 15-minute ATR (about $185) calls for wide stops to limit false signals.
Multi-Timeframe Synthesis
| Timeframe | Dominant Trend | RSI (14) | MACD | Chart Pattern |
|---|---|---|---|---|
| Daily (1D) | Bearish (selling impulse) | ~34 | Below signal and zero, bearish crossover on Sept. 29 | Confirmed double top (target $70,970) |
| 4 hours (4H) | Bearish (lower highs and lows) | ~37 | Bearish crossover on Nov. 10, weak histogram | Unconfirmed triple bottom (hypothesis) |
| 15 minutes (15m) | Neutral to bearish | ~46 | Bearish crossover on Nov. 11 | Compression wedge |
Key Level Map: Pivots and Support/Resistance
The map combines daily and 15-minute pivots, detected swings, the daily SMA200, pattern targets, order-book walls and estimated liquidation zones. No Fibonacci extension is retained, since the reference impulse cannot be identified unambiguously. The short-term central pivot sits between $73,600 and $73,950: while price remains below this zone, sellers keep the upper hand.
| Level | Price (USD) | Category | Technical Basis |
|---|---|---|---|
| Major Resistance 3 (R3) | $75,950 – $76,700 | Resistance / liquidity | Estimated short pocket $75,950–$76,540 (~$106M), daily neckline $76,270, daily R2 $76,675 |
| Major Resistance 2 (R2) | $74,800 – $75,250 | Resistance | 4H resistance $74,810, daily resistance $74,909, 15m $75,008, daily R1 $75,219 |
| Immediate Resistance (R1) | $74,000 – $74,400 | Resistance | Upper wedge bound $74,023, 15m resistance $74,359, sell wall $74,003 |
| Central Pivot (P) | $73,600 – $73,950 | Pivot | 15m pivot $73,602, daily pivot $73,955, 15m resistance $73,955 (4 contacts) |
| Immediate Support (S1) | $73,150 – $73,530 | Support | Buy wall $73,531 (~$44.8M), 15m support $73,259, daily SMA200 about $73,137 |
| Major Support 2 (S2) | $72,060 – $72,700 | Support / liquidity | November 10 low $72,691, estimated long pocket $72,056–$72,646 (~$158M) |
| Major Support 3 (S3) | $70,880 – $71,240 | Support / target | Daily S2 $71,235, double-top target $70,969, estimated pocket $70,877–$71,113 |
Order Book and Liquidity Heatmap
The Binance book (perp and spot) is visible only within 1.38% of price, so the walls cover just the immediate vicinity. On the sell side, $73,649 (~$38.5M, 0.08% above the market) and $73,767 (~$12.0M) form the first barrier, followed by $73,885 and $74,003 ($1.5M and $2.6M). On the buy side, the reference wall is at $73,531 (~$44.8M), relayed by $2M to $3M walls at $73,413, $72,941 and $72,705. Within 2%, bids total $62.5M against $60.3M of asks, an imbalance of just 1.8%: the book is balanced. These walls can be pulled within seconds and suggest price is trapped between $73,530 and $73,650.
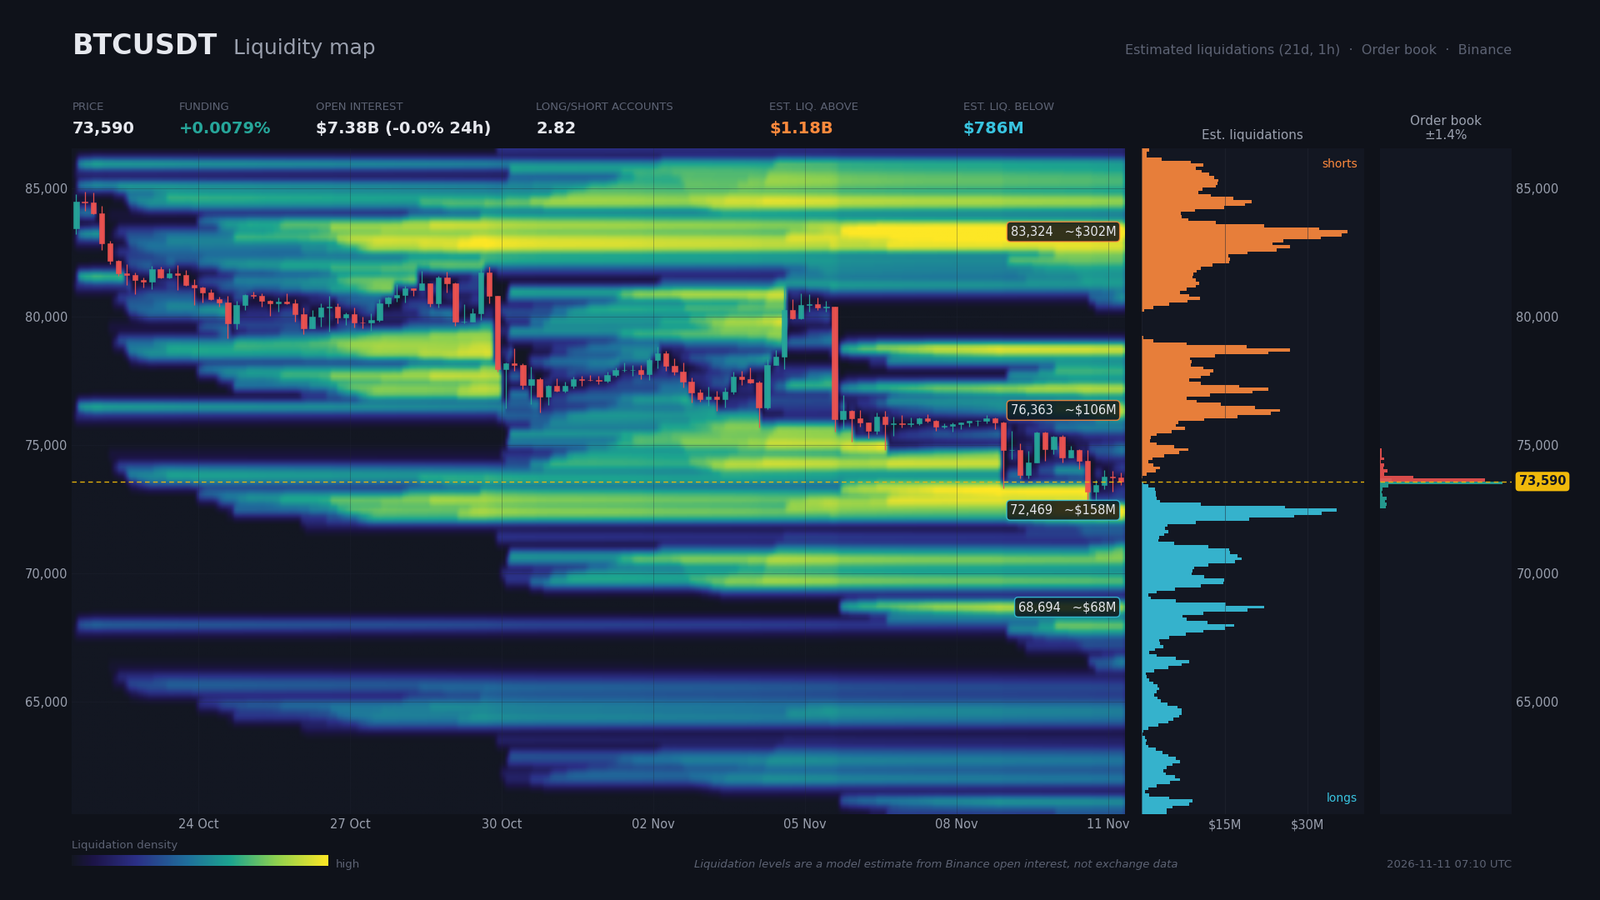
Estimated liquidation zones, derived from a model built on open interest and typical leverage rather than a direct measurement, sit on both sides of price. Above, short exposure concentrates between $75,950 and $76,540 (~$106M, 3.8% above the market), then between $82,440 and $83,740 (~$302M, 13.2% above) and between $84,210 and $84,800 (~$89M). The model counts roughly $1.18B of short positions above the price. Below, longs are exposed between $72,060 and $72,650 (~$158M, 1.5% below), between $70,880 and $71,110 (~$36M) and between $68,520 and $68,870 (~$68M), for a modeled total of about $786M.
The long/short ratio of accounts stands at 2.82, and 2.24 among top traders, while the 24-hour taker buy/sell ratio comes in at 0.95. Positioning remains mostly long, with a slightly bearish aggressive flow. This imbalance mechanically exposes price to a liquidity sweep toward $72,060–$72,650, the first significant pocket. The risk of an upside squeeze stays low as long as $76,000 is not reclaimed.
Calendar: Catalysts to Watch
Two releases dominate the week: the PPI on November 13 and retail sales on November 17. No Deribit options expiry or CME settlement appears in the calendar provided.
- Thursday, November 12, 14:30 (Zurich) — US initial jobless claims (195K expected; previous 189K): first test of the labor trend after the November 6 surprise.
- Friday, November 13, 14:30 (Zurich) — core PPI m/m (consensus 0.4%; previous 1.3%): it extends the inflation theme, and an upside surprise would reinforce the rate-hike scenario.
- Tuesday, November 17, 14:30 (Zurich) — retail sales ex-autos (consensus 0.4%; previous 0.9%): a soft print would ease pressure on rates, a strong one would add to it.
Three Scenarios for the Coming Weeks
The scenarios cover the coming weeks and revolve around the macro calendar. Probabilities are the analyst’s own and total 100%.
Scenario A — Bearish Continuation Toward the Double-Top Target (probability 55%)
The central scenario extends the distribution. The dated catalyst is the PPI on November 13 at 14:30, against a backdrop of 5% yields. The trigger is a rejection below $73,650–$73,960, the M15 pivot and a four-contact resistance, followed by a 4H close below $72,690. The path targets $72,470 (long pocket), $71,240 (daily S2), then $70,970, the double-top objective, and in extension $67,090 (daily support with two contacts). Execution zone: sell into rallies between $73,700 and $73,960. Invalidation: a 4H close above $74,850, more than one 4H ATR (about $895) above a $73,800 entry, for an R:R of roughly 2.7 toward $70,970.
Scenario B — Liquidity Sweep Followed by a Technical Rebound (probability 30%)
This scenario assumes the estimated longs are swept before a reversal, triggered by a softer PPI or weaker retail sales. The trigger is a wick into $72,060–$72,650 followed by a recovery above $73,260, supported by the 4H bullish divergence and the daily SMA200. The path leads to $73,960, then $74,810–$75,000, with $76,270 in extension. Execution zone: buy between $72,300 and $72,650 after confirmation on the 15-minute chart. Invalidation: a 4H close below $71,150, that is below the daily S2 at $71,235; the $1,250 stop, wider than the 4H ATR, gives an R:R of roughly 1.9 toward $74,810.
Scenario C — Invalidation of the Bearish Bias (probability 15%)
This scenario requires a milder inflation picture or easing yields. The trigger is a 4H close above $74,810, then a daily close above $76,270, the double-top neckline. The path would aim at $77,770 (daily SMA20), then $79,020 and $80,230 (daily SuperTrend). Execution zone: buy on dips between $74,800 and $75,000. Invalidation: a daily close back below $73,140.
Synthesis and Conclusion
The current phase is a selling impulse after distribution, with price testing the daily SMA200. All three timeframes point lower: the daily confirms the double top, the 4H chains lower highs and lows, and the 15-minute chart compresses below $73,955. Hot inflation, 5% yields and expectations of further rate hikes support this bias, while the structural news does not invalidate it in the short term. With no ETF flow or on-chain data, demand cannot be confirmed, and a daily RSI near oversold leaves room for a relief rebound.
The dominant technical strategy is to sell rallies toward $73,700–$73,960 as long as price stays below $74,810 on the 4H chart, rather than chasing the decline into estimated liquidation pockets. The protection level is a 4H close above $74,850. A reclaim of the $76,270 neckline would, by contrast, invalidate the bearish bias as a whole.
Sources
- Bitcoin slides below $74,000 after hotter-than-expected CPI as analysts warn of drop to $70k — The Block, 10/11/2026
- United States Core Consumer Price Index (CPI) MoM — investing.com, date not specified
- How the Stock Market Has Performed After Veterans Day Over the Past Decade — MarketWatch, 10/11/2026
- GE Vernova sellers have it all wrong — plus, why Fed rate hike odds are soaring — CNBC, 10/11/2026
- White House vows to press ahead with tariffs despite midterm backlash over rising prices — CNBC, 10/11/2026
- Bitmine reports $6.3 billion net loss in latest fiscal year, driven by 44% ether decline — The Block, 11/11/2026
- Forward Industries grows SOL treasury to 8.7 million as token hits nearly three-month low — The Block, 10/11/2026
- Trump Media Posts $410 Million Profit. Bitcoin Gains Did the Heavy Lifting — Decrypt, 10/11/2026
- Canaan (CAN) Swings to an $8 Million Profit on Bitcoin Gains as Rig Sales Collapse 96% — Bitcoin Magazine, 10/11/2026
- LNbits Issues Emergency Patch After Reported BTC Thefts — Cointelegraph, 11/11/2026
- Mercado Bitcoin to resume cash withdrawals after $49M hack — Cointelegraph, 10/11/2026
- Project Faro Raises $270M for Bank-Backed Stablecoin Launch — Cointelegraph, 10/11/2026
- Crypto Ally Tom Emmer Elected No. 2 House Republican After Midterms — Cointelegraph, 11/11/2026
- SEC proposes crypto asset custody framework for investment advisers and regulated funds — A&O Shearman, 15/10/2026
- Economic and crypto calendar (Zurich time), provided calendar — URL not provided
Disclaimer: This article is for educational and informational purposes only. It does not constitute investment advice, a recommendation to buy or sell, or an invitation to trade any financial asset. Cryptocurrency markets are extremely volatile; any investment decision should be based on your own research (DYOR) and, where appropriate, the advice of a licensed financial adviser.

