


Bitcoin has just shattered the $76,000 mark after an explosive week driven by a historic short squeeze, an unprecedented regulatory alignment between Washington and Bern, and a deep repricing of risk across sovereign bond markets. Here is a full breakdown of the macro, technical, and micro-structural dynamics at play.
A macroeconomic paradigm shift
The digital asset market is going through a structural transformation rarely seen before, in this August 2026. Bitcoin’s (BTC) break above the $69,000 threshold, followed by a swift extension beyond $77,000, is far from a mere speculative blip. The asset has gained close to 30% from its recent lows around $60,000, driven by a fundamental repricing of its valuation against a particularly tense global backdrop.
The initial catalyst for this regime shift was US Treasury Secretary Scott Bessent’s surprise announcement of a substantial increase in long-term bond buybacks. Perceived by institutional investors as a disguised liquidity injection meant to stabilize a bond market under extreme strain — against a backdrop of US national debt approaching $40 trillion — the move reignited what macro strategists call “debasement trades.” Facing continued erosion of the dollar’s purchasing power, capital is rotating massively toward alternative stores of value: gold broke above $4,612 per troy ounce (+13% for the month), while the greenback shed roughly 0.8% against a basket of international currencies, providing a mechanical tailwind for the entire crypto complex.
The upcoming release of US inflation (CPI) data, against a backdrop of rebounding oil prices, remains the most closely watched variable: a softer-than-expected reading would support risk assets, while a hotter print would increase pressure on bond yields — and by extension on liquidity allocated to cryptocurrencies.
A historic regulatory alignment, from the White House to FINMA
This macroeconomic backdrop is matched by a regulatory alignment on both sides of the Atlantic, signaling Bitcoin’s definitive move from the periphery to the core of the global financial system. In the US, President Donald Trump’s direct engagement with crypto industry leaders at a White House summit acted as a powerful political legitimization signal. Momentum behind the Crypto CLARITY Act — landmark legislation aimed at structuring the digital asset market, currently delayed in the Senate — confirms a bipartisan willingness to formally integrate these assets into Wall Street’s traditional financial architecture.
In Switzerland, FINMA has reinforced the country’s position as a pioneering jurisdiction by publishing, in January 2026, its Guidance 01/2026 on the custody of crypto-based assets, setting strict “key-governance” requirements for banks, securities firms and portfolio managers. The guidance ensures per-client asset segregation and grants crypto-assets bankruptcy-remote status under Swiss law — eliminating the catastrophic counterparty risk seen in past collapses of centralized platforms. Combined with strict enforcement of the Travel Rule and the opening of a federal consultation to create two new licensing categories for stablecoins and DeFi infrastructure, this clarity strengthens Switzerland’s appeal for international institutional capital.
Anatomy of a historic short squeeze
The sudden regulatory legitimization, combined with excessively bearish market positioning, created an extreme asymmetry across derivatives markets. The initial upward move triggered a chain reaction for short sellers, wiping out between $2.7 and $2.98 billion in short positions across the crypto market — the largest liquidation event since the 2021 highs. More than 171,320 traders were liquidated during this window of extreme volatility, with a peak of over $1 billion in BTC shorts liquidated in roughly one hour.
This “short squeeze” mechanism fundamentally alters the architecture of price discovery: each liquidation forces a market buy order that consumes available sell-side liquidity and pushes the price higher, in turn triggering adjacent liquidation levels. This cascading process propelled BTC/USD from $64,920 to an intraday high of $72,496, before extending toward $77,000. Implied volatility briefly spiked above 40 before receding to 37.5.
While this rally was initially fueled by non-organic flows, its durability depends on fresh capital arriving. Good news for the bulls: US spot ETFs, after combined outflows of $385.2 million in mid-August, recorded net inflows of nearly $1.45 billion over four consecutive sessions — categorically reversing the distribution trend and tightening available supply. The positive spillover spread across the market, adding close to $190 billion in market cap in 24 hours and pushing Ethereum, Solana and XRP up between 18% and over 37% for the week.
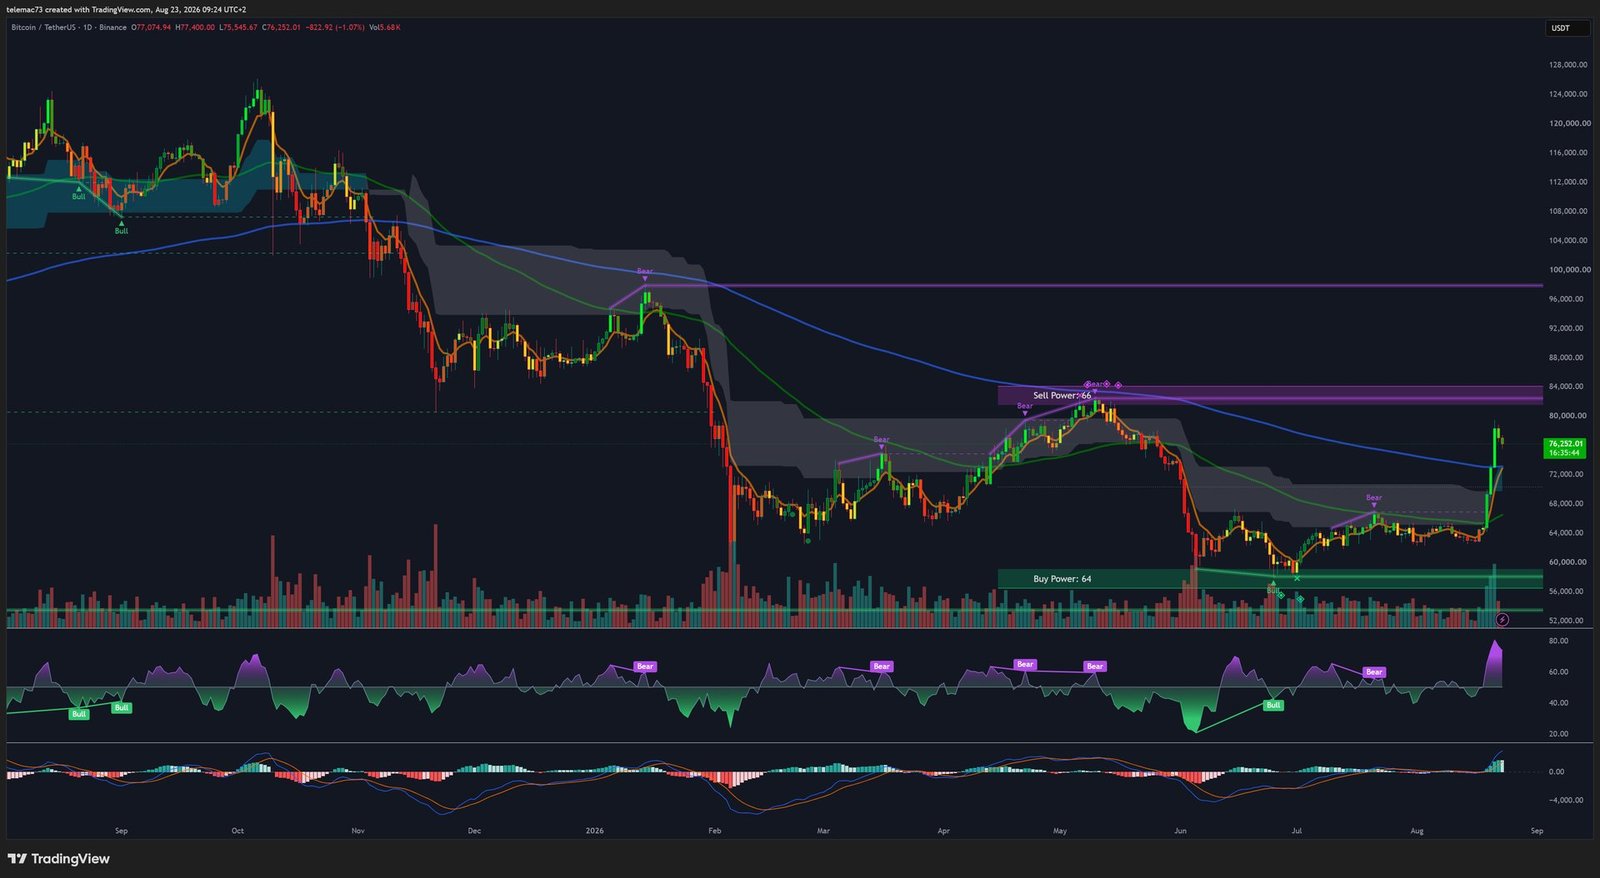
Daily chart: structural breakout, Golden Cross on the horizon
The daily timeframe reveals a radical topological shift: the market has moved from a prolonged sideways distribution regime — marked by descending highs and repeated tests of the $53,000–$56,000 support zone — into an aggressive directional expansion phase. That zone had served as the base for a quiet phase of institutional accumulation, consistent with Wyckoff-style dynamics.
The key inflection point was the break of intermediate resistance around $64,000, followed by the shattering of local highs at $70,000 and $74,000. Short and medium-term moving averages, which had previously acted as dynamic resistance, have now curled upward and are beginning a sequential bullish alignment, signaling an imminent “Golden Cross” (the 50-day moving average crossing above the 200-day). The ADX reading of 34.8 quantitatively confirms the presence of a strong, directional trend.
The daily MACD crossed its signal line to the upside while still in negative territory — a rarely-seen and remarkably clean signal of directional strength. The one caveat: the daily RSI broke above 70 to reach 78.3, a deep overbought zone. Crypto market cycle history shows the RSI can remain pinned in extreme overbought territory for weeks during periods of institutional liquidity shock — the real threat isn’t the level itself, but the potential emergence, not yet confirmed, of a classic bearish divergence.
4-hour chart: the institutional elastic band under tension
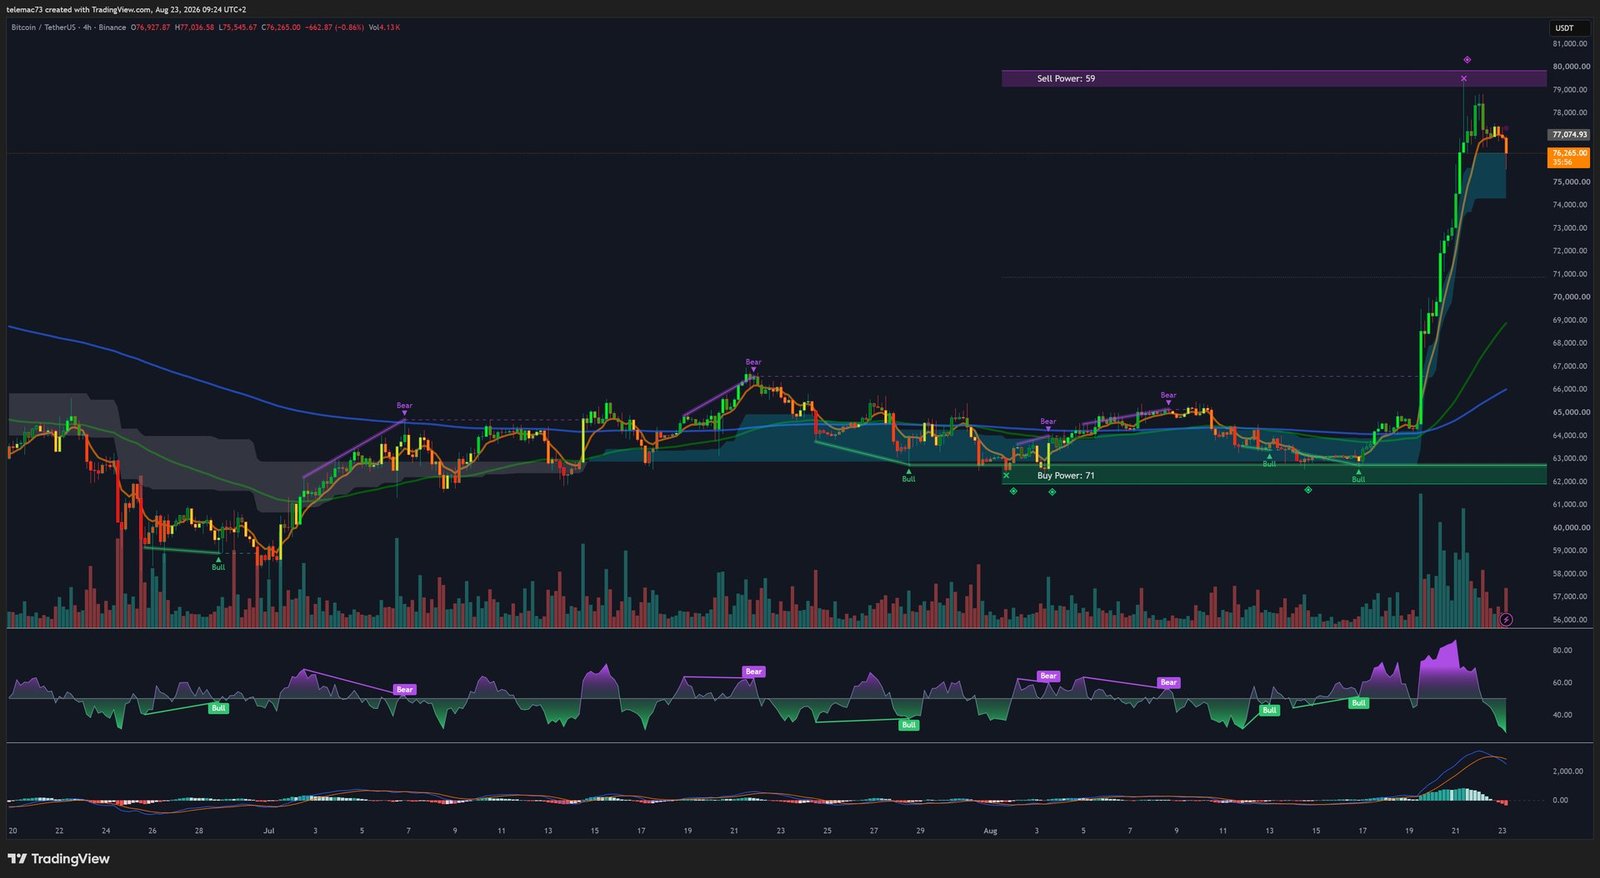
On the 4-hour timeframe, the rally shows the classic traits of a parabolic extension driven by buyer panic (FOMO). Price sliced through former resistance zones with striking ease, reflecting an almost total absence of seller defense at those intermediate levels.
This velocity created a significant dislocation between price — now trading above $76,000 — and its reference moving averages. Like an elastic band, the faster and further price stretches away, the stronger the pull back toward the mean. For the trend to remain structurally healthy, this tension must resolve, either through a price correction (a pullback to retest the moving average) or a time correction (sideways consolidation allowing the average to catch up).
At the top of this impulse, price action is carving out the early stages of a bull flag: a tight consolidation following a vertical directional pole. Should this compression resolve with a volume-confirmed breakout, the theoretical target would project Bitcoin well beyond the $80,000 psychological barrier. The 4h MACD, however, is beginning to show subtle rounding at its histogram peaks — a fading of momentum that calls for tactical caution. The critical pivot level sits between $71,500 and $72,496; a sustained 4h close below this zone would break the continuation structure and expose the asset to a cascade of algorithmic profit-taking toward $64,000–$65,000.
15-minute chart: volatility compression and order flow
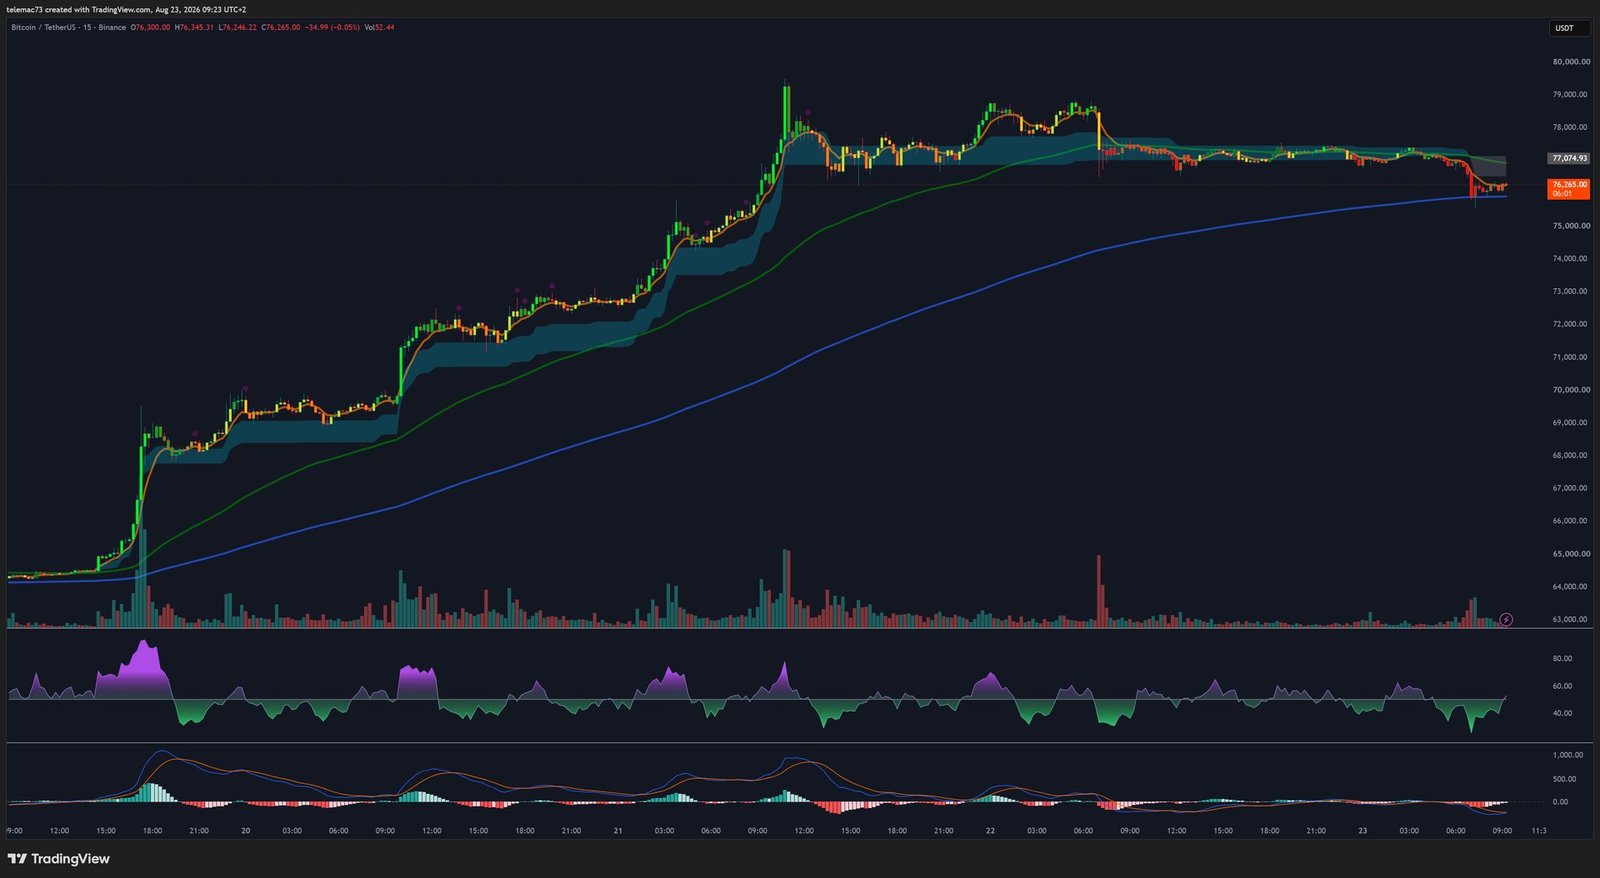
Zooming into the 15-minute chart is essential to grasp intraday tactical positioning and high-frequency algorithmic behavior. After reaching local highs near $77,000, the market entered a distribution regime contained within an extremely tight range, hovering around the equilibrium point of $76,265.
The very short-term EMA is acting as dynamic support with surgical precision — typical of institutional VWAP/TWAP execution algorithms refusing to let the market pull back significantly. Price is tracing a symmetrical compression triangle, a pattern that invariably precedes an explosive release of directional volatility. The 15-minute RSI, meanwhile, has almost fully normalized around the neutral 50 zone — a classic marker of a strong, healthy trend that has purged its excesses without price capitulation.
The MACD on this timeframe is far more conflicted, oscillating dangerously around the zero line and threatening to validate repeated intraday bearish crossovers. A clean rejection below the signal line, paired with an expansion in sell-side volume, would raise the odds of a downside break of the triangle, with a first technical floor at the psychological $74,000 level.
Mapping liquidity: what the order book heatmap reveals
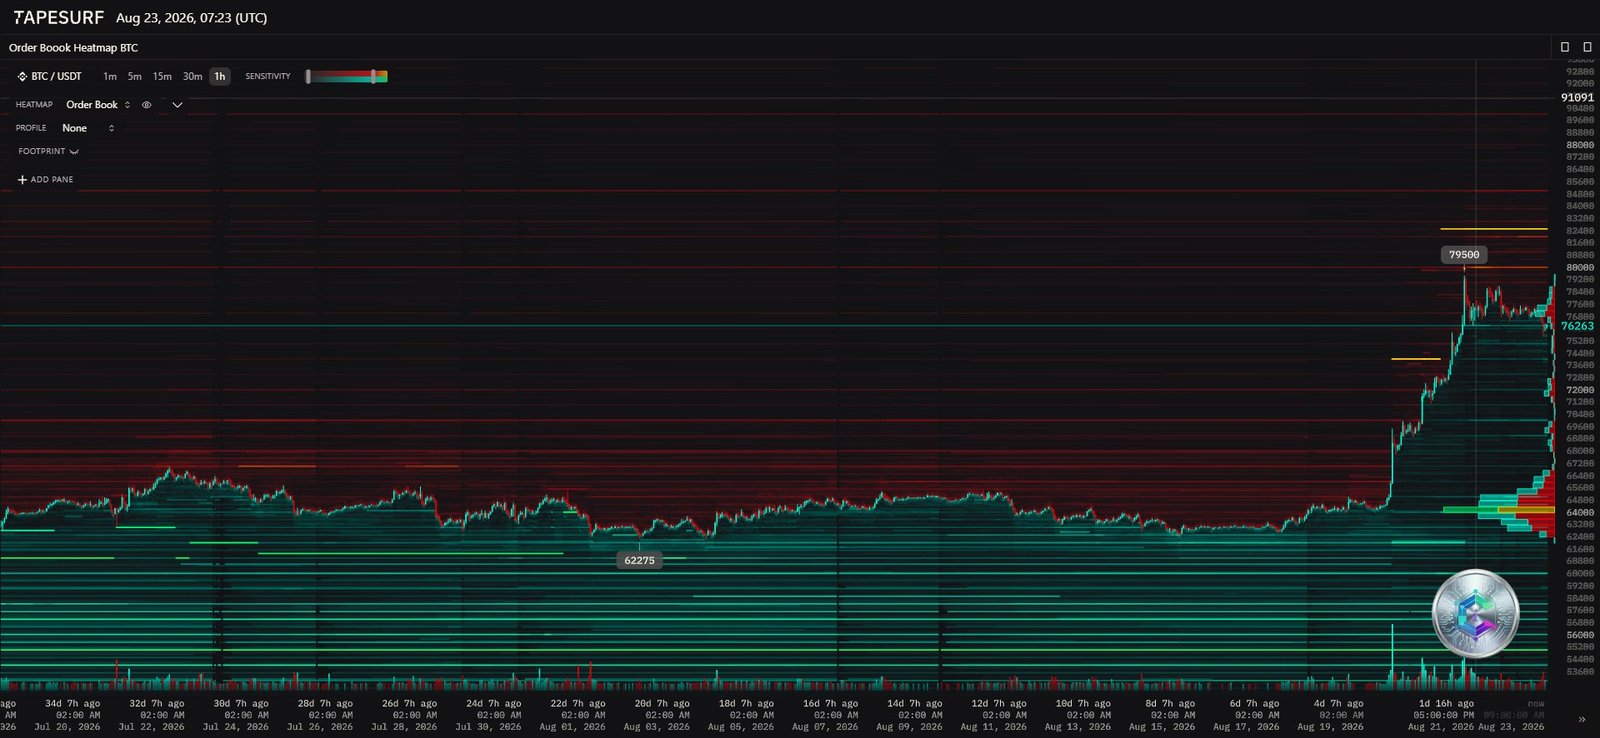
Unlike candlestick charts, which represent the history of past transactions, an order book heatmap reveals institutional players’ future execution intentions by mapping the density and location of resting limit orders. In the current environment, the order book’s topology highlights key friction zones that will shape the next phases of price movement.
| Category | Price level (USD) | Strategic interpretation |
|---|---|---|
| Institutional sell wall | 79,500 – 80,000 | Massive red band. Would require an extraordinarily aggressive ETF-driven demand surge to be absorbed; an initial rejection is highly likely. |
| Intermediate resistance | 77,400 – 77,900 | Upper boundary of the 15m compression triangle. A break above would trigger momentum buying toward the $79,500 wall. |
| Pivot point | ~ 76,265 | The current battlefield; liquidity is consumed instantly, driving the stagnation visible on the 15-minute chart. |
| Breakout support | 71,500 – 72,496 | Invalidation zone for the immediate bullish bias; a liquidity void leaves the market vulnerable to a minor flash crash. |
| Major liquidity floor | 64,000 – 64,800 | Institutional buyers’ absolute defense zone, the origin point of the parabolic move. |
| Ultimate support | 62,275 | The last line of defense before a re-entry into the former bear market. |
The most striking asymmetry lies in the proximity of resistance versus the distance to support: the $79,500 sell wall points to genuine, sizable selling intent, though such walls can theoretically be subject to “spoofing” during euphoric periods. Conversely, the buy-side liquidity void between the current price and the $64,000–$64,800 floor is the direct scar tissue of the short squeeze: the order book has not had time to organically repopulate. Any correction triggered by panic selling could therefore prove brutal within this thin zone.
Two scenarios going forward
Bullish scenario: asymmetric continuation
Supported by massive capital flows and favorable geopolitical developments, this scenario argues that macroeconomic fundamentals significantly outweigh short-term technical over-extension signals. The compression patterns seen on the 15-minute and 4-hour charts would then simply be normal decompression chambers, purging RSI excess and facilitating the transfer of assets into long-term institutional portfolios. Validation of this scenario would come through a bullish breakout of the compression triangle, with gradual absorption of the $79,500 liquidity wall opening the door to a price discovery phase toward $85,000.
Correction scenario: mean reversion by exhaustion
Conversely, the cautious view highlights the fragile genesis of the recent impulse: a move driven by $2.7 billion in forced liquidations is inherently unsustainable without an immediate, equivalent influx of organic demand. Overbought conditions on higher timeframes, the early rounding of the 4h MACD, and the sizable liquidity void below $72,000 create a market structure vulnerable to downside shocks. A failure to sustain bullish momentum within the 15-minute compression — potentially triggered by a hotter-than-expected US CPI print — could push price toward the $71,500 pivot and, absent ETF demand defending that level, down to the structural floor at $64,000–$64,800. Such a correction, while dramatic in percentage terms, would qualify as a healthy technical retracement.
Bitcoin now sits at the exact confluence of historic macroeconomic legitimization and extreme micro-structural tension. How the ongoing tug-of-war within the intraday compression layers resolves will determine the nature of the next phase of the cycle: a euphoric acceleration toward new highs, or a sharper rationalization back toward the trend’s technical fundamentals.
Disclaimer: This article is provided for informational and educational purposes only. It does not constitute investment advice, a recommendation to buy or sell, or a solicitation to trade digital assets. Cryptocurrency markets are highly volatile and involve a risk of capital loss. Always do your own research (DYOR) and, if needed, consult a licensed financial advisor before making any investment decision.

