


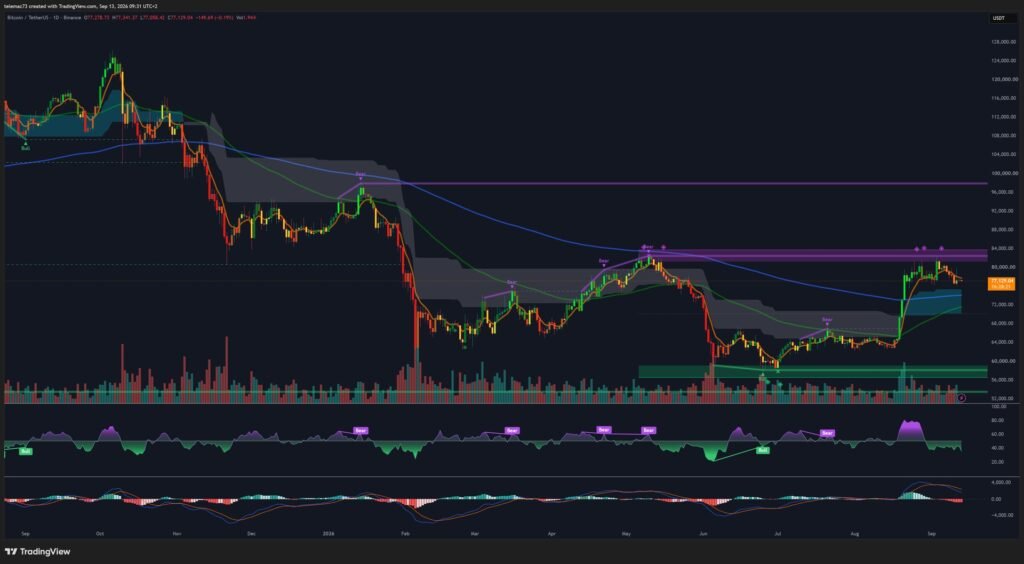
Bitcoin is trading around $77,129 on September 13, 2026, locked in a tight sideways compression after being rejected from its local high of $82,300. This pause follows a +42% rally from the cyclical low of $57,800, which ran with remarkable precision into the descending 365-day moving average at $81,700. A clean daily close above that level remains the necessary condition to confirm entry into a new, durable bull market phase.
On-chain, this threshold coincides with a historical supply band between $77,100 and $80,200, where long-term holders have distributed more than 539,000 BTC over the past quarter. Tactically, price action is organized as a bull flag on the 4-hour timeframe, echoed intraday by a compressing symmetrical triangle on the 15-minute chart. The order book shows vigorous passive absorption of long liquidations, reinforcing a demand floor between $75,500 and $76,000, while spot ETF flows remain broadly positive (+$987 million over the past week).
The FOMC meeting: this week’s central catalyst
The resolution of this compression largely hinges on the Federal Reserve’s Federal Open Market Committee meeting scheduled for September 16, 2026. With core inflation still anchored at 3.4%, 10-year Treasury yields testing 4.975%, and Brent crude holding above $98, money markets are pricing a 60–80% probability of a 25 basis point rate hike under Fed Chair Kevin Warsh. In this volatility-asymmetric environment, the probabilistic bias tilts toward a medium-term bullish extraction, provided the $75,000 floor holds.
Multi-timeframe read: from the daily chart to intraday
Daily chart: rejection at the 365-day moving average
The daily timeframe confirms a regime shift that began at the capitulation low of $57,800. The subsequent bullish leg drove price into direct contact with the resistance block between $81,500 and $82,800, topping at $82,300. That zone houses the 365-day simple moving average ($81,700), identified by CryptoQuant analysts as the pivot separating structural purge phases from durable expansion cycles. The failure to break through this level triggered notable profit-taking, without calling the primary uptrend into question: the price structure is building a higher floor above the old summer accumulation zone ($62,000–$65,000), with the 200-day moving average (~$70,000) acting as a structural safety net.
4-hour chart: consolidation flag
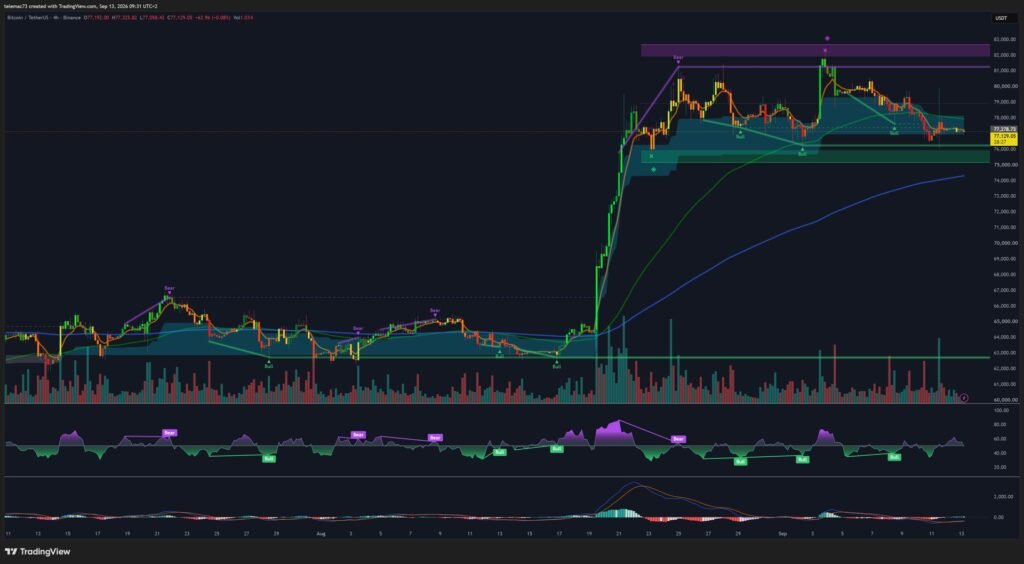
On the 4-hour timeframe, the pullback from $82,300 is unfolding as a series of lower highs ($80,500, $79,650, $78,400), forming a descending wedge or bullish continuation flag resting against the institutional demand zone between $75,500 and $76,300. Price currently trades below the fast 4H moving average ($77,600), which is acting as dynamic resistance, while the slow moving average ($75,300) doubles up the horizontal support. The progressively shrinking candle ranges point to a scarcity of aggressive sellers — a volatility-compression regime that typically precedes a directional release.
15-minute chart: symmetrical triangle at the apex
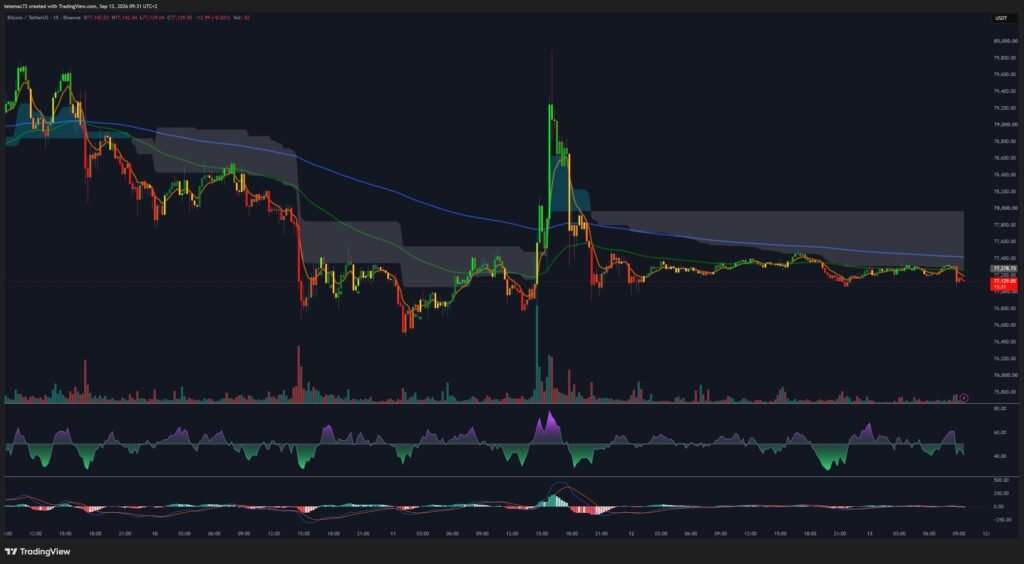
On the micro-timeframe, price action has locked into a remarkably geometric symmetrical triangle after absorbing the liquidity shock triggered by the latest US inflation print. The upper boundary connects $77,800, $77,450 and $77,250, capped by the 200-period moving average, which is stabilizing around $77,450–$77,500. The lower boundary connects $76,600, $76,850 and $77,050. The current price of $77,129 sits precisely at the apex of this pattern, illustrating near-complete statistical neutrality ahead of the monetary policy announcement.
Momentum: what RSI and MACD are saying
The oscillator picture supports the thesis of a rebalancing after overheating, purging speculative excess without damaging the underlying trend. On the daily, RSI has cooled to 56.2 from an overbought reading above 72, without dropping into bearish capitulation territory (below 40): holding above the 50 pivot preserves the odds of a fresh impulse. On the 4-hour chart, RSI is climbing gradually toward 44 from a low of 36, but needs to clear the midline to confirm buyers have regained the initiative. On the 15-minute chart, the oscillator remains pinned between 43 and 54, mirroring the prevailing directional deadlock.
The daily MACD still holds the bullish Golden Cross triggered at the $65,000 breakout, even as its histogram curls lower. On the 4-hour chart, a Death Cross remains technically active, but its negative histogram has stopped expanding — a sign of seller exhaustion. On the 15-minute chart, the MACD lines are flattened against the zero axis, a setup that historically precedes a sharp volatility expansion once one of the triangle’s boundaries breaks.
Order book and liquidity heatmap
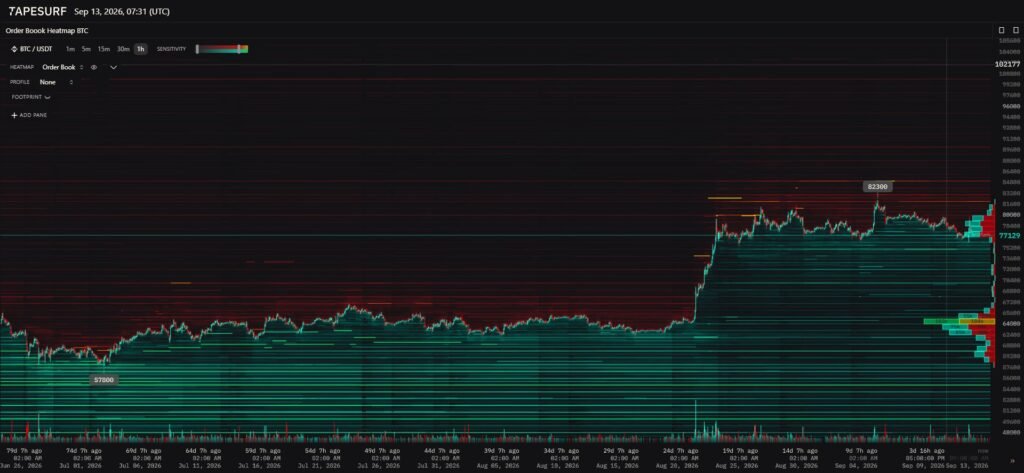
The Tapesurf liquidity heatmap for BTC/USDT reveals a clear stratification of supply and demand. On the sell side, the $80,000–$80,500 zone forms a first psychological barrier, followed by the major sell wall between $81,700 and $82,500, which coincides with the 365-day moving average and represents the breakeven level for many holders who entered at prior highs. Higher up, the $88,000–$90,000 zone acts as an exit-liquidity target for long-term positions.
On the buy side, the $76,000–$76,500 segment forms an active liquidity cushion, while the real institutional wall sits between $74,500 and $75,500, aligned with the slow 4H moving average — a zone capable of absorbing a large-scale long liquidation. A low-volume node between $70,500 and $75,000 signals that a confirmed break below $75,000 could produce a fast slide toward the 200-day moving average near $70,000.
ETF flows and on-chain data
Despite a demanding macro backdrop, institutional flows point to structural resilience that, for now, rules out a disorderly capitulation scenario. Spot Bitcoin ETFs posted net inflows of $987 million over the past week, with total assets under management now at $76 billion. The Fear & Greed Index is hovering between 69 and 73 (“Greed” territory), suggesting institutional players are reading the current phase as a strategic accumulation opportunity rather than the start of a reversal. On-chain, 71% of circulating supply remains in unrealized profit, a level historically associated with transitions into durable bull phases — though the $9.07 billion in unrealized profits held by short-term whales remains a mobile supply reserve worth watching in the event of a hawkish FOMC surprise.
Three scenarios out of the compression
- Scenario 1 — Bullish breakout and macro extension (≈45%): steady rates, or a 25bp hike paired with dovish language signaling the end of the cycle, would trigger aggressive buying through the $80,000 wall, targeting $80,000, then $83,600 and $88,700. Invalidation: reclaiming below $76,800.
- Scenario 2 — Liquidity sweep and absorption (≈35%): pre-FOMC volatility produces a downside wick below $76,800 into the $75,500–$76,000 zone, followed by a swift reclaim driven by institutional buy orders, targeting $77,500, $78,500, then $80,000. Invalidation: no reaction at $75,500.
- Scenario 3 — Hawkish surprise and macro capitulation (≈20%): a rate hike paired with a hawkish dot plot and oil above $105 would trigger a withdrawal of buy orders and a daily close below $75,000, opening the path toward the 200-day moving average ($70,000). Invalidation: reclaiming $76,500.
Key levels to watch
| Level (USD) | Type | Significance |
|---|---|---|
| $88,700 | Major resistance | Realized-price ceiling, cycle extension |
| $83,600 | Resistance | Intermediate post-breakout target |
| $81,700 – $82,300 | Pivot resistance | 365-day MA, major sell wall, bearish invalidation threshold |
| $79,650 – $80,200 | Resistance | Top of the 4H range, $80k psychological barrier |
| $77,129 | Central pivot | Current spot price, high-volume node |
| $75,500 – $76,000 | Tactical support | Accumulation zone, medium-term buyer defense |
| $74,500 – $75,000 | Pivot support | Slow 4H MA, institutional buy wall, absolute invalidation |
| $70,000 | Macro support | Daily 200-day MA, landing zone in a panic scenario |
| $62,000 – $65,000 | Fundamental support | Summer accumulation block |
The bottom line
Bitcoin is going through an orderly accumulation phase under an institutional ceiling, where the neutralization of intraday momentum is setting the stage for a volatility break around the FOMC decision on September 16, 2026. While the 365-day moving average ($81,700) remains the structural lock blocking expansion toward new highs, the bullish flag structure and the strength of the order book between $75,500 and $76,000 give a probabilistic edge to long positions. Sound risk management calls for waiting on confirmation of a breakout above $77,500, or methodical absorption at the green support zone, while treating $75,000 as the safety line beyond which a defensive hedge becomes essential.
Disclaimer: this article is provided for strictly educational and informational purposes. It does not constitute investment advice, a recommendation to buy or sell, or a solicitation to trade any financial asset. Cryptocurrency markets are highly volatile, and any financial decision should be based on your own research and, where appropriate, the advice of a licensed financial advisor.

