


As of November 3, 2026, Bitcoin trades at $76,800, 12% below its period high of $87,385 set on September 21. The last notable low, $76,270 on October 30, followed the October 29 flush toward $77,870, which coincided with the Binance hack. The current phase is a distribution slowly turning into a rout: much of the bearish pattern has already played out, and the $75,200–$76,300 zone will show whether the market sweeps liquidity (liquidity sweep) before rebounding or keeps distributing.
The dominant driver remains the Binance hack, estimated at $6.3B by CryptoPotato (November 3). The FBI attributes the attack to North Korea’s “TraderTraitor” group, while Binance says it has rebuilt 95% of its assets and will absorb the losses. Its latest proof of reserves, published November 2, shows a 1:1 ratio, according to The Block. Withdrawals resumed in phases on November 1. Cointelegraph (November 2) reports net Binance outflows above $7B, with $445M of net inflows going to OKX. Confidence is also strained: Mercado Bitcoin suffered a breach of about $46M and suspended withdrawals (The Block, November 2), a $106M theft targets a European entity (Decrypt, November 2), and South Korea is pushing exchanges to expand cold storage (Cointelegraph, November 3).
The macro backdrop remains restrictive. The Fed held rates last week in a tone widely read as “hawkish,” while the Reserve Bank of Australia raised its cash rate by 25 basis points to 4.85%, an 18-year high, with September inflation at 4.3% (CNBC and Cointelegraph, November 3). The ISM manufacturing index came in at 55.5 against 54.6 expected, a bullish surprise on activity, and price slipped below $77,000 after the Wall Street open (Cointelegraph, November 2). China’s NBS manufacturing PMI, at 49.3 versus 50 expected, points the other way. The BoJ kept its rate at 1.25%, in line with consensus. Institutional demand is present but marginal: Strive bought 124 BTC at an average $80,526, bringing its total to 43,124 BTC (Decrypt, November 2). ETF flow and on-chain data are unavailable in the sources reviewed. On regulation, the SEC proposed a crypto custody framework on October 1, with comments open until December 7 (Federal Register, October 6).
For the technical read that follows, this backdrop supports the bearish signal without invalidating it: exchange outflows and restrictive policy weigh, while treasury buying remains too small to reverse the trend.
Multi-Timeframe Technical Analysis
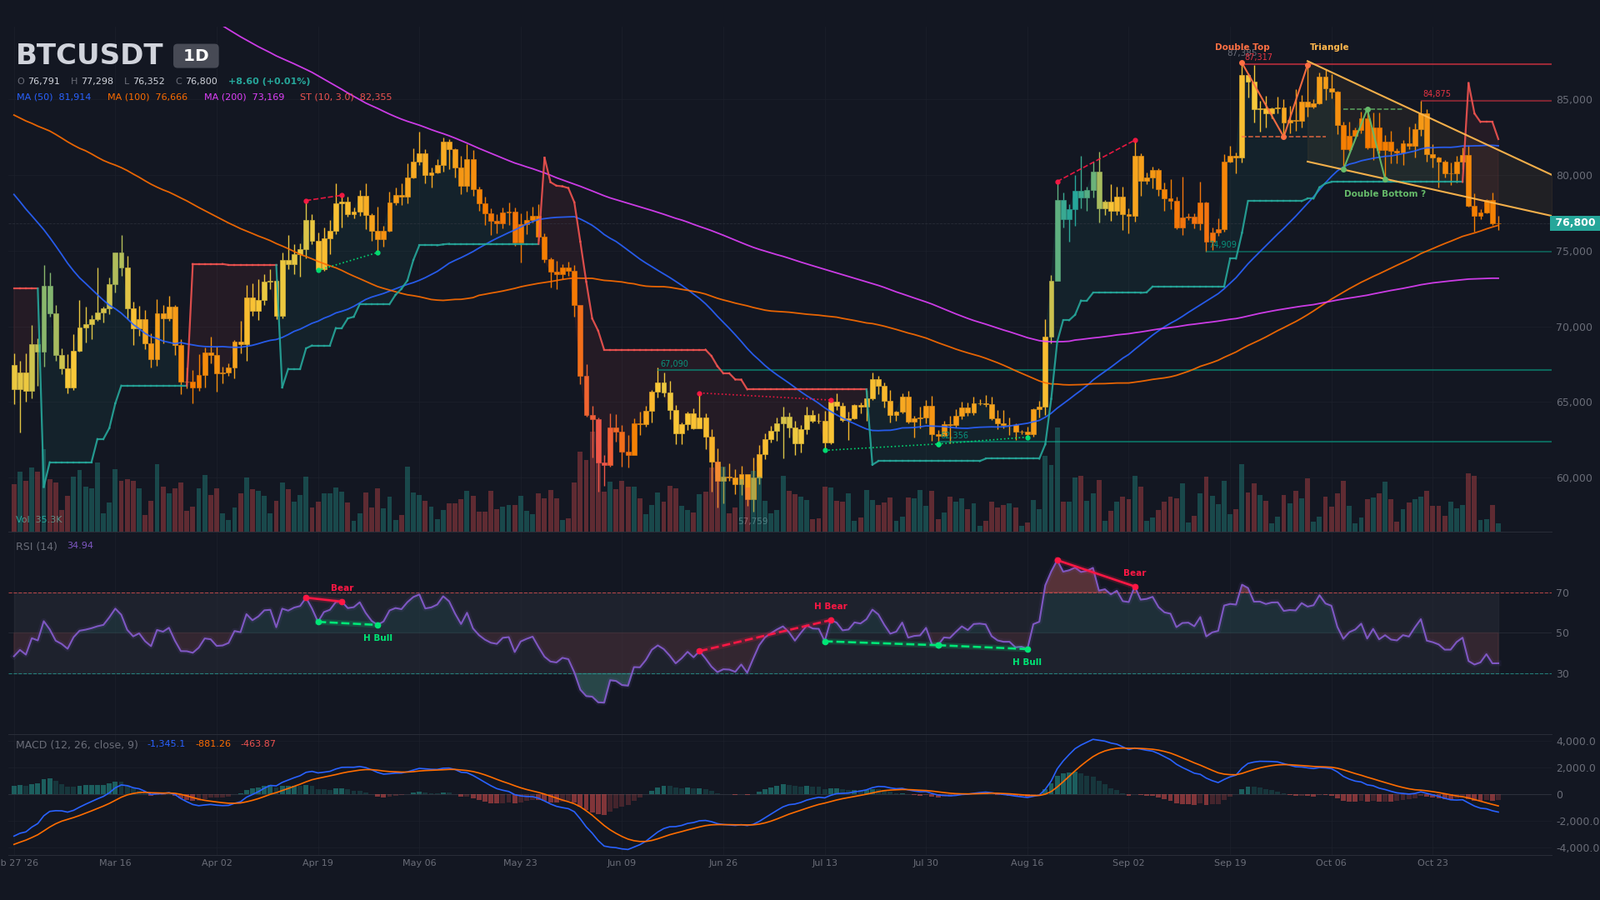
Daily Timeframe (1D): Double Top Confirmed, Wedge Broken to the Downside
The daily trend has been bearish since the September 21 peak. Lower highs ($87,250 on October 2, $84,880 on October 21, $81,950 on October 29) are matched by lower lows ($82,500, $79,180, $76,270). Price trades below the 20-period simple moving average (SMA20, near $80,340) and the SMA50 (near $81,910), but holds above the SMA200 (near $73,170) after hugging the SMA100 (near $76,670). No 50/200 cross has printed, and the daily SuperTrend, at $82,350, remains bearish.
The dominant pattern is a confirmed double top, with a neckline at $82,500 and a target at $77,680, now nearly reached. The wedge opened on October 2, bounded between $78,510 and $82,550 with an apex estimated for December 10, has broken to the downside. A bullish double bottom, with a neckline at $84,340 and a target at $88,640, remains an unconfirmed and distant hypothesis. A regular bearish divergence from August 21 to September 3, when the relative strength index (RSI) fell from 86 to 73 while prices rose, had already flagged the distribution.
The RSI sits near ~35, close to oversold without reaching it. The moving average convergence divergence (MACD) has remained below its signal line and below zero, with a negative histogram, since the September 29 bearish crossover, now 35 candles old. Volume on the current candle is only 27% of its 20-period average and carries little weight. By contrast, the October 29 session, with roughly 254,000 BTC traded, doubled the average, the signature of a forced liquidation.
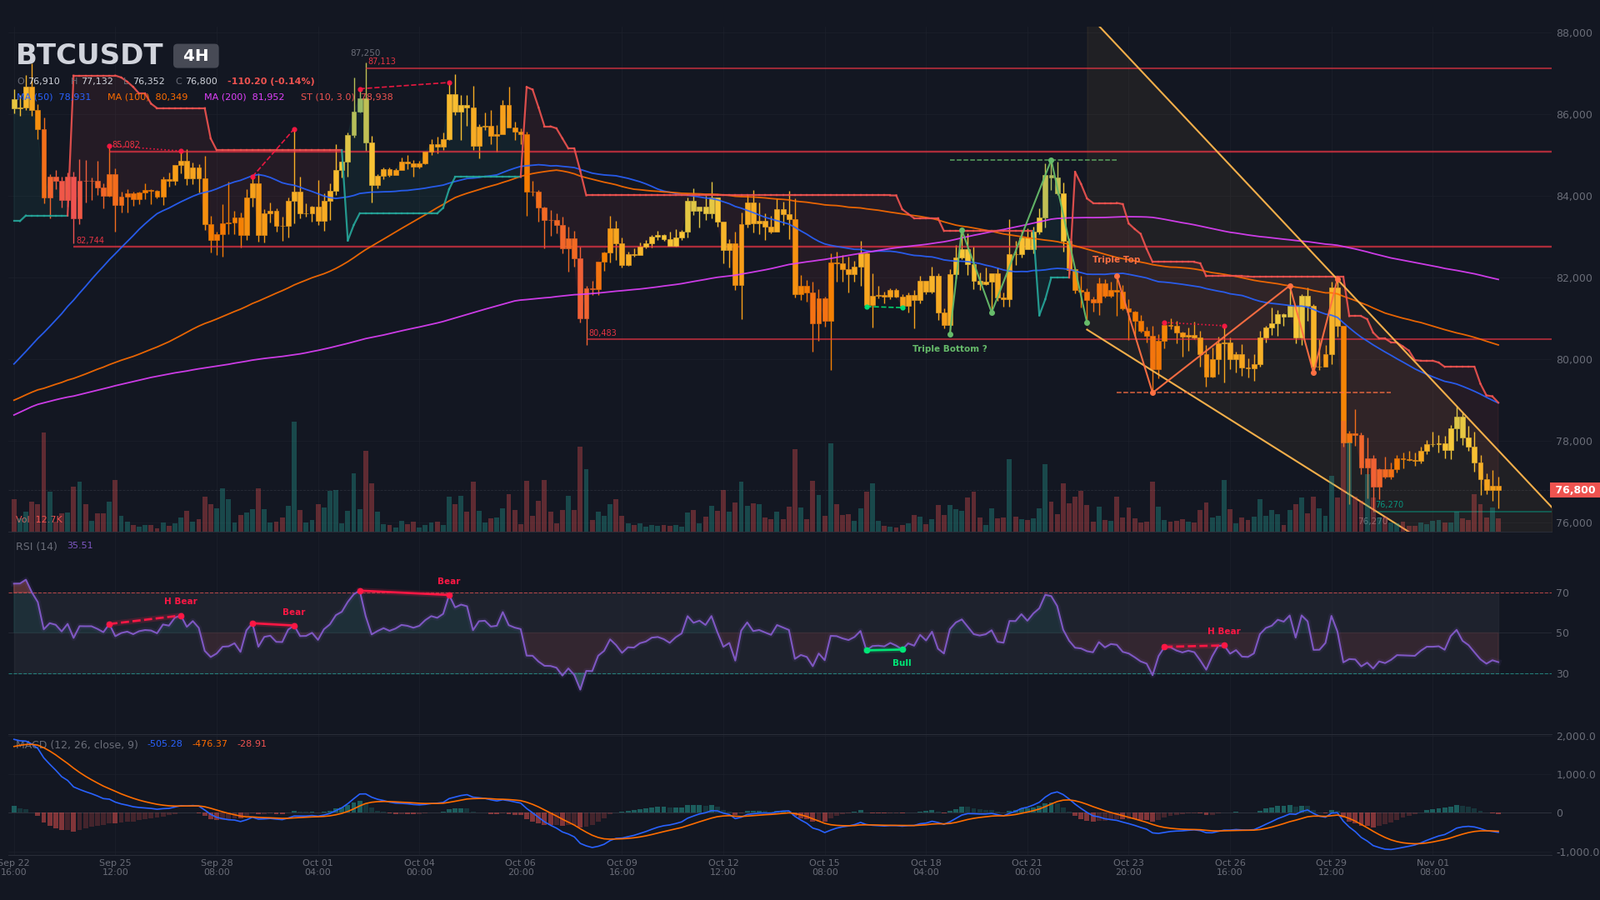
Intermediate Dynamics (4H): Triple Top Confirmed Under a Compression Wedge
The H4 structure still consists of lower highs and lower lows, and the pattern is further along. The triple top is confirmed, with a neckline at $79,180 and a target at $76,430, nearly reached with the $76,270 low. The wedge opened on October 22 is bounded by $78,850 above and $75,040 below, with an apex estimated for November 12, so resolution is close. Price sits below the SMA20 (near $77,590), SMA50 (near $78,930) and SMA200 (near $81,950), and the H4 SuperTrend, at $78,940, is bearish. A hidden bearish divergence on October 24 and 26 had confirmed the continuation. Resistances tested sit at $80,480, $82,740 and $85,080.
The RSI is at 36, and the MACD crossed lower on November 3 at 00:00, with the histogram still slightly negative. Volume is normal at 99% of its average. The H4 average true range (ATR), near $750, sets the minimum stop distance. Mechanically, a pattern whose target has been reached invites either a technical rebound or a move to a new floor near $75,000.
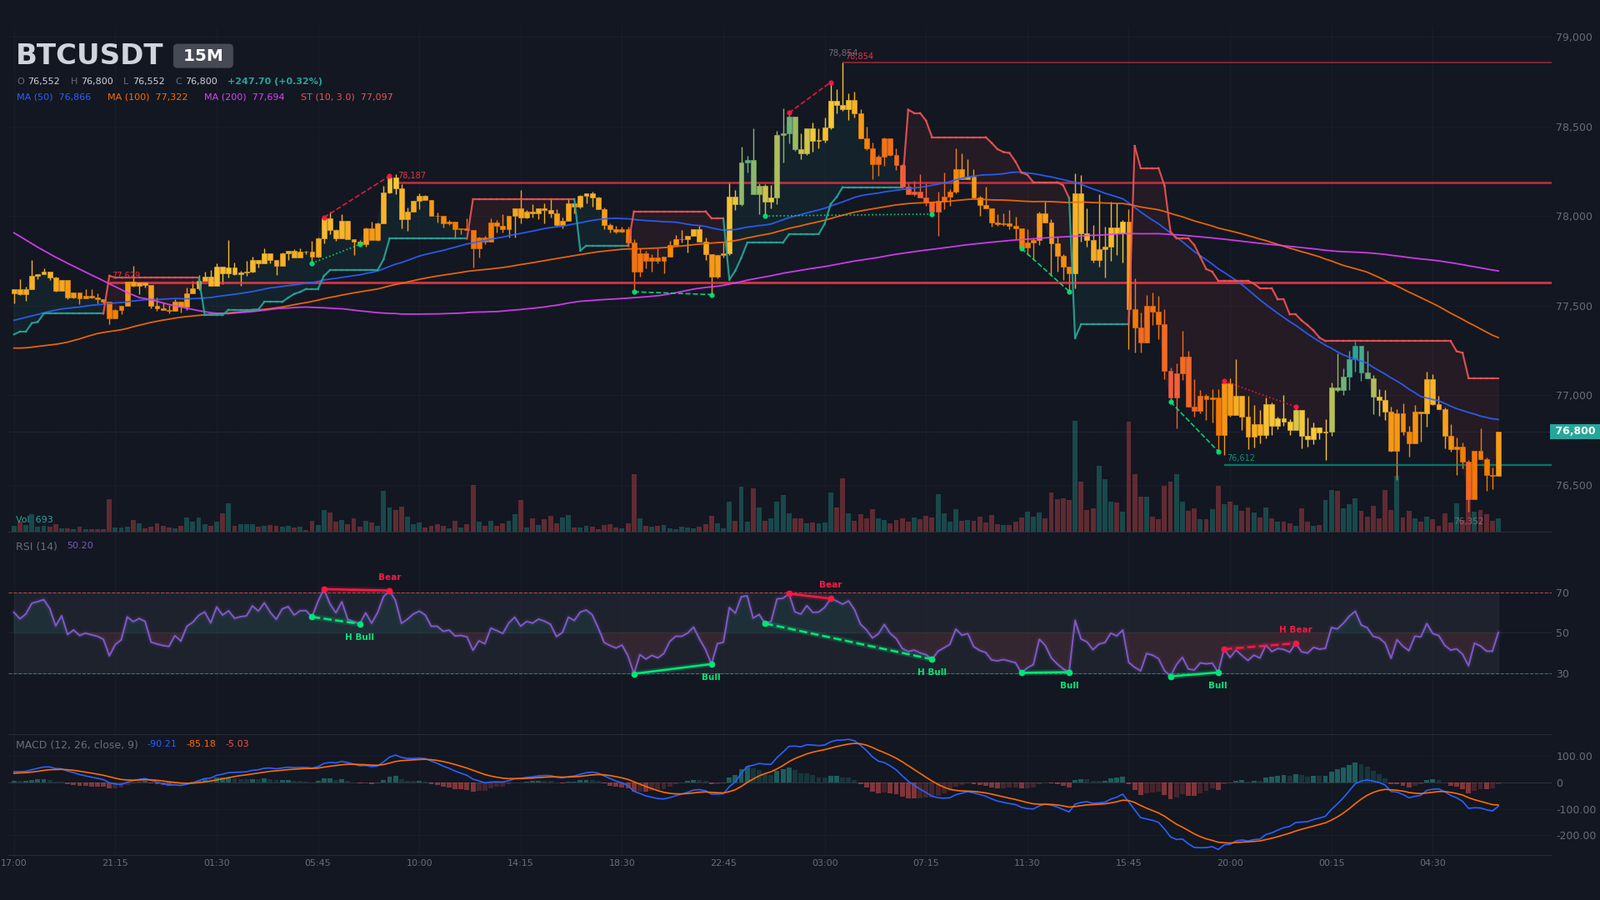
Intraday Structure (15m): Compression Range Between $76,350 and $77,300
On the 15-minute chart, no formal pattern is detected, but price trades inside a range bounded by the November 3 low at 06:00 ($76,352) and the November 3 high at 01:15 ($77,298). Support at $76,610, tested three times, was briefly broken and then reclaimed. Resistances sit at $77,630 (eight touches), $78,190 and $78,850. The M15 SuperTrend is bearish at $77,100, and price oscillates between the SMA20 (near $76,760) and the SMA50 (near $76,870).
The RSI is neutral at ~50, and the MACD has crossed lower since November 3 at 05:00, with momentum fading. A regular bullish divergence on November 2, between 17:30 and 19:30, supported the rebound. Volume is at 65% of its average. An M15 close below $76,350 would open a bearish extension, while a close above $77,630 would point to a rebound toward $78,200. The M15 ATR, near $200, demands wide stops.
Multi-Timeframe Summary
| Timeframe | Dominant Trend | RSI (14) | MACD | Chart Pattern |
|---|---|---|---|---|
| Daily (1D) | Bearish (distribution) | ~35 | Below signal and zero line, bearish crossover on September 29 | Double top confirmed, wedge broken |
| 4 hours (4H) | Bearish | ~36 | Bearish crossover on November 3 | Triple top confirmed, compression wedge |
| 15 minutes (15m) | Neutral (range) | ~50 | Bearish crossover on November 3, losing momentum | Compression range |
Key Levels and Pivot Map
The map combines daily and H4 classic pivots, swing points, detected supports and resistances, order-book walls and estimated liquidation pockets. No Fibonacci extension is retained, as the swings lack a clean reference impulse. The short-term central pivot sits between $77,000 and $77,450: as long as price stays below this zone, selling pressure dominates.
| Level | Price (USD) | Category | Technical Basis |
|---|---|---|---|
| Major Resistance 3 (R3) | $82,350 – $83,130 | Structural | Daily SuperTrend at $82,355, double-top neckline at $82,500, H4 resistance at $82,744, estimated short pocket $82,878–$83,132 |
| Major Resistance 2 (R2) | $78,200 – $79,200 | Major | M15 resistance at $78,187 and $78,853, upper bound of the H4 wedge, H4 SuperTrend at $78,938, triple-top neckline at $79,180 |
| Immediate Resistance (R1) | $77,100 – $77,650 | Intraday | M15 SuperTrend at $77,097, M15 resistance at $77,629 (8 touches), H4 SMA20 |
| Central Pivot (P) | $76,900 – $77,450 | Pivot | Daily pivot at $77,438, H4 pivot at $76,912 |
| Immediate Support (S1) | $76,270 – $76,610 | Intraday / H4 | H4 low of October 30 ($76,270), M15 support at $76,612, triple-top target $76,430, buy wall at $76,336 |
| Major Support 2 (S2) | $74,900 – $75,450 | Major | Daily support at $74,909, estimated long pocket $75,196–$75,449, lower bound of the H4 wedge at $75,043 |
| Major Support 3 (S3) | $73,500 – $74,440 | Structural | Estimated long pockets $74,098–$74,436 and $73,507–$73,930, daily SMA200 at $73,170 just below |
Order Book and Liquidity Heatmap
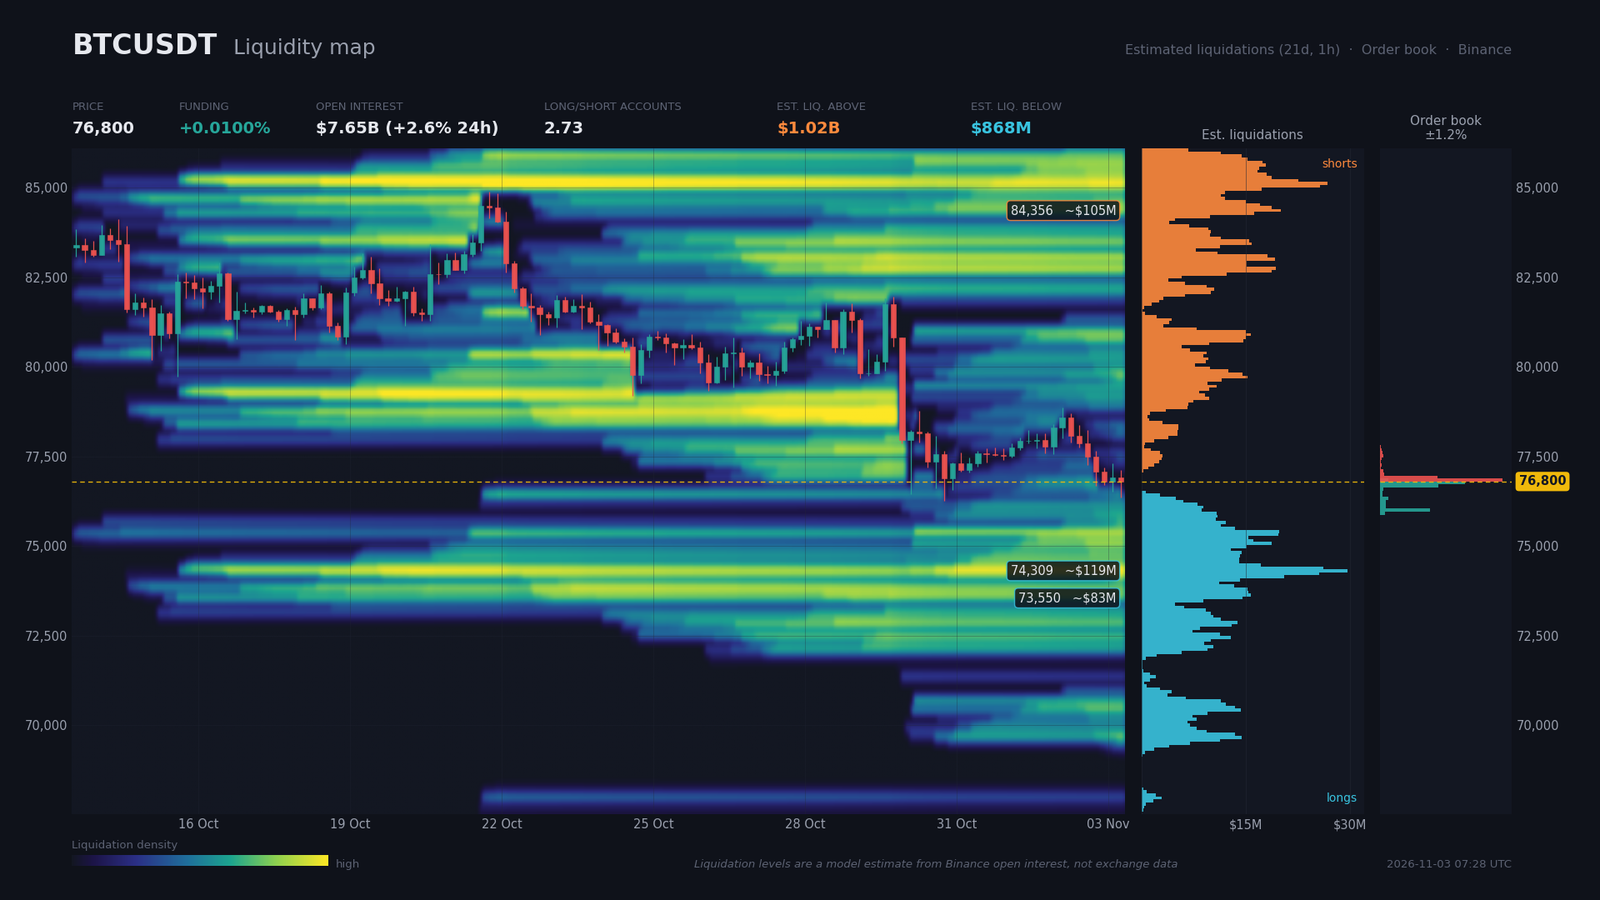
The order book covers only 1.19% around price, so only nearby liquidity is visible. Sell walls sit at $76,842 ($42.9M, 0.05% above the market) and $76,927 ($20.1M). On the bid side, walls stand at $76,758 ($29.8M), $76,673 ($20.5M) and $75,998 ($17.6M, 1.04% below). Within 2%, bids total $83.2M against $69.1M of asks, a 9.3% imbalance in favor of buyers. Mechanically, this signals a short-term floor, but these walls can be pulled at any time.
Estimated liquidation zones (a model, not a measured figure) are heavier above price, at about $1.02B cumulated, than below, at about $868M. Shorts cluster at $82,880–$83,130 (≈ $61M), $84,140–$84,650 (≈ $105M) and $84,990–$85,240 (≈ $93M). Longs cluster below, at $75,200–$75,450 (≈ $66M, 1.8% from price), $74,100–$74,440 (≈ $119M) and $73,510–$73,930 (≈ $83M). The nearest pocket acts as a magnet, which makes a sweep toward $75,200–$75,450 plausible.
Funding is neutral to slightly positive at 0.01% (≈ 10.9% annualized). Open interest reaches $7.65B, up 2.6% over 24 hours but down 1.3% over seven days, which suggests new positions are opening into a slow decline. Long/short ratios remain buyer-dominated: 2.73 on accounts and 1.78 for top traders. The 24-hour taker buy/sell ratio at 0.985 signals moderate selling aggression. This asymmetry raises the risk of long capitulation if $76,270 breaks, while a bullish squeeze would require a recovery to $78,900.
Calendar: Catalysts to Watch
The calendar over the next ten days is dense. Three events stand out: the NFP on November 6 is the most likely to pull price out of its structure, and the BoE decision on November 5 may front-run it.
- Tuesday, November 3, 16:00 (Zurich) — JOLTS (consensus 7.13; previous 7.079): labor-market tightness that shapes rate expectations.
- Wednesday, November 4, 11:00 (Zurich) — Eurozone flash core inflation (2.5% expected; previous 2.5%): a key input for the European rate path.
- Wednesday, November 4, 16:00 (Zurich) — ISM services (54.8 expected; previous 54.9): confirmation or not of US economic strength.
- Thursday, November 5, 13:00 (Zurich) — BoE decision (4.00% expected, versus 3.75% previously): a new global tightening step would reinforce risk aversion.
- Friday, November 6, 14:30 (Zurich) — Nonfarm payrolls (consensus 65,000; previous 29,000), unemployment at 4.2% (previous 4.2%), hourly earnings at 0.3% (previous 0.1%), UoM sentiment at 16:00 (48.2; previous 48): a strong print revives the tightening scenario, a weak one gives Bitcoin room.
Three Scenarios for the Coming Weeks
The three scenarios share the same hierarchy: the short-term bearish bias dominates, but each path depends on a specific trigger. The probabilities, set by the analyst, total 100%.
Scenario A — Bearish Continuation Toward $75,000 (probability 55%)
The central case assumes a rejection below $77,100–$77,650 or an H4 close below $76,270. The most likely catalyst is an NFP print above 65,000 jobs on November 6 at 14:30, or a restrictive message from the BoE on November 5. The path leads first to $75,400, an estimated long pocket and the lower bound of the H4 wedge, then to $74,300, where the estimated pocket and the daily support at $74,909 are in transit, and finally to $73,500–$73,900. Execution zone: sell at $77,300–$77,600, stop at $78,400 (about 1.2 H4 ATR above), target 1 at $75,400 (R:R ≈ 2.3), target 2 at $74,300 (R:R ≈ 3.5). Invalidation: H4 close above $78,400.
Scenario B — Liquidity Sweep Then Technical Rebound (probability 30%)
This scenario assumes a wick below $76,270 down into the $75,200–$75,450 pocket, followed by an H4 close back above $76,600. With the triple-top target already reached, a relief rebound fits a daily RSI near 35. The path leads to $77,630, then to the $78,200–$78,850 zone, the upper bound of the H4 wedge. Execution zone: buy at $75,300–$75,700, stop at $74,700 (about 1 H4 ATR below entry and below the daily support at $74,909), target at $77,600 (R:R ≈ 2.6). Invalidation: H4 close below $74,900.
Scenario C — Bullish Invalidation (probability 15%)
The trigger is an H4 close above $78,900, the zone of the H4 SuperTrend ($78,938) and the H4 SMA50, fuelled either by a weak NFP below 65,000 or by geopolitical easing. The path targets $80,480, then $82,350–$83,130, where the double-top neckline and the estimated short pocket sit. Execution zone: buy at $79,000–$79,300, stop at $78,200 (about 1 H4 ATR below entry), R:R ≈ 3 toward $82,350. Invalidation: H4 close below $78,200.
Summary and Conclusion
The current phase is a distribution slowly turning into a rout, triggered by the October 29 Binance shock against a backdrop of restrictive monetary policy. The daily and H4 bearish patterns are validated, but with their targets nearly reached, further downside now depends on whether $76,270 holds. Flows support the bearish bias, between Binance outflows and sector-wide distrust, while treasury buying, such as Strive’s, remains too modest to reverse direction. The critical levels to watch are $76,270, $75,200–$75,450, $74,900, $77,650 and $78,900.
The dominant technical strategy is to sell rallies below $77,650, with protection above $78,400, and to seek buys only after a sweep of $75,200–$75,450 followed by a close back above it. An H4 close above $78,900 would challenge the short-term bearish bias. With weekend volumes thin, the volatility expected around the November 6 NFP at 14:30 argues for smaller position sizes.
Sources
- Bitcoin Firm Strive Climbs Up the Treasury Ranks With Another Big Buy — Decrypt, November 2, 2026
- Bitcoin risks drop below $76K as 7% oil slide fails to spark BTC price rally — Cointelegraph, November 2, 2026
- Australia lifts rates to 18-year high as AI boom, energy costs fuel inflation — Cointelegraph, November 3, 2026
- Australia hikes rates to 18-year high to fight inflation — CNBC, November 3, 2026
- Binance completes latest proof of reserves as it works to restore assets, withdrawals after record hack — The Block, November 2, 2026
- Mercado Bitcoin, Brazil’s largest crypto exchange, hit by $46 million security breach — The Block, November 2, 2026
- Binance XRP Outflows Explode to 226 Million as Whale Activity Reaches Levels Last Seen in 2022 — CryptoPotato, November 3, 2026
- OKX draws $445M in net inflows as Binance outflows exceed $7B — Cointelegraph, November 2, 2026
- Mystery $106 Million Crypto Theft Hits EU Entity Days After Binance Hack — Decrypt, November 2, 2026
- South Korea urges exchanges to boost cold storage after Binance hack — Cointelegraph, November 3, 2026
- The bond-market rally is defying the typical investing playbook — MarketWatch, November 2, 2026
- Crypto.com to withdraw Hong Kong consumer app citing regulatory changes — Cointelegraph, November 3, 2026
- New Jersey drops Coinbase staking order ahead of crypto’s midterm test — Cointelegraph, November 2, 2026
- Adviser and Regulated Fund Custody Rules; Crypto Custody Rules — Federal Register, October 6, 2026
- RUNE sees major sell-offs after FBI’s demand to block Binance hacker transactions — AMBCrypto, November 3, 2026
Disclaimer: This article is for educational and informational purposes only. It does not constitute investment advice, a recommendation to buy or sell, or an invitation to trade any financial asset. Cryptocurrency markets are extremely volatile; any investment decision should be based on your own research (DYOR) and, where appropriate, the advice of a licensed financial adviser.

