
In mid-May 2026, Bitcoin (BTC) stands at a defining crossroads. Compressed around the critical $80,500 threshold, the digital asset is locked in a battle against the algorithmic wall of the 200-day EMA, while a historic Golden Cross looms on the horizon. From macroeconomics to institutional flows, order book microstructure and multi-timeframe chart analysis — here is a comprehensive breakdown of the current situation.
Macroeconomic Backdrop: CPI as a Market Catalyst
The dominant fundamental catalyst of this period has been the release of US inflation data (CPI) in mid-May. Headline CPI came in at +2.7% year-over-year, perfectly in line with economist estimates. More significantly, the Core CPI (excluding food and energy) registered at +2.6% annually, slightly below the market’s +2.7% expectation. On a monthly basis, the reading was a modest +0.2%, underscoring a gradual disinflationary trend.
This moderation in inflationary pressures reinforces the soft-landing narrative for the US economy and mechanically increases the probability of monetary easing by the Federal Reserve before year-end. In this context, the opportunity cost of holding a non-yield-bearing asset like Bitcoin diminishes, enhancing its appeal as a store of value against fiat monetary dilution. Bitcoin’s reaction to the release was surgical: an immediate bullish volatility spike above $82,000. Notably, the Bureau of Labor Statistics accidentally published the CPI data 30 minutes early, causing a brief information asymmetry and amplifying algorithmic volatility.
On the geopolitical front, the reopening of the Strait of Hormuz to commercial traffic under US escort has significantly eased one of the most pressing tail risks on global energy markets. Meanwhile, the impending leadership transition at the Fed — from Jerome Powell to Kevin Warsh — introduces policy uncertainty, pushing institutional players toward gradual accumulation near key support levels rather than unilateral directional bets.
Institutional Flows and Market Structure
The architecture of the Bitcoin market has been fundamentally reshaped by US spot ETFs. Since their launch, these vehicles have accumulated cumulative net inflows approaching $58 billion. Recently, a remarkable streak of nine consecutive days of net inflows siphoned an estimated 33,000 to 35,000 BTC from available exchange supply. In a single month, issuers attracted close to $1.9 billion.
BlackRock’s IBIT fund, now managing over $63 billion in assets, absorbs Bitcoin daily at a rate that far exceeds new supply generated by mining. This structural imbalance creates a supply shock: liquid supply tightens, making price elasticity asymmetric in favor of sharp upside moves against any renewed marginal demand. Digital Asset Treasuries (DATs) — publicly listed companies holding BTC on their balance sheet — form a second institutional pillar, providing structural support beneath current price zones.
On the regulatory front, market attention is focused on the CLARITY Act, legislation under review by the US Senate Banking Committee, aimed at establishing a transparent framework for digital asset custody and stablecoins. Its passage would act as a powerful catalyst by dramatically reducing the legal uncertainty that still blocks entry by the most conservative institutional capital.
Microstructure and Liquidity Mapping (Heatmap)
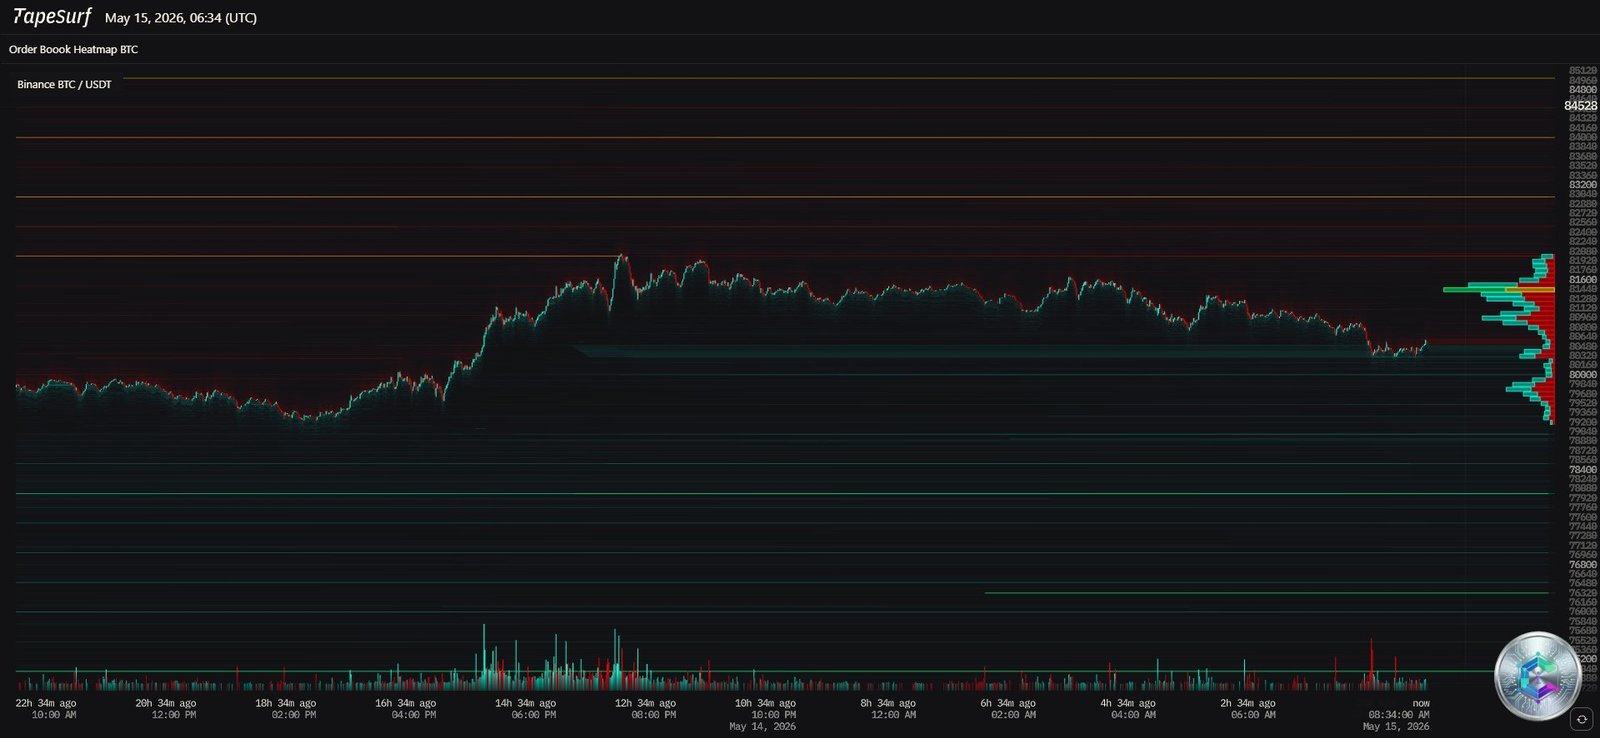
The BTC/USDT order book heatmap on Binance reveals an extremely stratified liquidity landscape. Above the current price (~$80,500), dense sell walls are visible at $81,500, $82,000, $83,000, and notably $84,528. These limit order concentrations act as kinetic barriers: selling algorithms aggressively defend these levels to protect short positions or execute institutional profit-taking.
Below current price, buy order clusters are stacked with notable concentrations around $79,000 and $78,000, forming cushions against any sudden downside move.
On-chain analysis reveals the ultimate stakes: a colossal cluster of short liquidations is building just above the $90,000 psychological barrier. If BTC manages to erode the visible sell walls and breach that level, an estimated $350+ million short squeeze would be triggered, potentially propelling prices toward the $92,800–$95,000 range. Conversely, deep magnetic zones remain at $74,000 and historically between $56,000–$58,000.
A key structural data point: the market recorded an extraordinary 67 consecutive days of negative perpetual funding rates — a rare anomaly signaling excessive bearish bias. Historically, such extended periods precede violent bullish reversals, as even the slightest fundamental spark forces the capitulation of over-leveraged shorts.
Daily Chart Analysis: EMA 200, the Golden Cross and Power Zones
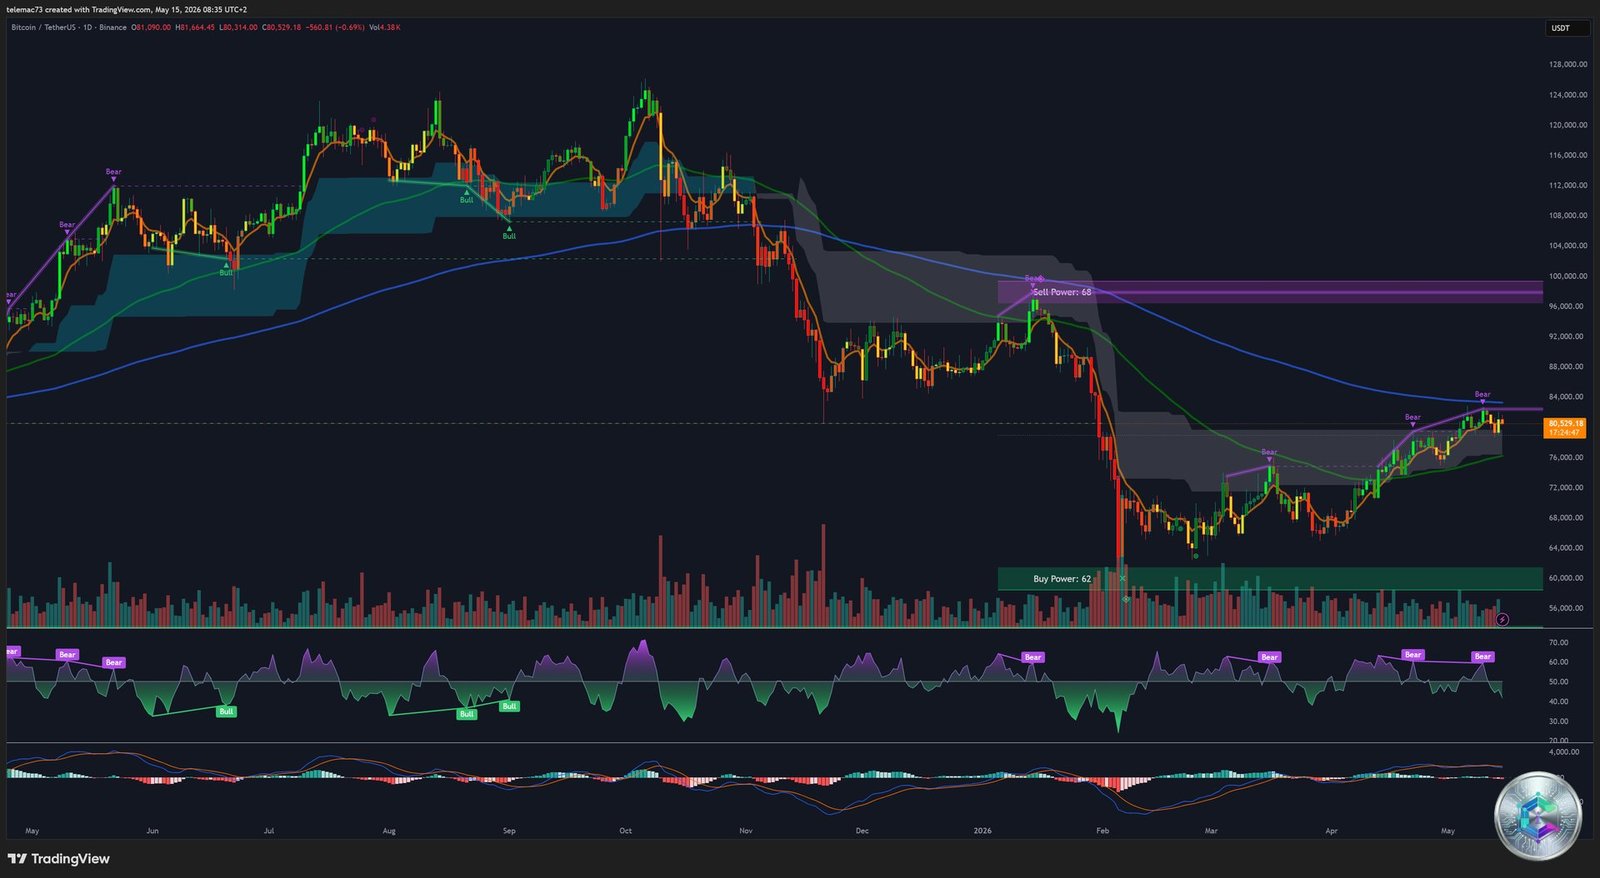
The daily chart presents a dramatic backdrop. After an all-time high surpassing $120,000, the asset suffered a capitulative correction toward $60,000, before beginning its current laborious recovery. Two major institutional power zones frame price action:
- Buy Power: ~$60,000 — the absolute institutional floor of the current cycle; a zone of aggressive, inelastic accumulation.
- Sell Power: ~$96,000–$100,000 — the ultimate structural resistance before uncharted price discovery territory.
At $80,529, Bitcoin is literally caged by the 200-day EMA (ranging $80,200–$82,000 across platforms), the absolute demarcation line between a bear and bull market. Price oscillates around this line, unable to print a convincing series of daily closes above it — a classic configuration that typically precedes a violent resolution.
The most decisive technical formation in progress is the Golden Cross: the bullish crossover of the 50-day SMA above the 200-day SMA. Although a lagging indicator, its psychological impact on trend-following algorithms and systematic fund managers is immense. In recent occurrences, this signal has preceded price expansions of 45% to 60%.
Oscillators confirm the deadlock: the 14-day RSI at 53.11 — in absolute neutral territory — mathematically reflects the kinetic energy accumulating beneath the surface. The MACD at +292.51 emits a sustained structural buy signal, with the histogram indicating a fading of bearish pressure.
| Period | SMA | SMA Signal | EMA | EMA Signal |
|---|---|---|---|---|
| 5 Days | $81,212 | 🔴 Sell | $81,174 | 🔴 Sell |
| 20 Days | $80,750 | 🟢 Buy | $80,834 | 🟢 Buy |
| 50 Days | $80,329 | 🟢 Buy | $80,580 | 🟢 Buy |
| 200 Days | $80,727 | 🟢 Buy | $80,210 | 🟢 Buy |
4-Hour Chart Analysis: Symmetric Triangles and Compression Patterns
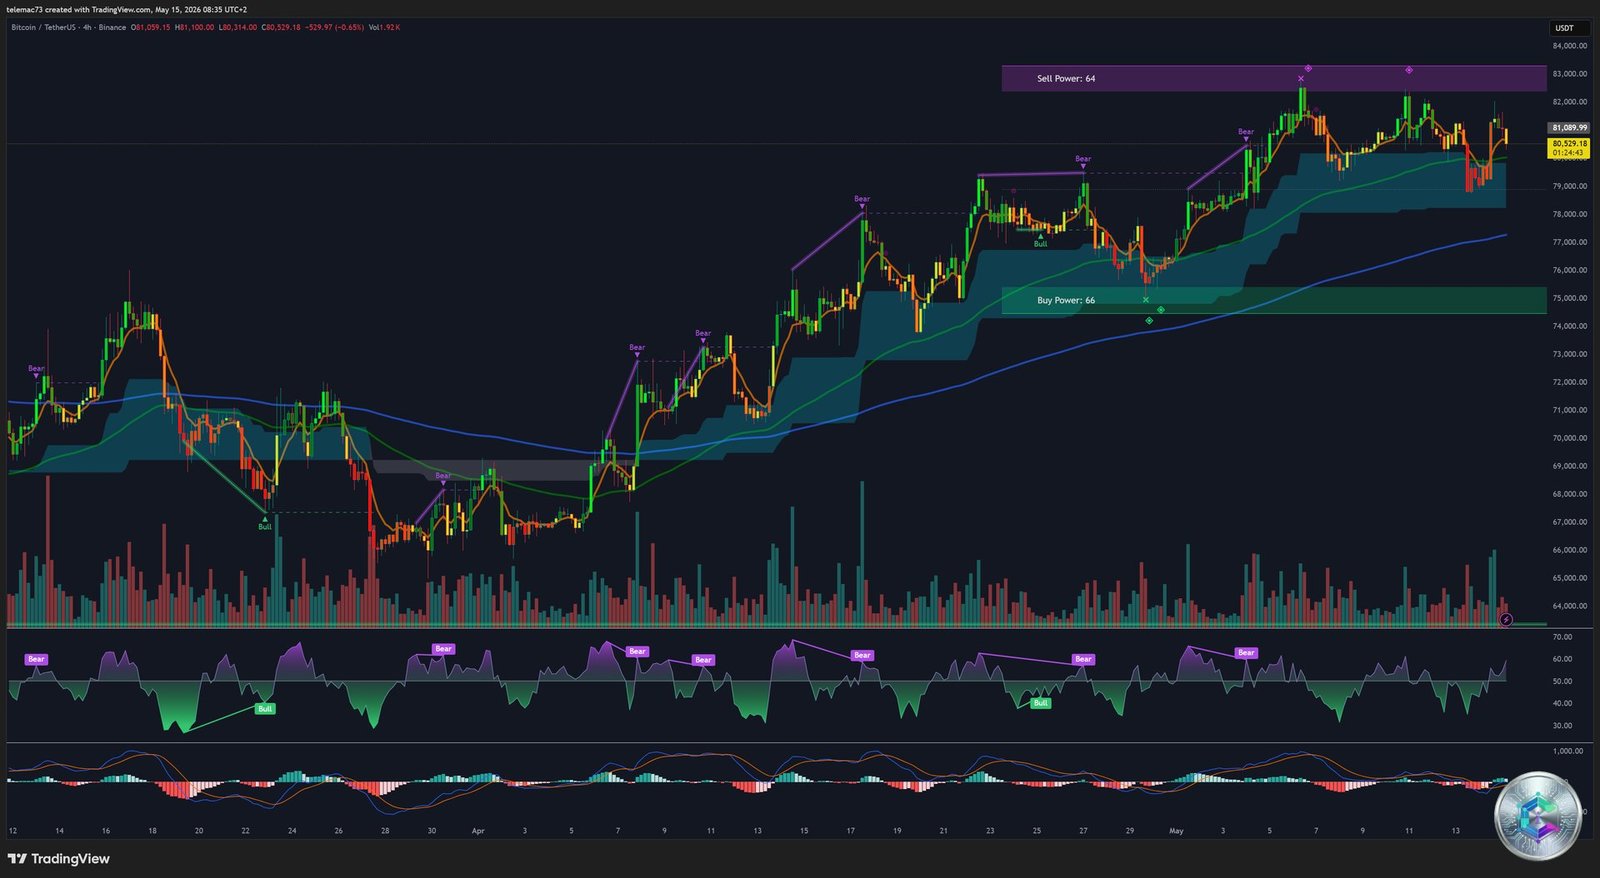
The 4-hour chart filters intraday noise and reveals medium-term chart structures. The « Sell Power: $82,000–$83,000 » zone caps the upper range, precisely corresponding to the 200-day EMA cage. In mirror, the « Buy Power: $74,000–$75,000 » zone marks the floor of intermediate-term conviction.
The market has formed a succession of symmetric triangles — converging descending resistance and ascending support — signaling a balanced standoff and volatility contraction. As the apex of the major formation approaches, technical theory dictates that a decisive breakout will determine the directional bias for weeks ahead:
- Bullish breakout + volume surge → absorption of the Sell Power zone, cascade liquidation trigger, target $92,000–$95,000.
- Bearish breakdown → test of the Buy Power zone at $74,000, purging medium-term holders.
Bull Flag sequences (impulsive pole followed by low-volume consolidation channel) also appear throughout the chart. The systematic strategy involves waiting for a 4H candle close above the upper trendline of the flag to enter long, with a price target projecting the height of the initial pole — pointing toward the $92,000–$95,000 area. RSI divergences — bearish divergences that correctly anticipated rejections at $83,000 — complete the picture. The MACD oscillates feebly around zero in classic range-bound fashion: a pure directional signal will only emerge upon a validated breakout with accelerating momentum.
15-Minute Chart Analysis: Flush-Out and V-Shape Recovery
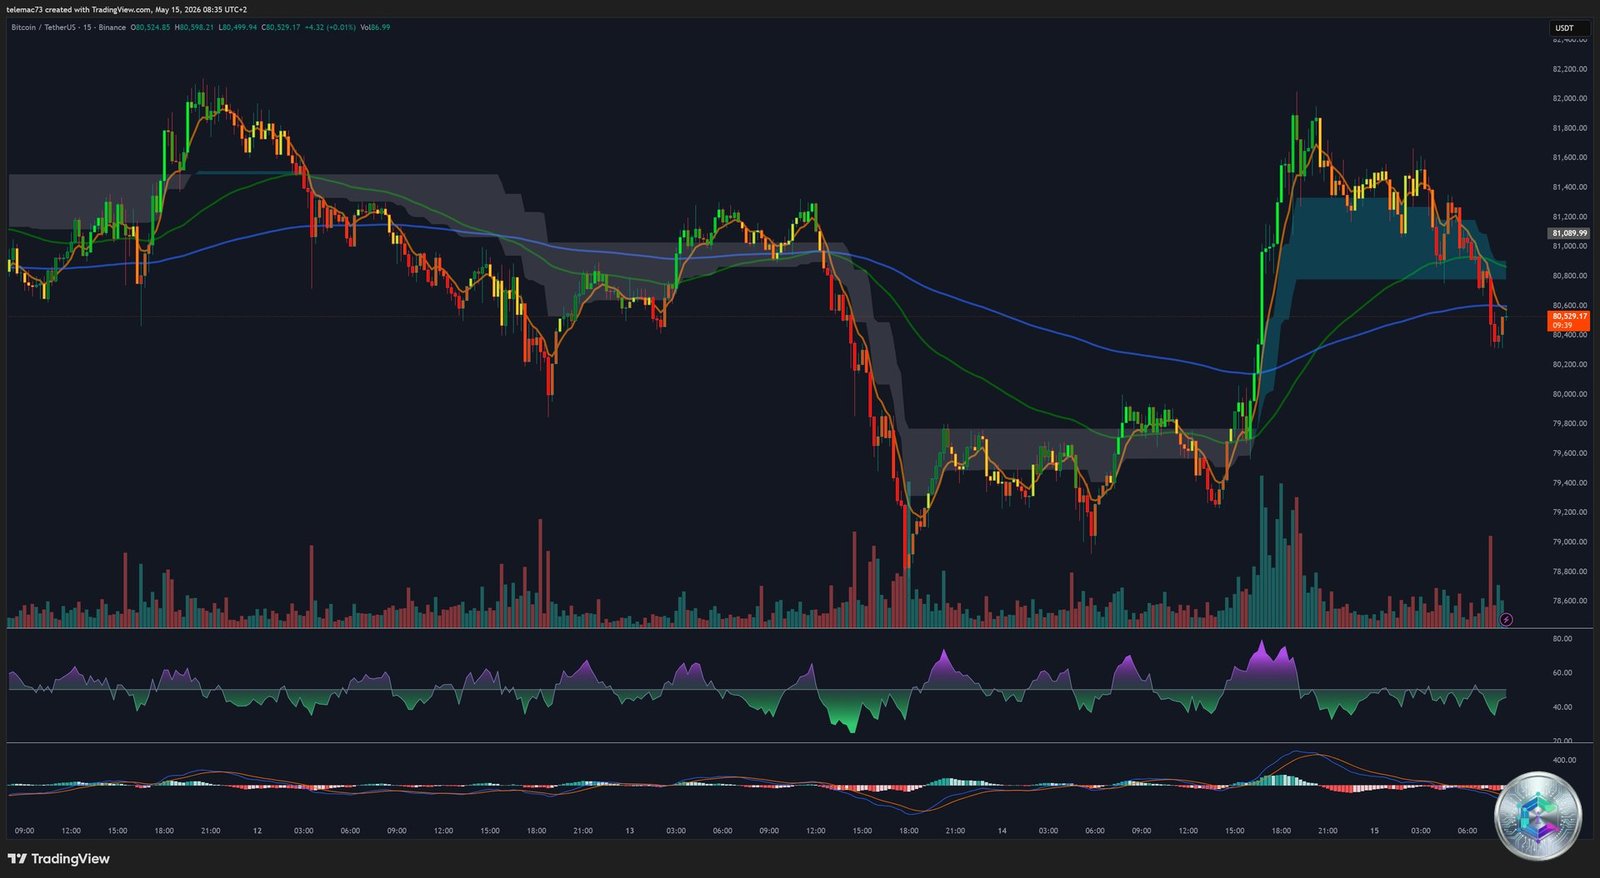
The 15-minute chart plunges into the heart of algorithmic microstructure. It distinctly reveals a near-vertical price collapse — from the perceived safety zone of $82,000 down to $79,000 — accompanied by a massive volume spike, symptomatic of a cascade of liquidations in over-leveraged long positions orchestrated by market makers hunting liquidity.
The subsequent dynamic is equally revealing: an aggressive V-shape recovery propels the asset beyond its drop origin point, driven by enormous green candles on high volume. This behavior, characteristic of institutional buy-the-dip activity, confirms the presence of structural buyers underneath the market.
Key intraday levels identified:
- Immediate Support: $80,500 — a break below opens toward $79,000.
- Immediate Resistance: $81,500 — must be cleared to revive the assault on the 200-day EMA.
- Scalping Setup: Entry ~$80,000 (minor Fibonacci retracement), Stop-Loss $78,800, TP1: $81,500, TP2: $82,500.
Pivot Points and Quantitative Volatility Analysis
The mathematical pivot point framework provides an objective map of high-probability reversal zones. Remarkably, all methodologies — Classic, Fibonacci, Camarilla, Woodie — converge tightly around a Central Pivot in the $81,230–$81,270 range, mathematically explaining the market’s difficulty sustaining price above this level. R2 and R3 resistances ($81,700–$81,900) align precisely with the 200-day EMA.
| Method | S1 | Central Pivot | R1 | R2 |
|---|---|---|---|---|
| Classic | $80,941 | $81,272 | $81,447 | $81,777 |
| Fibonacci | $81,079 | $81,272 | $81,465 | $81,585 |
| Camarilla | $81,069 | $81,272 | $81,162 | $81,208 |
| Woodie | $80,863 | $81,233 | $81,368 | $81,738 |
On structural volatility: the 14-day ATR stands at $540 — historically low for Bitcoin. A foundational principle of financial markets applies here: a prolonged volatility compression invariably precedes a violent expansion phase. Moreover, recent comparative studies show Bitcoin’s annualized volatility is now lower than that of 33 S&P 500 stocks — a systemic maturation that structurally improves the asset’s risk-adjusted return profile.
Strategic Synthesis and Outlook
The aggregation of macroeconomic, fundamental, and technical data paints the portrait of a digital asset in full tension between two opposing forces:
Bullish forces: Moderating CPI (Fed rate cut narrative), structural ETF absorption (~$58B), imminent Golden Cross, 67 days of negative funding (short capitulation approaching), structural MACD buy signal, historically compressed volatility.
Bearish forces: Multi-dimensional 200-day EMA resistance (confirmed by pivot convergence and standard deviation barriers), symmetric triangles without a validated breakout, Fed policy uncertainty under new leadership, CLARITY Act still in legislative limbo.
Bullish scenario (probabilistic): Golden Cross acts as the catalyst, decisive fracture of the 200 EMA, triggering the short squeeze (>$350M), propulsion toward the $92,800–$95,000 target zone, opening the door to uncharted price discovery.
Bearish scenario (tail risk): Extended rejection below the 200 EMA, unexpected macroeconomic shock, long liquidation cascades toward $74,000, with a deep historical magnetic zone between $56,000–$58,000.
The era of disorderly Bitcoin speculation is fading, giving way to an institutionalized market mechanics — predictable in its microstructure, yet implacable in its execution. The volatility spring is coiled to its extreme. The next directional resolution promises to be explosive.
⚠️ Disclaimer: This article is written exclusively for educational and informational purposes. It does not constitute investment advice, a recommendation to buy or sell, or an inducement to carry out any financial transaction. Crypto-asset markets are highly volatile and carry a risk of capital loss. Please consult a qualified financial advisor before making any investment decision.