


Bitcoin is currently trading around $81,764, driven by a 6% bullish impulse triggered by the market’s absorption of a Federal Reserve rate hike and the liquidation of over $170 million in short positions. The asset is now approaching a critical congestion zone between $82,000 and $83,200, where the 200-day moving average, the resistance from the September 3rd high at $82,283, and a massive sell-wall clustered at $82,300 on the Tapesurf order book all converge. This integrated technical analysis cross-references the daily, 4-hour, and 15-minute timeframes with order-book depth and macroeconomic context to outline the most likely scenarios for the current session.

Macro Backdrop: A Tighter Fed, a Resilient Market
Bitcoin’s market structure consolidated in the wake of the Federal Open Market Committee (FOMC) meeting on September 16, 2026. Under Chair Kevin Warsh, the Federal Reserve raised its benchmark rate by 25 basis points, lifting the federal funds target range from 3.50%–3.75% to 3.75%–4.00%. This marks the first hike since July 2023, approved unanimously by all twelve voting members, in response to persistent PCE inflation at 3.7% and heightened energy pressures in the Middle East. While monetary tightening typically weighs on non-yielding assets, Bitcoin showed notable resilience after a brief bearish volatility spike.
| Macro Indicator | Observed Value | Impact on BTC |
|---|---|---|
| Federal funds rate | 3.75% – 4.00% (+25 bps) | Tighter liquidity conditions |
| FOMC 2026 Dot Plot | Median revised to 4.1% | Expectation of one more hike by year-end |
| Bitcoin Spot ETF flows (Sept 15-16) | Net outflows of $746.3M | Preemptive de-risking ahead of the announcement |
| Bitcoin Spot ETF flows (Sept 17-18) | Net inflows of $592.5M (+$433M on the 18th) | Aggressive resumption of spot allocations |
| Short liquidations (Sept 18) | Over $170M above $80,000 | Mechanical acceleration of price |
| Total crypto market cap | $2.67 to $2.86 trillion | Broader liquidity expansion and risk appetite |
This rapid flow reversal illustrates how quickly the market absorbed the monetary shock: outflows recorded on September 15 and 16 were fully offset the very next day by massive inflows reaching $433 million on September 18, with no institutional deleveraging observed. This spot buying triggered a cascade of short-position liquidations as soon as the $80,000 psychological threshold was breached, turning a period of macro hesitation into a genuine technical breakout toward $82,000.
Daily Chart (1D): Breakout From Accumulation, Overbought Pressure
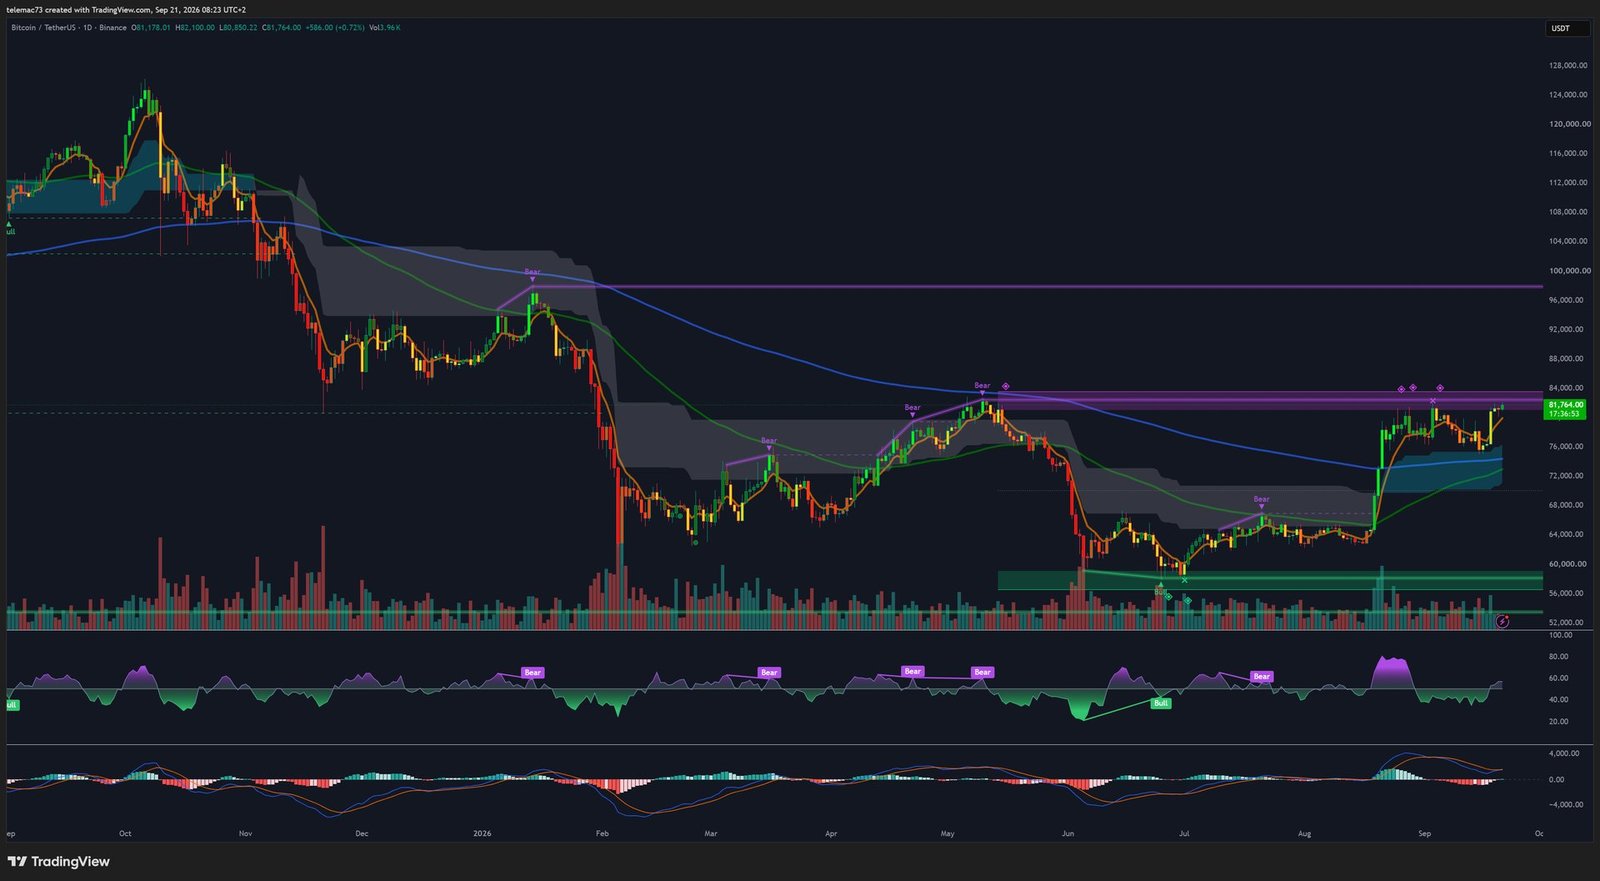
On the daily timeframe, Bitcoin is emerging from a secular consolidation phase established between $60,000 and $64,000. This accumulation zone, validated in early summer by a classic bullish RSI divergence, gave way to an extension that broke through the former intermediate high at $76,000, driving the market into direct contact with the blockage zone between $82,000 and $84,000.
| Indicator (1D) | Reading | Implication |
|---|---|---|
| Structural trend | Bullish breakout from accumulation | Confirms a macro floor |
| 50-day moving average | Turning higher near $72,000 | Medium-term dynamic support |
| 200-day moving average | Downward slope at $83,200–$84,000 | Major secular resistance |
| RSI (14) | 73.0 — overbought territory | Elevated risk of a pause or pullback |
| MACD (12,26,9) | Golden Cross below the zero line | Net injection of bullish momentum |
The technical standoff is crystallizing around the 200-day moving average. While the bullish MACD crossover confirms a significant momentum injection, the still-declining slope of that moving average indicates the underlying long-term trend hasn’t fully healed. A daily RSI reading of 73 generates the kind of overheating signal that historically precedes corrective pullbacks. Without a clean daily close above $83,200, the market remains exposed to institutional profit-taking.
4-Hour Chart (4H): Flag Compression and an Emerging Divergence
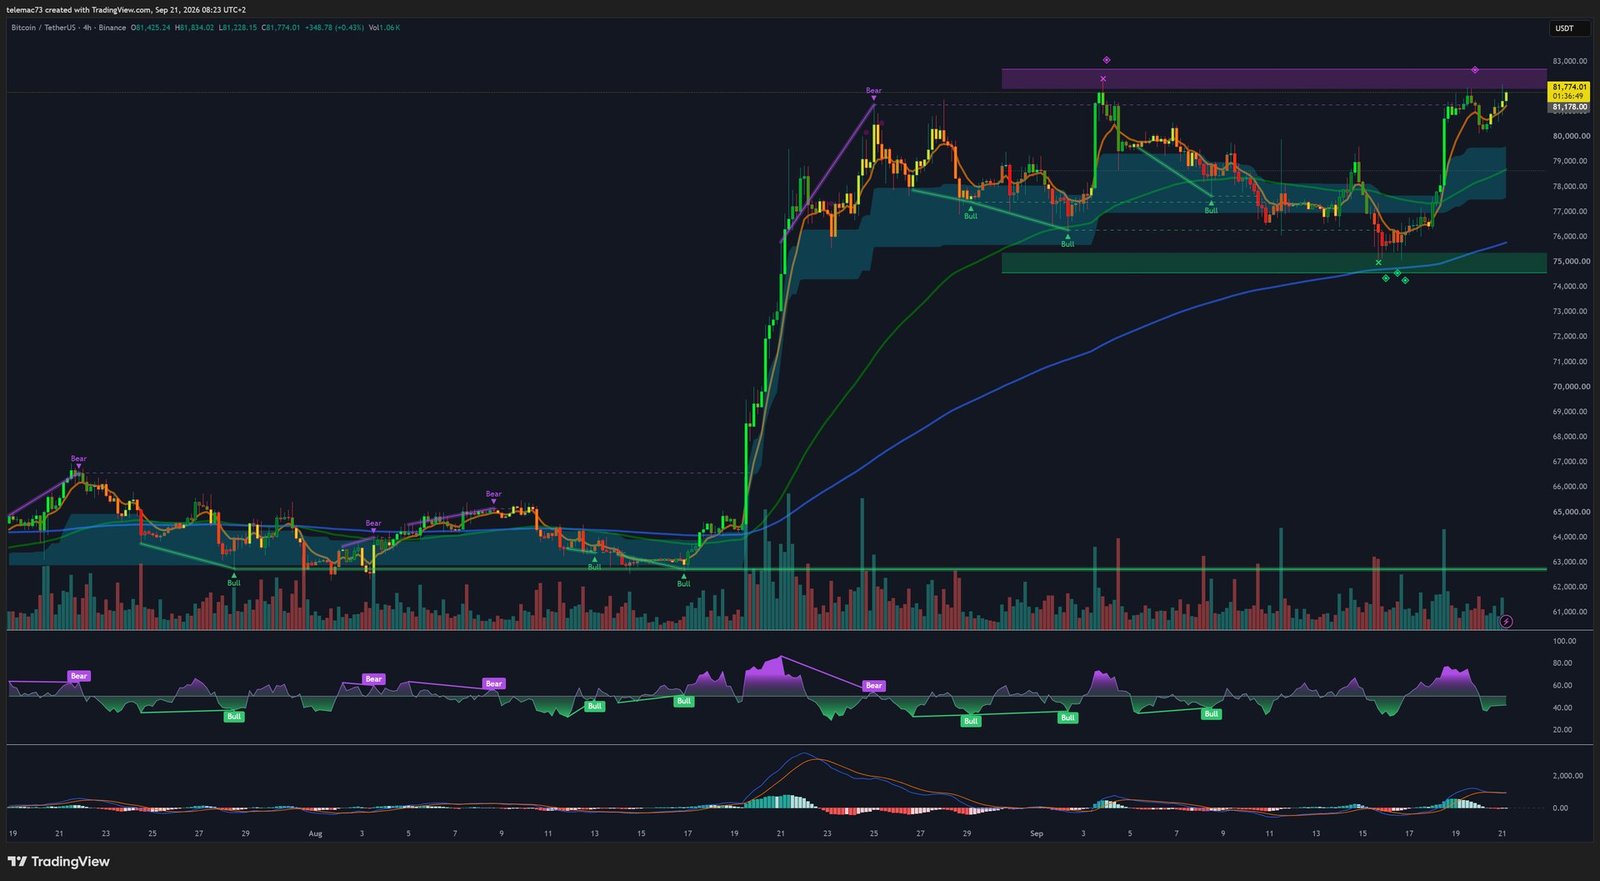
The 4-hour view details the transition between the impulsive rally that began at the 200 EMA support ($75,800) and the current consolidation sequence. Price is oscillating under the $82,300 ceiling while printing higher lows supported by the 50 EMA ($80,800), forming a bullish flag — a continuation pattern typically marked by progressively shrinking candle amplitude.
| Component (4H) | Technical State | Diagnosis |
|---|---|---|
| Chart pattern | Bullish flag / ascending triangle | Theoretical bullish resolution estimated at 65% |
| 50 EMA support | $80,800 – $81,000 | First line of defense for buyers |
| 200 EMA support | $75,800 – $76,350 | Structural base of the impulse |
| RSI 14 | 68.5 — sideways bias | Emerging bearish divergence vs. the Sept 3 peak |
| MACD | Contracting toward the neutral line | Momentum deceleration ahead of a new arbitrage |
The steady bearish divergence on the 4H RSI is the main cautionary signal: price is aggressively testing the $82,200–$82,300 zone, yet the oscillator fails to reprint the highs of September 3. This mismatch reflects passive buyer absorption by resting sell-side limit orders. A confirmed bullish break with a 4H close above $82,500 remains essential to invalidate this divergence risk.
15-Minute Intraday Microstructure: The Market Catches Its Breath
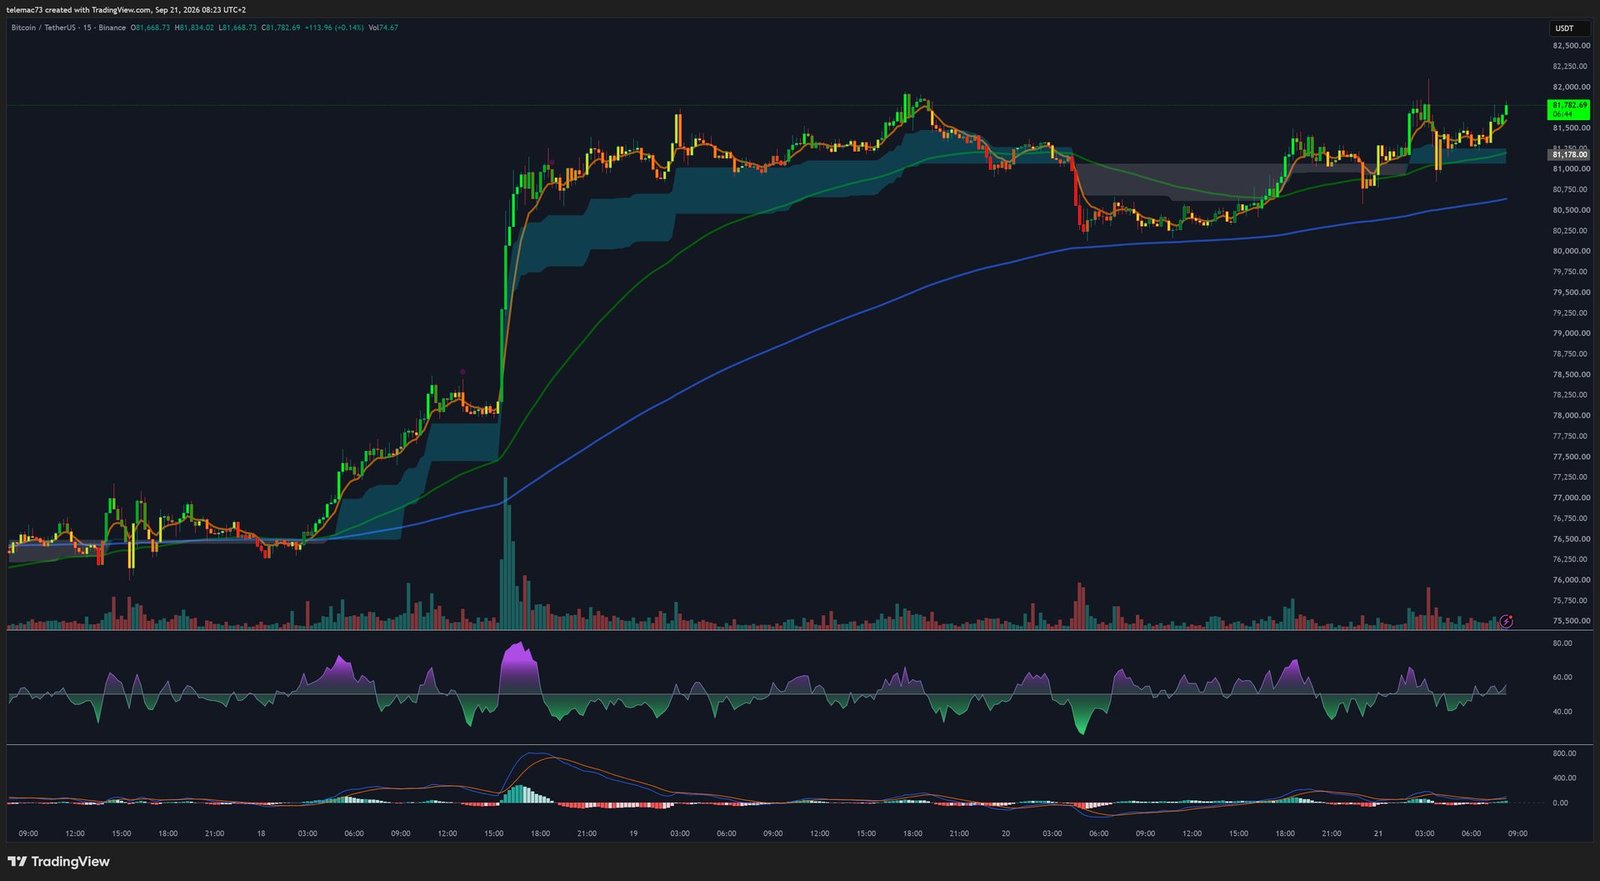
Following the sharp vertical expansion that pushed Bitcoin above $81,000, price settled into a horizontal range between $81,200 and $82,050. It is oscillating around its 50-period moving average ($81,550), the session’s pivot level, while the 200-period moving average ($80,250) serves as the major intraday trend support. The 15-minute RSI is confined to a tight band between 48 and 56, showing no marked overbought or oversold signal — this compression signals an expansion move is likely once either boundary of the range is decisively broken.
Order Book and Tapesurf Heatmap: Mapping the Liquidity
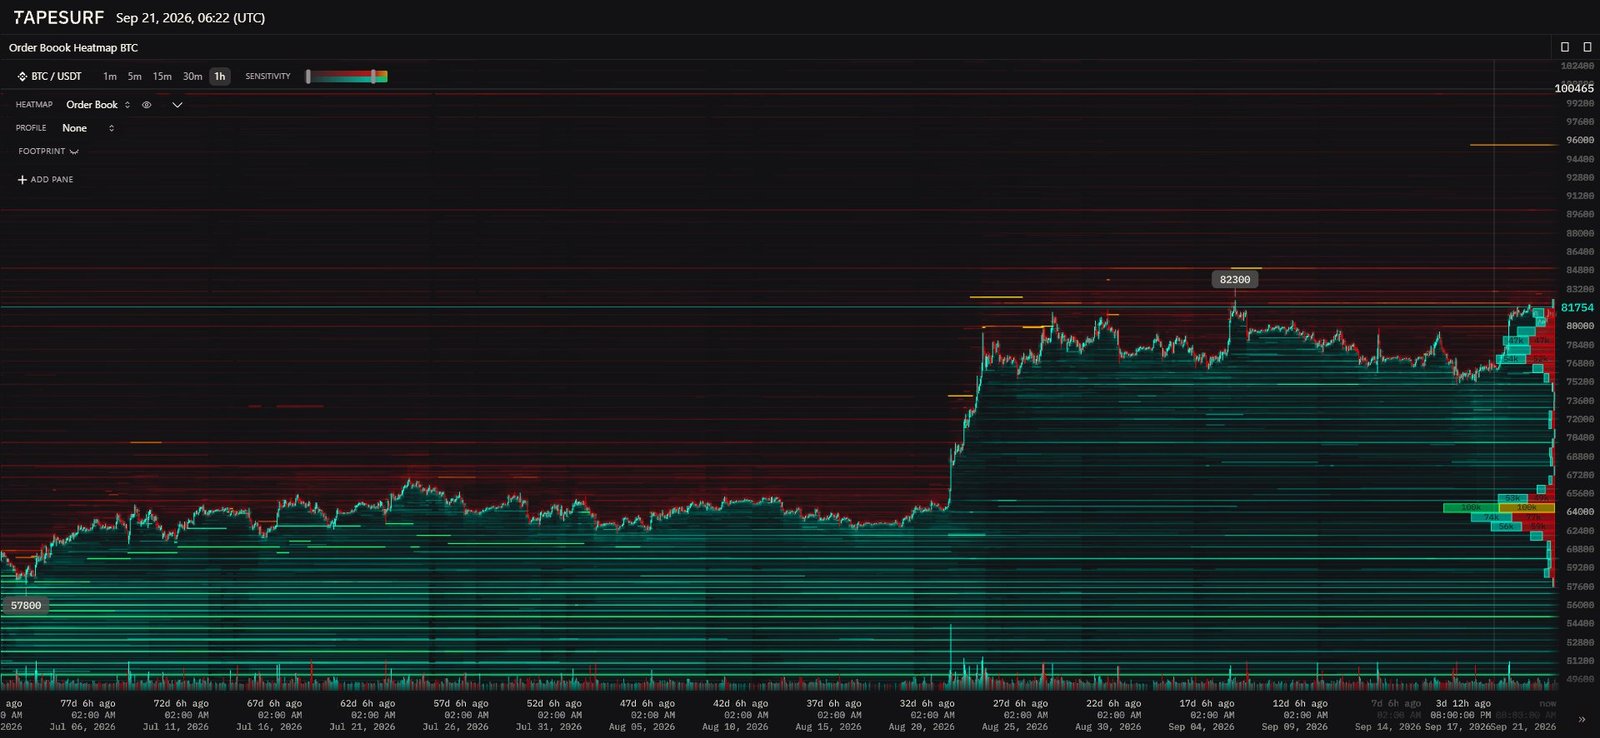
The heatmap reveals a pronounced asymmetry. Above the current price, the sell-side liquidity pocket concentrated precisely at $82,300 is the market’s main obstacle — passive sellers have clustered their liquidations and profit-taking there. If the market attempts to break through without a substantial surge in aggressive buy volume, the risk of a liquidity sweep followed by a sharp rejection remains high. Conversely, a successful absorption of that wall would expose a significant liquidity void between $84,000 and $96,000, since no major sell blocks are positioned before the $100,000 area. On the downside, passive buy orders are stacked in regular tiers between $76,000 and $78,000, providing progressive cushioning in case of a pullback.
Strategic Matrix of Key Price Levels
| Designation | Level (USDT) | Tactical Function |
|---|---|---|
| Major resistance R3 | $96,000 – $100,465 | Swing-trading profit-taking target |
| Intermediate resistance R2 | $83,200 – $84,000 | Position-trimming and rejection-watch zone |
| Immediate resistance R1 | $82,283 – $82,300 | Bullish trigger on breakout |
| Operational pivot | $81,500 – $81,760 | Intraday directional arbitrage |
| Immediate support S1 | $80,800 – $81,200 | First tactical bounce level for buyers |
| Intermediate support S2 | $78,000 – $78,500 | Reaccumulation zone in case of a correction |
| Major support S3 | $75,800 – $76,350 | Invalidation threshold for the bullish structure |
Three Scenarios Going Forward
- Scenario A — Bullish expansion via absorption (45%): a 4H close above $82,500 accompanied by rising spot volume would confirm absorption of the $82,300 wall and open the door to a rapid test of $84,000, followed by the liquidity void up toward $96,000.
- Scenario B — Rejection and healthy consolidation (40%): a rejection under $82,300 with long upper wicks would pull price back to $80,800, then to the reaccumulation zone between $78,000 and $78,500, purging the daily RSI’s overbought reading without damaging the broader uptrend.
- Scenario C — Structural bearish invalidation (15%): a daily close below $75,800 would confirm a macroeconomic bull trap, with a risk of accelerating decline toward the $60,000–$64,000 accumulation floor.
The current balance of forces — between renewed spot-ETF inflows and the density of the sell-side liquidity wall at $82,300 — places the market at a decisive bottleneck. Sound risk management suggests avoiding late market buys directly under this ceiling of resting orders: only a confirmed close above $82,500, or an entry on a pullback into the $78,000–$78,500 band, offers the most disciplined risk/reward profile under current microstructure conditions.
Disclaimer: this article is provided for educational and informational purposes only. It does not constitute financial advice, investment advice, or a recommendation to buy or sell any digital asset. Cryptocurrency markets are highly volatile; please conduct your own research and consult a qualified financial advisor before making any investment decision.

