


After a brutal capitulation in early July 2026 that dragged Bitcoin down to $57,747, the leading cryptocurrency staged one of its sharpest rebounds of the year: up 41% in a matter of weeks to a local high of $81,235 on August 25, 2026, a level not seen since mid-May. The move revived hopes of the traditional year-end rally traders call “Uptober.” Yet the rebound still leaves Bitcoin roughly 37% below its all-time high of $126,198, set on October 6, 2025. Caught between a U.S. Treasury quietly pushing dollar debasement and a Federal Reserve refusing any policy pivot, the market enters September 2026 under some of the tightest tension seen all year.
An Unprecedented U.S. Monetary Split
The underlying macro backdrop pits two U.S. institutions against each other. On one side, Treasury Secretary Scott Bessent has launched a long-dated bond buyback program aimed at capping rising yields — an intervention that weighs on the dollar and has reignited the so-called “debasement trade,” the flight toward supply-constrained assets like gold and Bitcoin.
On the other side, the Federal Reserve remains firmly restrictive. At the Jackson Hole symposium, Chair Kevin Warsh poured cold water on pivot hopes, noting inflation remains persistently above the 2% target, with 54% of PCE basket components still posting annual increases above 3%. The market-implied probability of a September rate hike jumped from 35.4% to 55.5% in just 24 hours, triggering a sharp correction: Bitcoin fell back below $78,000 and more than $640 million in leveraged positions were liquidated within days.
The Corporate Treasury Mirage Unwinds
The model popularized by Michael Saylor and MicroStrategy — raising debt to stockpile Bitcoin on the balance sheet — is showing serious cracks. Since mid-2025, more than $80 billion in market capitalization has been wiped out among the 50 largest corporate Bitcoin holders, whose combined valuation has fallen from $150 billion to $67 billion. Most of the 43 companies affected now trade below their pre-pivot share price. Squeezed by debt service obligations, MicroStrategy itself was forced to sell nearly 7,000 BTC between late June and mid-August for about $430 million — a striking reversal for a company that had vowed to “never sell.”
Meanwhile, institutional demand has reorganized around spot Bitcoin ETFs, which logged seven consecutive days of inflows in late August, pulling in roughly $310 million in a single session on August 25. This is a healthier form of demand, driven by traditional allocators rather than leverage.
The Other Side of Adoption: South Africa’s Breakthrough
While the institutional battle dominates headlines, real-world transactional use is advancing at a striking pace. In South Africa, the value of crypto and stablecoin payments jumped 176% in the first half of 2026, propelled by the launch of the ZAR Universal Network (ZARU) stablecoin, which already captured 7.7% of MoneyBadger network volume within six months. The number of active merchants grew 51-fold in a year — a clear signal that real-world utility is advancing independently of spot-price volatility.
Technical X-Ray: Three Timeframes, One Story
Daily Chart: A Confirmed Structural Reversal
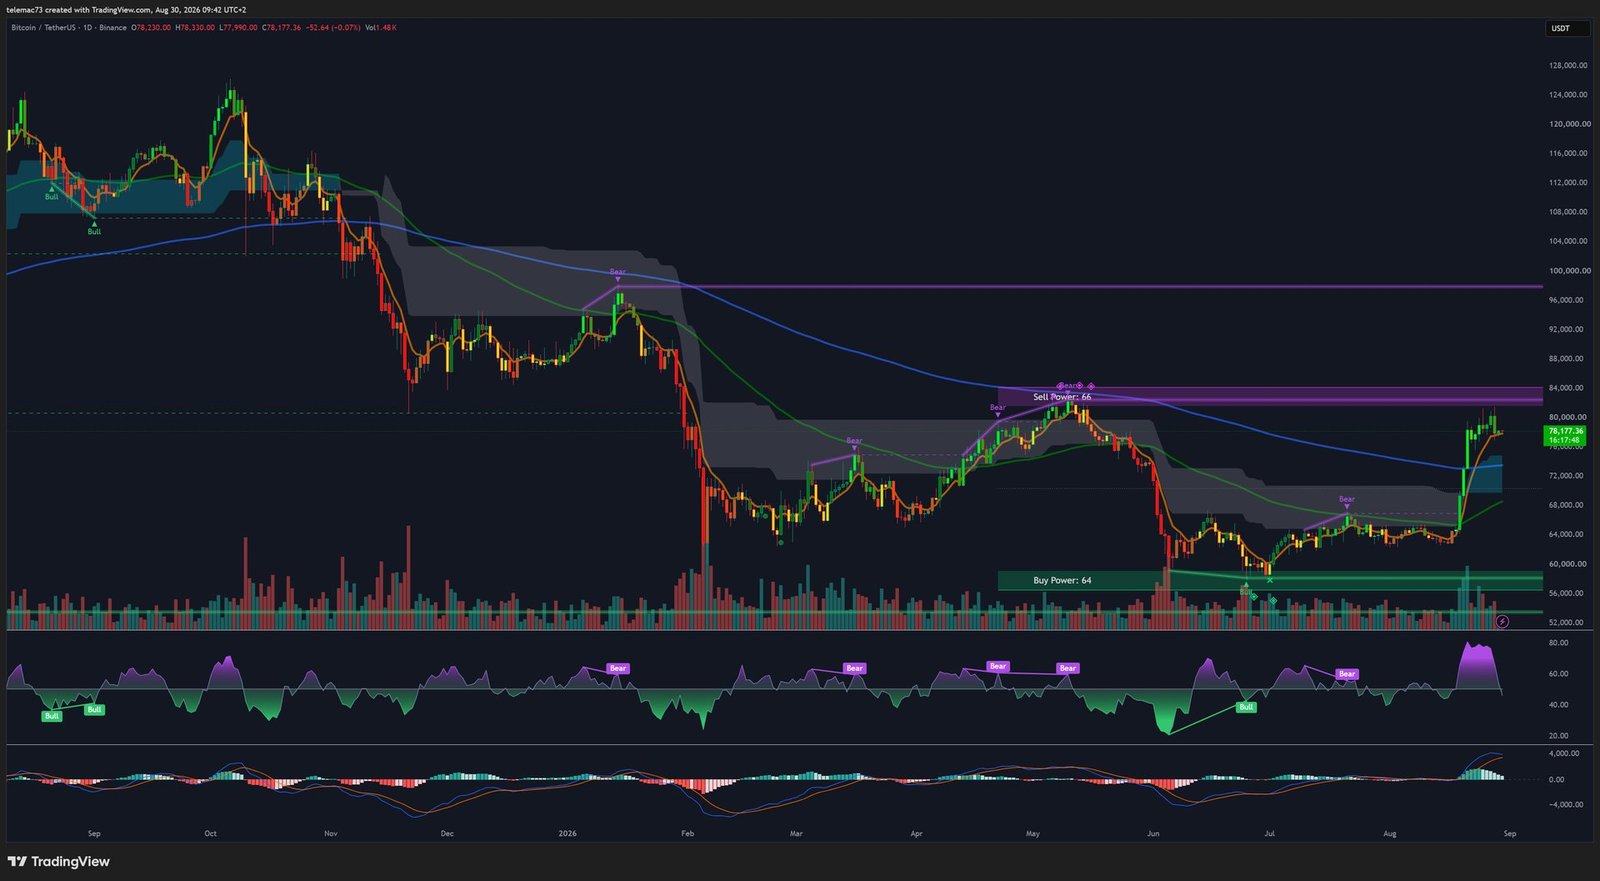
On the daily timeframe, the bearish structure of the first half of 2026 gave way to a V-bottom followed by a decisive break above the 50- and 200-day exponential moving averages. The daily RSI now sits around 60, confirming buyer dominance while leaving room before overbought territory. The MACD completed a bullish crossover well below the zero line — historically one of the more reliable reversal signals for this asset.
4-Hour Chart: Momentum Shows Signs of Fatigue
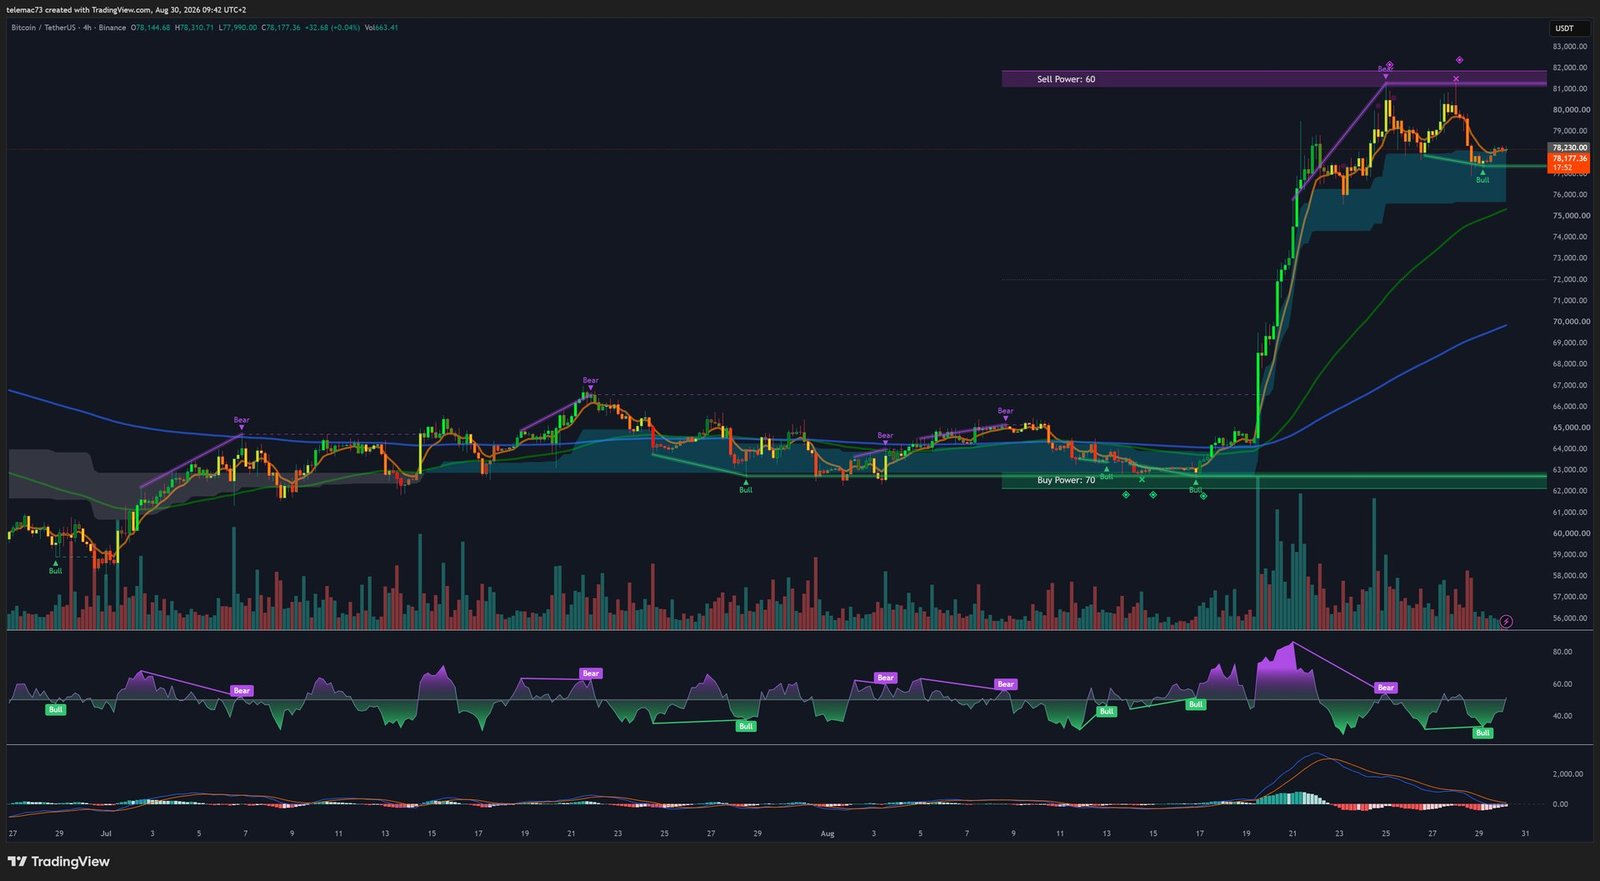
On the 4-hour chart, the vertical rally that began in mid-August ran into a dense resistance band between $81,000 and $82,000, where price has carved out what resembles a bull flag. The more troubling signal is a bearish RSI divergence on H4, printing a sequence of lower highs while price consolidated near equivalent levels. The MACD histogram has contracted sharply and threatens to flip negative, suggesting buying momentum is fading beneath the surface.
15-Minute Chart: The Jackson Hole Shock, Frame by Frame
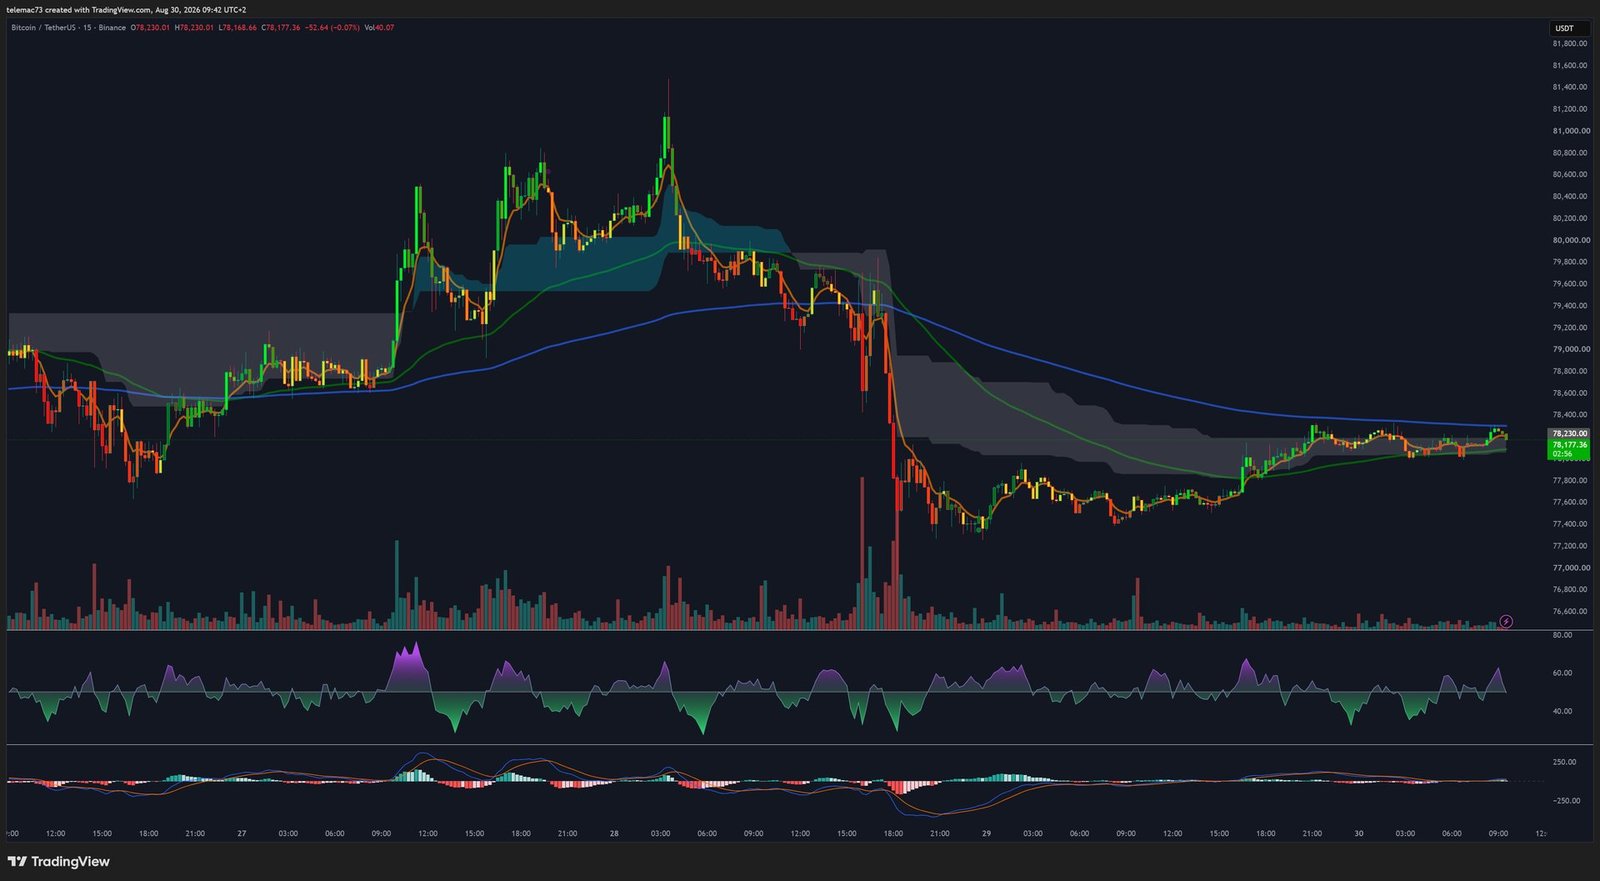
On the shortest timeframe, the impact of Kevin Warsh’s comments is unmistakable: a cascade of bearish engulfing candles alongside a massive volume spike, corresponding to the forced liquidation of hundreds of millions of dollars in long positions. Since then, the market has struggled through a choppy bottoming process, capped by a declining moving average that keeps rejecting bounce attempts.
What the Order Book Heatmap Reveals
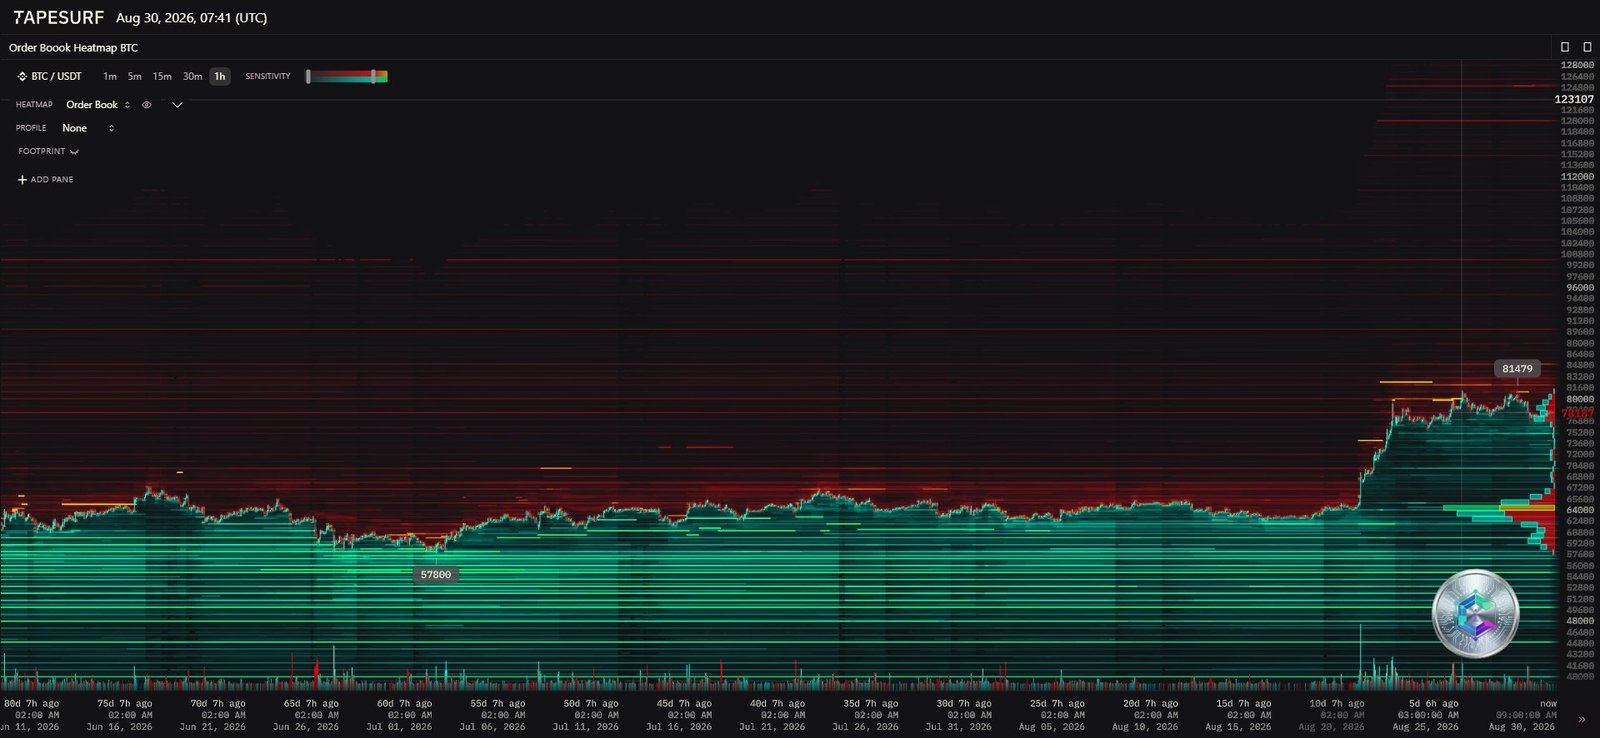
The liquidity map confirms the technical picture. A massive buy wall sits around $57,800 — the exact foundation of July’s low — which fueled the summer’s short squeeze. On the opposite end, a substantial sell wall stretches from $81,479 past $86,000, where profit-taking, corporate deleveraging, and options-market gamma hedging all converge. In between, the $65,000–$75,000 zone shows thin liquidity, explaining how quickly price was able to move through it.
Key Level Map
| Level (USD) | Category |
|---|---|
| 126,198 | All-time high resistance (Oct 6, 2025) |
| 84,000 – 86,000 | Major resistance / sell wall |
| 81,000 – 81,479 | Immediate resistance (August 2026 high) |
| 78,500 – 79,000 | Central pivot / current consolidation zone |
| 77,500 – 77,600 | Immediate support (50-day EMA) |
| 76,000 | Critical intermediate support |
| 62,000 – 63,000 | Major structural support |
| 57,747 – 58,000 | Institutional buy wall (July low) |
Two Paths Into Year-End
The Bullish Case
Successfully defending the $77,500–$78,500 support, paired with sustained ETF inflows and an intensifying debasement trade, could allow the market to break through the $81,000–$86,000 sell wall. Such a breakout, backed by expanding volume, would likely trigger forced gamma hedging from market makers and short covering, opening the path toward the $95,000–$100,000 zone.
The Bearish Case
Conversely, a hotter-than-expected U.S. inflation print — the next release is due September 11, 2026 — would validate the Fed’s concerns and raise the odds of another rate hike. Combined with contagion from tech stocks (Bitcoin’s correlation with Nvidia now exceeds 0.5) and further forced selling from indebted corporate treasuries, this scenario could break the $76,000 support and open the door to the $62,000 zone, or even a retest of the $57,800 buy wall.
Bottom Line
Bitcoin enters September 2026 in a state of extreme volatility compression, caught between a supportive monetary-debasement narrative and a Federal Reserve unwilling to ease. The $78,500–$79,000 zone stands as the key pivot: whether it holds or breaks will define the trajectory for the coming weeks, in a market increasingly correlated with broad macro and tech indicators rather than crypto-specific cycles alone.
Disclaimer: This article is provided for educational and informational purposes only. It does not constitute investment advice, a recommendation to buy or sell, or a solicitation to trade digital assets. Cryptocurrencies are highly volatile assets, and any financial decision should be preceded by thorough personal research and, where appropriate, consultation with a qualified financial advisor.

