


- Bitcoin remains below its trend: confirmed double top, six weekly declines and price under the weekly moving averages.
- Driver: open interest down 19% in seven days, documented capitulation and a 10-year yield at 5.13% with a firm Fed.
- Watch: FOMC minutes tonight at 20:00 Zurich time, then core PCE on November 25; a daily close above $72,800 would invalidate the thesis.
Bitcoin is trading below $65,000, at $64,500 on November 18, 2026, which is 26% under its period high of $87,385 reached on September 21 and about 4% above the major low of $61,956 printed on November 15. After a drop of nearly 13% over the last full week, a run of six consecutive weekly declines has pushed the weekly chart below its 10-week and 20-week simple moving averages, and the market has entered a compression phase in search of equilibrium.
The engine behind the move is first and foremost a deleveraging. Open interest has fallen 19% in seven days, according to the analyst’s model-based estimate, and investors’ realized losses have reached levels seen only near the lows of 2018, 2020, 2022 and early 2023, according to Glassnode as reported by Decrypt on November 17. Roughly 66,000 BTC were absorbed between $62,000 and $66,000. This capitulation signal has never been enough on its own to confirm a bottom, and price still has to validate it. On the corporate side, Strategy slipped back below $100 (around $97, down 5% on November 17 according to Bitcoin Magazine), below its STRC preferred for the first time since mid-August, while still holding 850,849 BTC.
The macro backdrop remains restrictive. According to CNBC (November 16), the 10-year Treasury yield stood at 5.13%, after a peak of 5.17% the previous day. Producer prices rose 6.5% year on year in October, a near four-year high, while underlying retail sales released on November 17 beat consensus (0.6% against 0.4%), an argument for a firm Fed. A 25-basis-point hike is widely expected at the December 8-9 meeting, and BofA does not rule out 50 basis points (MarketWatch, November 17). Waller considers that a 50-point move should be on the table if underlying inflation reaches 0.3% or more, which is what happened. The dollar sits near a 19-month high, and Warsh, on November 16, outlined scenarios in which AI could “disappoint”, feeding risk aversion.
Institutional flows are mixed. U.S. spot ETFs recorded net inflows of $7.9M on November 16, ending seven sessions of outflows, but their 2026 net flows remain negative by $502M according to BeInCrypto. Third-quarter 13F filings, which are delayed data, show purchases by Wells Fargo ($2.35B) and Goldman ($1.28B): a background signal rather than an immediate catalyst. This framework explains why the technical reading remains bearish first, with any rebound still a hypothesis to be confirmed.
Multi-Timeframe Technical Analysis
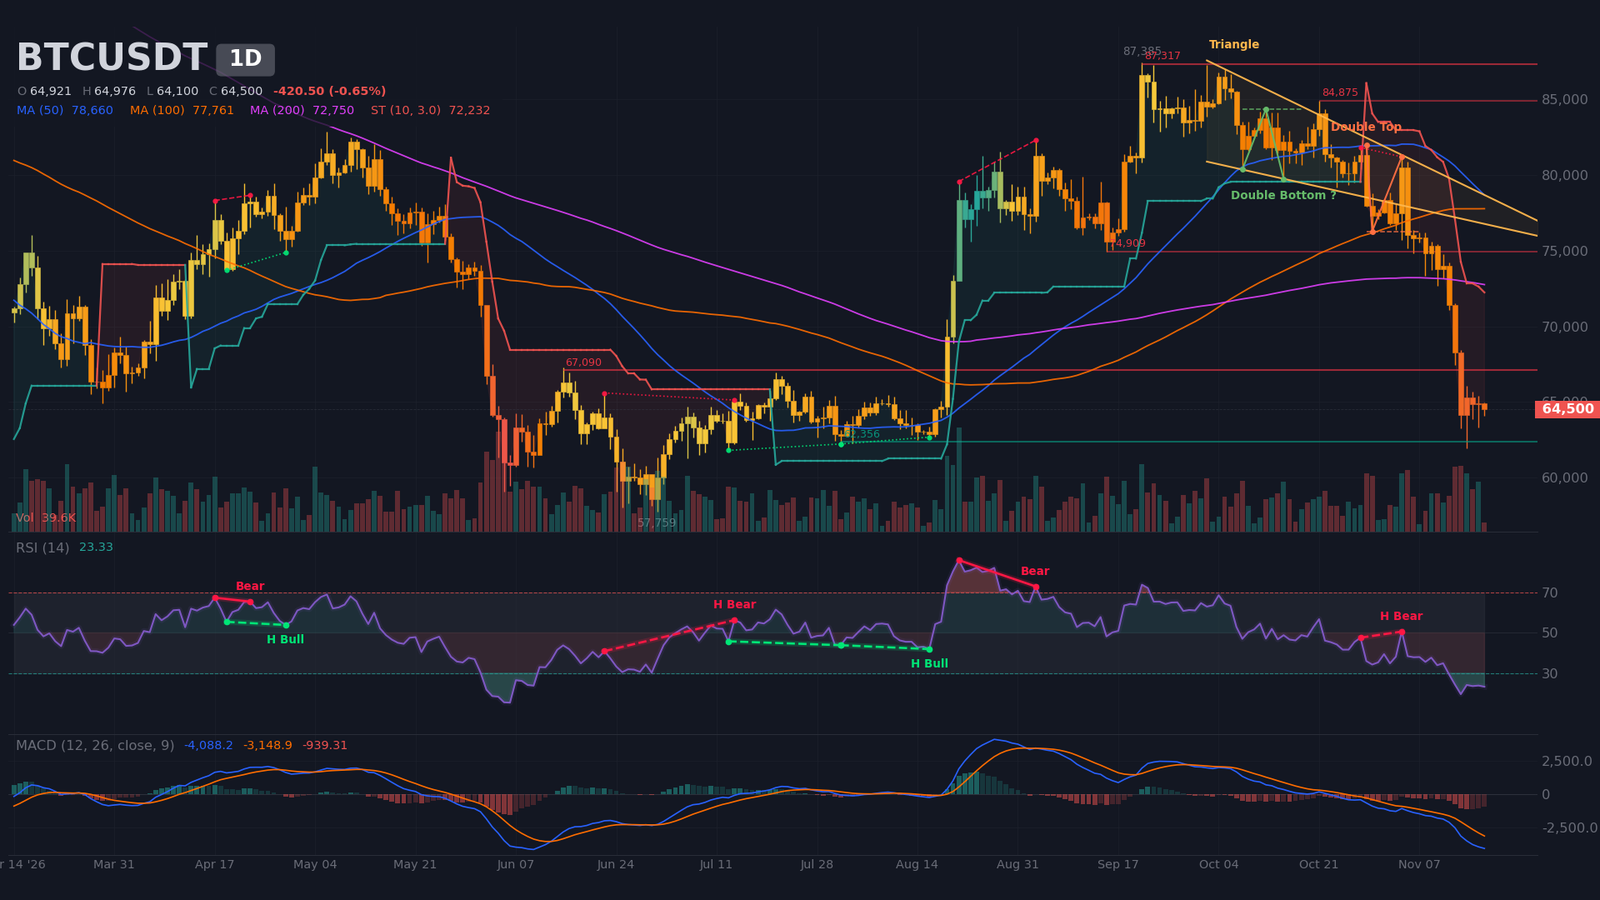
Daily Timeframe (1D): Bearish Trend After a Confirmed Double Top
On the weekly chart, the last full week lost 12.7%. Price is below the 10-week SMA (around $78,090) and the 20-week SMA (around $73,920), with a weekly RSI at 40. This is not a correction within an uptrend but a reversal: the weekly structure is broken, and the bearish run has lasted six weeks.
The daily chart is in an established trend (ADX around 39, with DI- well above DI+), in a late-stage bearish impulse marked by lower highs and lower lows. Price sits below the daily SMA20 (around $72,840), SMA50 (around $78,660) and SMA200 (around $72,750). The bearish double top, with a neckline at $76,270 and a target near $70,970, is confirmed, and its target is far exceeded. The wedge running from October 2 to November 4 has broken to the downside. On the Fibonacci grid, price trades on the 78.6% retracement (around $64,100) of the major impulse, with the current retracement at 77%. The next level is the July 1 low at $57,760, while an intermediate support detected near $62,360 has two contacts. Bollinger Bands are expanding, with a %B of 11: price is hugging the lower band (around $62,270).
RSI, near 23, is oversold and flat for three days, yet no bullish divergence appears on the daily: the November 15 low (RSI around 24) sits below the October 30 low (around 34). A hidden bearish divergence of continuation is detected between October 28 and November 4. MACD remains below zero and below its signal line, with a bearish crossover dated September 29. Volume validates the drop: the full November 17 candle is 129% of its 20-period average, after a 194% peak on November 14, the day of a 6.1% decline. The point of control (around $64,240) coincides with price, and the value area ($58,990 – $78,130) encloses it: a break below $58,990 would accelerate the decline.
The daily picture is clear: the underlying trend is bearish, and the current compression has not yet proven a reversal.
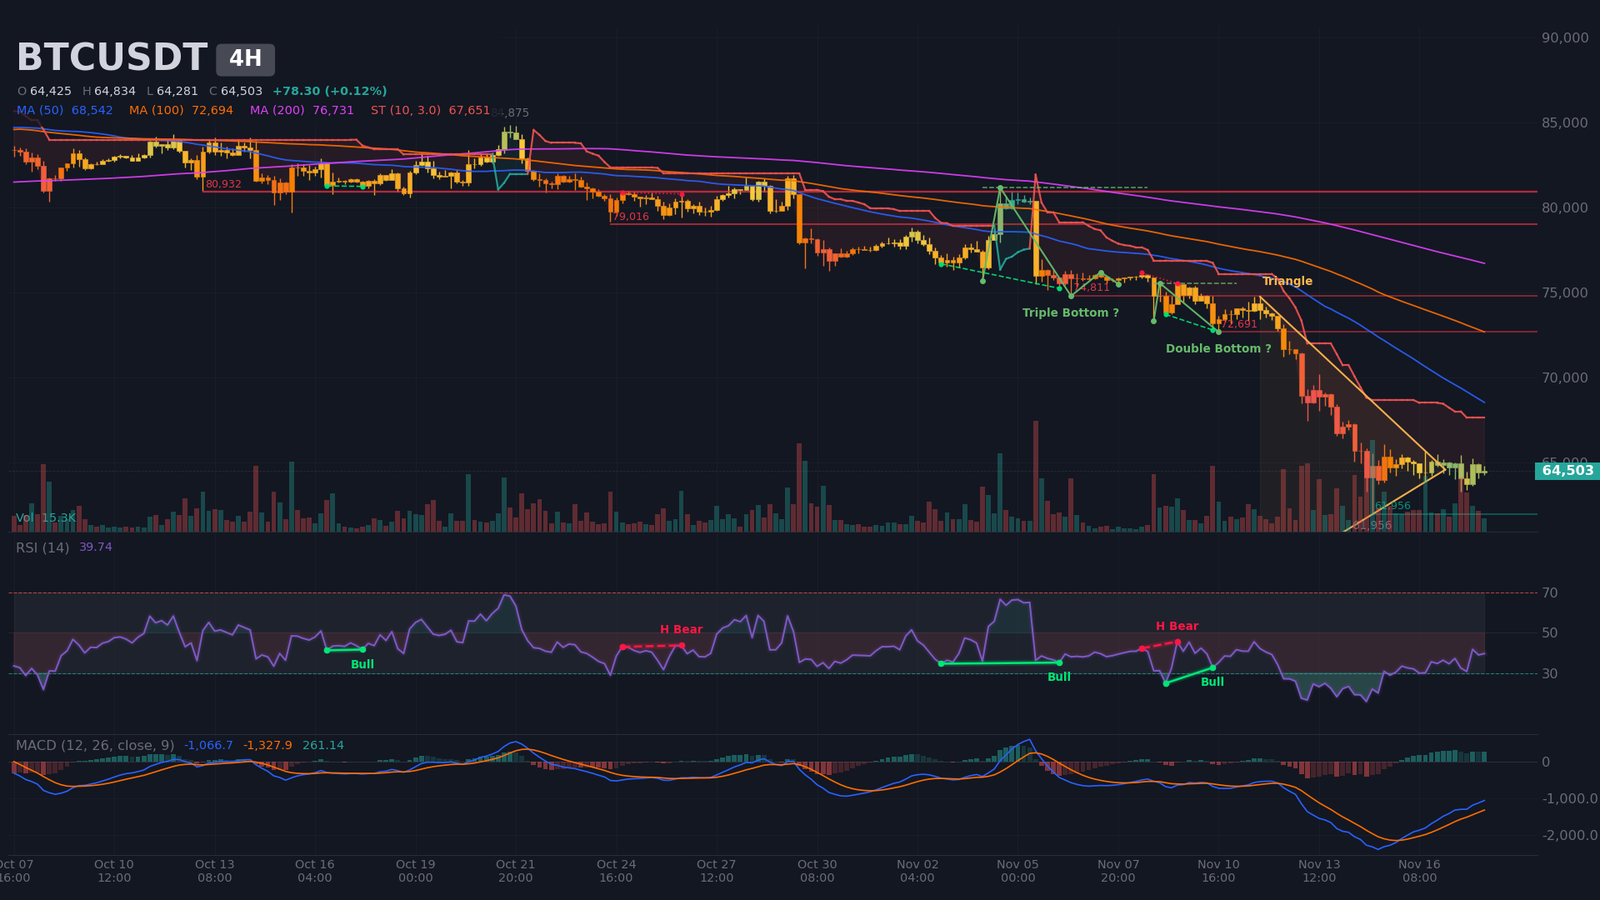
Intermediate Dynamics (4H): Symmetrical Triangle Compression Below the SMA20
The 4-hour chart remains in an established bearish trend (ADX around 51, DI- above DI+), but Bollinger Bands are compressing, at the 13th percentile rank over 120 periods. Price trades inside a symmetrical triangle bounded by $63,870 and $65,680, whose apex estimated on November 17 has already been passed, which weakens its predictive value. Price is below the 4H SMA20 (around $64,710), SMA50 (around $68,540) and SMA200 (around $76,730), and the SuperTrend remains bearish at around $67,650. A close back above the SMA20 is the threshold to reclaim for any rebound.
RSI, near 40, is neutral and flat. The swings show a regular bullish divergence between the November 13 low ($67,450, RSI around 17) and the November 15 low ($61,960, RSI around 22), a reading by the analyst not detected algorithmically. MACD crossed up on November 15 at 20:00 below zero, with a positive histogram: a simple technical rebound. The 4H Fibonacci levels give the rebound resistances: 23.6% of the last leg (from $76,170 on November 8 to $61,960 on November 15) at around $65,310, then 23.6% of the drop from $84,875 (October 21) to $61,956 at around $67,370. Bullish patterns, including a double bottom with a $75,575 neckline, remain unconfirmed and distant.
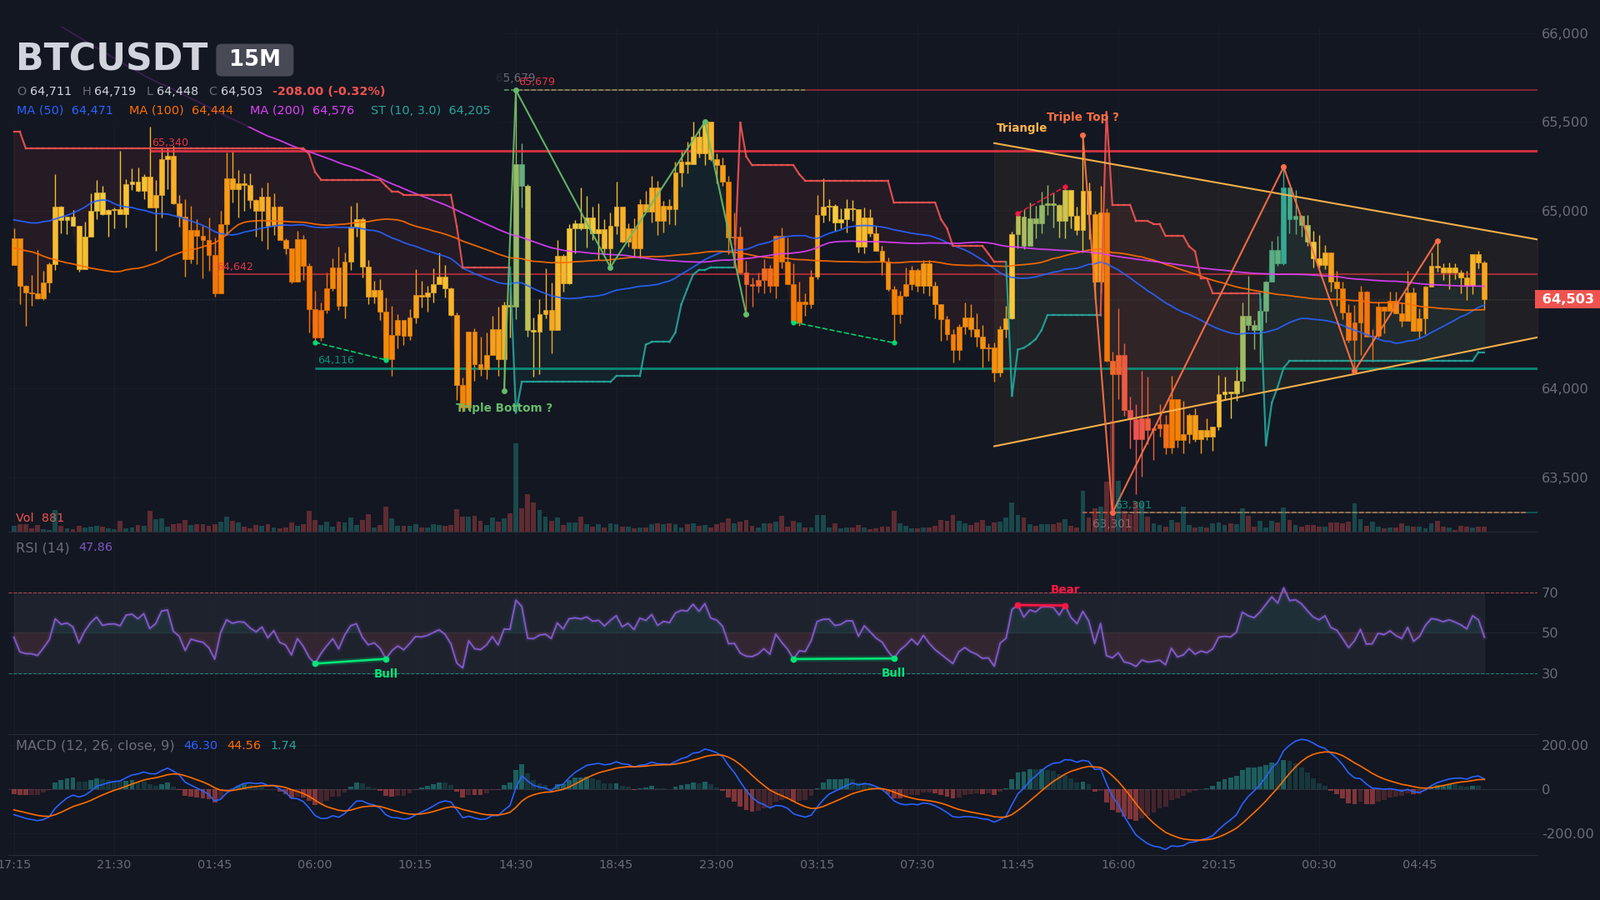
Intraday Structure (15m): Symmetrical Triangle Below Resistance
The 15-minute chart is ranging (ADX around 15, bands compressed, at the 6th percentile rank). The structure is bullish over the very short term, with rising highs and lows, a bullish SuperTrend (around $64,205) and a bullish MACD crossover at 05:15 (Zurich time), above zero. The triangle tightens between about $64,175 and $64,940, with an apex estimated at 20:42 tonight. The decisive boundaries are support at $64,115 (six contacts) and resistance at $65,340 (seven contacts). RSI, near 48, is neutral. This signal runs against the daily chart: it is a short-term trigger, never a change of bias.
Two patterns remain unconfirmed: a bearish triple top (neckline $63,300, target around $61,430) and a bullish triple bottom (neckline $65,680, target around $67,000).
Multi-Timeframe Synthesis
| Timeframe | Dominant trend | RSI (14) | MACD | Chart pattern |
|---|---|---|---|---|
| Daily (1D) | Bearish (reversal) | ~23 (oversold) | Below zero, bearish since September 29 | Confirmed double top, target exceeded |
| 4-hour (4H) | Bearish (compression) | ~40 | Bullish crossover on November 15, below zero | Symmetrical triangle, apex passed |
| 15-minute (15M) | Range with bullish bias | ~48 | Bullish crossover on November 18 | Intraday symmetrical triangle |
Technical Level Map and Pivots
The method combines daily and weekly pivots, Fibonacci retracements (daily and 4H impulses), detected supports and resistances, the volume profile and estimated liquidation pockets. The $64,100–$64,600 pivot zone concentrates the most confluence: the short-term central pivot (around $64,550) coincides with the daily point of control and the 78.6% retracement.
| Level | Price (USD) | Category | Technical basis |
|---|---|---|---|
| Major resistance 3 (R3) | $70,700 – $71,700 | Major (Daily/4H) | 4H Fibonacci 38.2% ($70,710), double top target ($70,970), estimated short pocket ($71,190 – $71,360), Daily Fibonacci 38.2% ($71,670) |
| Major resistance 2 (R2) | $66,700 – $68,000 | Major (Daily/4H) | Daily R2 ($66,670), detected resistance ($67,090, 2 contacts), weekly pivot P ($67,610), 4H Fibonacci 23.6% ($67,370), 4H SuperTrend ($67,650) |
| Immediate resistance (R1) | $65,300 – $65,800 | Immediate | Recent 4H Fibonacci 23.6% ($65,310), daily R1 ($65,800), 15m resistance ($65,340, 7 contacts) |
| Central pivot (P) | $64,100 – $64,600 | Pivot | Daily pivot ($64,550), daily point of control ($64,240), Fibonacci 78.6% ($64,100), buy wall ($64,415) |
| Immediate support (S1) | $63,300 – $63,700 | Immediate | Daily S1 ($63,670), buy wall ($63,535), November 17 low ($63,300) |
| Major support 2 (S2) | $61,950 – $62,750 | Major (Daily) | November 15 low ($61,956), detected support ($62,360), daily S2 ($62,425), estimated long pocket ($62,570 – $62,740), lower daily Bollinger band ($62,270) |
| Major support 3 (S3) | $58,700 – $59,700 | Major (Daily/weekly) | Estimated long pockets ($58,700 – $59,400), weekly pivot S1 ($59,650), $58,000 psychological zone cited by Mark Yusko (Bitcoin Magazine, November 17) |
Order Book and Liquidity Heatmap
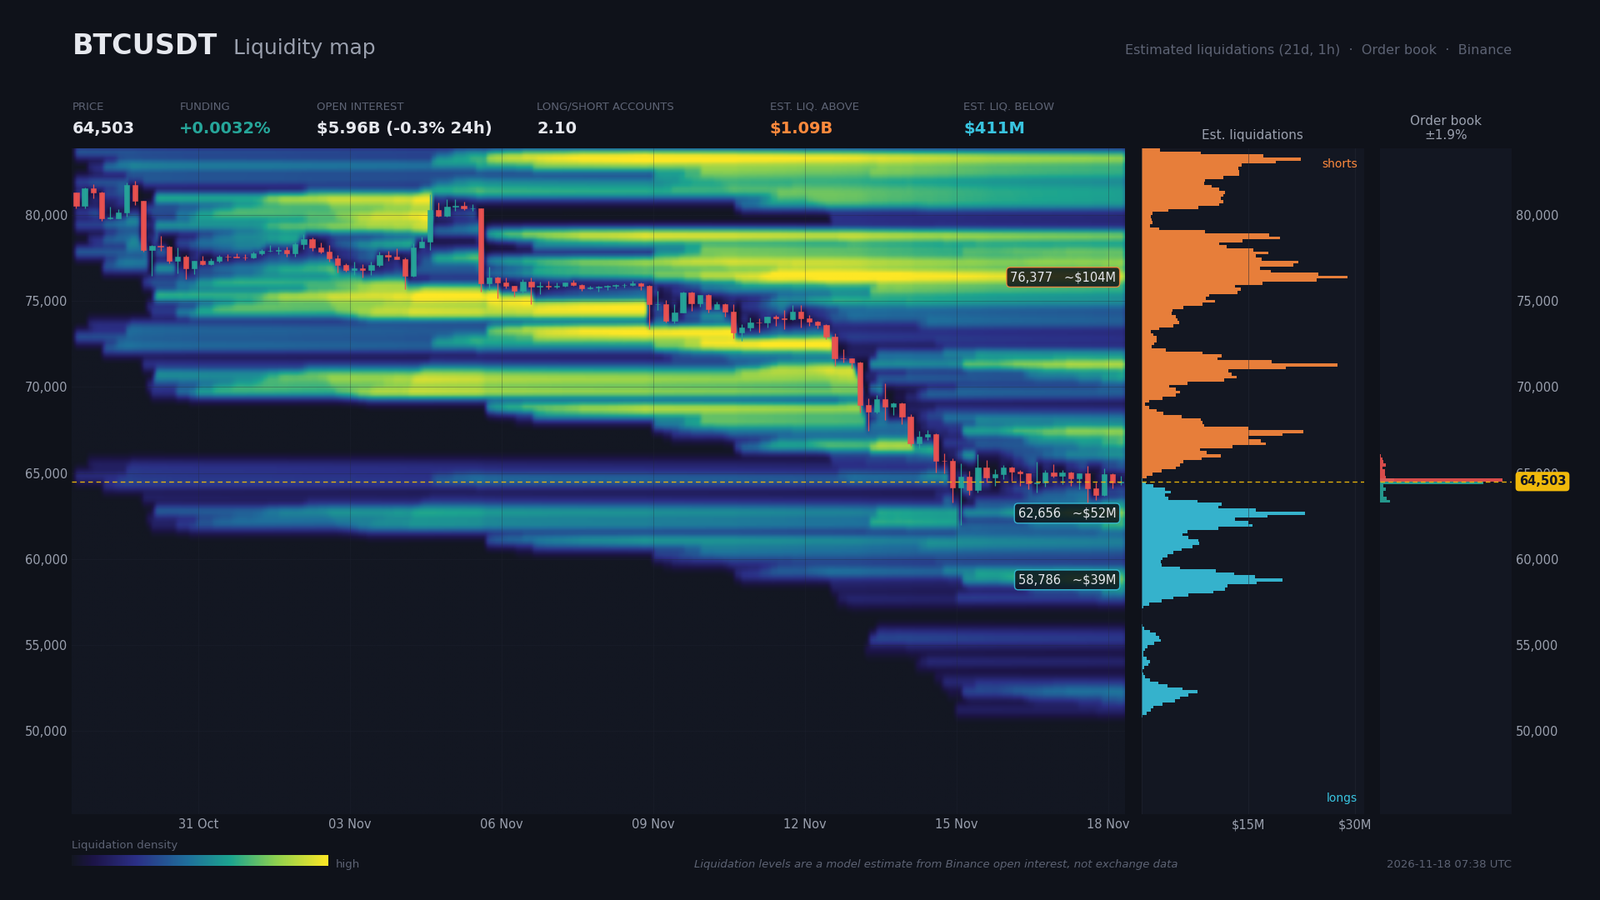
Visible order book coverage reaches only 1.9% around price, so the reading is local. A $51.1M sell wall sits at $64,590, 0.14% above price, facing a $43.2M buy wall at $64,415, 0.14% below, with an almost neutral imbalance. Further walls are modest ($1.8M to $4.2M): $63,360 and $63,540 on the bid side, $65,120 and $65,470 on the ask side. This pair of large walls brackets price and explains the compression on the 15-minute chart.
Estimated liquidation zones (model-based, not measured) are asymmetric: about $1.09B above price against about $411M below. Above, the pockets sit at $71,190 – $71,360 (~$61M), $76,110 – $76,820 (~$104M) and $82,970 – $83,500 (~$67M). Below, they sit at $62,570 – $62,740 (~$52M), $59,050 – $59,400 (~$30M) and $58,700 – $58,870 (~$39M). The $62,650 pocket is the closest and densest on the downside, a plausible magnet before any durable rebound.
Funding is slightly positive (0.0032%, roughly 3.5% annualized) and open interest stands at about $5.96B, down 19.2% over seven days. The long/short ratio still favors longs (2.10 for accounts, 1.85 for top traders), while the taker ratio is neutral (0.99). Long positions remain numerous, so a sweep toward $62,650 is plausible. Conversely, the estimated stock of shorts above provides the fuel for a possible squeeze toward $71,000 if the $67,000 – $68,000 zone gives way.
Calendar: Catalysts to Watch
No Deribit options expiry or CME settlement appears in the calendar provided. The high-impact events are listed below, in Zurich time.
- Wed. November 18, 20:00 (Zurich) — FOMC minutes (no consensus): a tone favorable to a December hike could trigger rapid volatility.
- Fri. November 20, 00:30 (Zurich) — Japan core inflation (consensus 2.3%, prior 2.1%): an upside surprise would strengthen the yen and unwind risk positions.
- Fri. November 20, 14:25 (Zurich) — Waller speech (FOMC): a further signal on the option of a 50-basis-point hike.
- Wed. November 25, 14:30 (Zurich) — core PCE m/m (consensus 0.3%, prior 0.4%) and preliminary GDP q/q (consensus 3.4%, prior 6.4%): the event most likely to pull price out of its compression.
Three Scenarios for the Coming Weeks
Three paths stand out over a one-to-two-week horizon. The probabilities are the analyst’s and total 100%.
Scenario A — Rejected Rebound Then Renewed Decline (probability 45%)
This remains the most likely path, since the daily and 4H charts are aligned, with ADX near 39 and 51 respectively and DI- dominant, below the SMAs and the weekly averages. The trigger is a rejection on the 4H chart under $65,300 – $65,800 (4H Fibonacci 23.6% and daily R1), possibly after tonight’s FOMC minutes. The path leads toward $62,570 – $62,750 (estimated long pocket and daily S2), then, on a daily close below $61,950, toward $58,700 – $59,700. Accounts’ long positioning (ratio of 2.10) leaves material to liquidate. The risk/reward ratio (R:R) toward $62,650 is about 1.64, and about 3.6 toward the second target (around $59,100). Execution zone: sell near $65,600. Invalidation: 4H close above $67,400, implying $1,800 of risk, above the 4H ATR (around $1,200).
Scenario B — Liquidity Sweep Then Range $62,000 – $67,000 (probability 35%)
The capitulation signs documented by Glassnode, the 4H divergence on the swings and near-zero funding favor a technical floor. The trigger is a wick into the $62,570 – $62,750 pocket, followed by a 4H recovery above $63,700 (daily S1). The path leads to the point of control ($64,240), then to $67,090 (resistance with two contacts, 4H Fibonacci at $67,370). R:R comes to about 1.67 (3,000 ÷ 1,800). Execution zone: buy near $64,100. Invalidation: 4H close below $62,300 (detected support at $62,360), implying $1,800 of risk.
Scenario C — Bullish Reversal and Thesis Invalidation (probability 20%)
The trigger is a daily close above $72,800 (daily SMA20 and SMA200, major 50% Fibonacci), preceded by a recovery into $70,700 – $71,700 that would liquidate the short pocket. The path targets $76,100 – $76,800 (estimated short pocket of about $104M, major 38.2% Fibonacci at $76,070, volume node at $77,200). Execution zone: buy above $72,900. Invalidation: 4H close below $70,700 (4H Fibonacci 38.2%).
The signal to watch: a 4H close above $67,400 would shift scenario A toward B; it would only become C with a daily close above $72,800. A daily close below $61,950 would confirm A.
Synthesis and Conclusion
The current phase is a late-stage bearish impulse that has already reached its chart target. Documented capitulation and the purge of open interest reduce the risk of immediate further extension, but the weekly trend is broken and a restrictive macro backdrop, with 10-year yields near 5.1%, does not yet support a reversal. ETF inflows of $7.9M after seven sessions of outflows look like the beginning of stabilization, not confirmation.
The dominant technical strategy is to sell rebounds into $65,300 – $68,000, or to wait for a sweep of $62,000 – $62,750 for a tactical buy, with 4H protection above $67,400 for the short side and below $62,300 for the long side. Key levels: $67,000 – $68,000 (rebound frontier), $64,100 – $64,600 (pivot zone), $61,950 – $62,750 (major support and estimated liquidation pocket), $58,700 – $59,700 (next bearish target) and $72,800 (daily invalidation of the thesis).
Sources
- Bitcoin Price Slips Below $64,000 as Strategy (MSTR) Falls Below $100 — Bitcoin Magazine, Nov. 17, 2026, 22:02
- Bitcoin Investors Are Capitulating—That’s Historically Been a Bottom Signal — Decrypt, Nov. 17, 2026, 21:36
- Mark Yusko: Why Bitcoin Is Falling — $58k Is the Key Level to Watch — Bitcoin Magazine, Nov. 17, 2026, 21:30
- Wall Street Bought $4.2B of Bitcoin in Q3 — Bitcoin Magazine, Nov. 17, 2026, 20:35
- Treasury prices catch a small bid as stock market weakens and Warsh says AI might ‘disappoint’ — CNBC, Nov. 16, 2026
- Warsh Says Fed Is Gaming Out How AI Could Reshape Economy — WSJ, Nov. 16, 2026 (date indicated by the search engine)
- Opening Remarks, Productivity and Jobs Task Force Conference — federalreserve.gov, Nov. 16, 2026
- Want to Earn 5% on Shorter-Term Treasurys Again? Watch for This Shift. — MarketWatch, Nov. 17, 2026, 23:08
- $26 Billion Bitcoin ETFs Selloff Wipes Out Every 2026 Inflow — BeInCrypto, Nov. 5, 2026 (date indicated by the search engine)
- CFTC backs blockchain-based derivatives infrastructure as Backpack, tZERO win approvals — The Block, Nov. 17, 2026, 00:27
Disclaimer: This article is for educational and informational purposes only. It does not constitute investment advice, a recommendation to buy or sell, or an invitation to trade any financial asset. Cryptocurrency markets are extremely volatile; any investment decision should be based on your own research (DYOR) and, where appropriate, the advice of a licensed financial adviser.

