


- Price extends a bearish impulse into capitulation and stabilizes on a support cluster before a relief rebound.
- Driver: $2.35B of spot ETF outflows over two weeks, a dollar at a 19-month high and a 25 basis point hike priced in.
- To watch: Warsh’s speech on November 16, then an M15 close above $65,565 as the first sign of a rebound.
Bitcoin is going through one of the sharpest weak phases of the autumn. Price trades at $63,937 on November 15, 26.8% below the $87,385 peak reached on September 21. The recent low of $61,956, set the same day, was followed by a 3.2% bounce, yet the week is down 14.55% after five consecutive weekly declines. The period low of $57,759 from July 1 now serves as the yardstick for measuring the size of the sell-off.
The dominant driver remains institutional flows. According to The Block and Cointelegraph (November 14), US spot ETFs recorded $1.07B of outflows last week after $1.28B the week before, for $2.35B over two weeks, the heaviest two-week total since late June. The two sources disagree on the seven-session selling streak, counted at $1.91B by The Block and $1.71B by Cointelegraph (Farside). IBIT, BlackRock’s fund, accounts for nearly 90% of November’s outflows, including $143.5M withdrawn on Friday alone. Mechanically, marginal institutional demand is absent on the downside.
The macro backdrop feeds that pressure. Bitcoin Magazine (November 14) attributes the drop to a dollar at its highest level in 19 months and a 10-year yield climbing to 5.15%. A 25 basis point hike at the December 8-9 Fed meeting is now fully priced in, according to CME FedWatch, and remarks from Collins and Daly point the same way. Core CPI, released on November 10, surprised at 0.3% versus 0.2% expected, while core PPI on November 13 came in at 0.3% against 0.4% expected, with headline PPI still at 6.5% year on year. Jensen Huang’s resignation at Nvidia, on November 12, also weighed on risk appetite, according to CNBC (November 14). On the other side, mining difficulty fell 9.13% on November 14, its sharpest drop since June, a sign of stress on miners.
On the regulatory front, the SEC proposal on crypto asset custody (S7-2026-35, published in the Federal Register on October 6, with a 60-day comment period) and the final approval of Coinbase’s national trust charter, reported by Cointelegraph on November 13, are structurally positive, with no price effect over the horizon of this note. MarketWatch (November 13) also raises the possibility that investors rotate into the Anthropic IPO, an inference that remains unconfirmed. On-chain data and whale behavior are not available for this analysis. The context supports the bearish technical signal, with one caveat: extreme oversold conditions argue for a relief rally without a confirmed reversal. That tension between a late selling impulse and partial exhaustion frames the technical analysis that follows.
Multi-Timeframe Technical Analysis
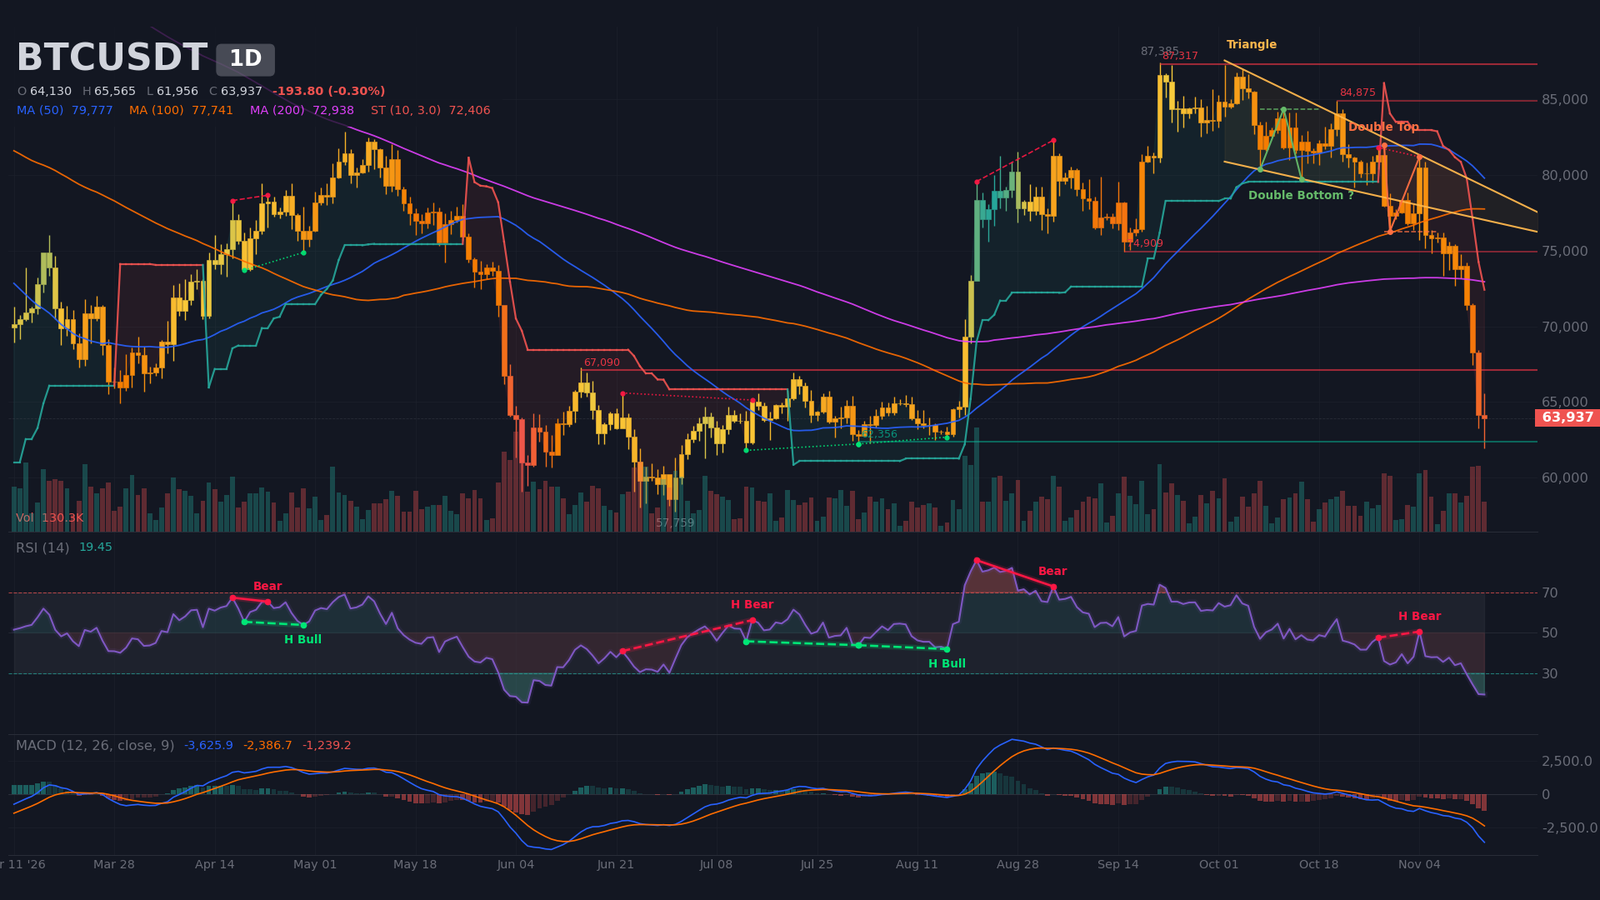
Daily Timeframe (1D): extended bearish impulse, double top confirmed
The weekly context points to a reversal rather than a simple correction. Price sits below the weekly SMA10 ($79,185) and SMA20 ($73,812), the weekly RSI reads ~39, and five bearish weeks have chained together. On the daily chart, structure is bearish, with lower highs and lower lows and a close below the last swing low at $76,270. The phase looks like distribution followed by a selling impulse, in a trending regime confirmed by an ADX of 32, with the DI- clearly dominating the DI+.
Price trades below the SMA20 ($75,070), SMA50 ($79,780) and SMA200 ($72,940), and no 50/200 cross has been dated. The double top, formed between October 2 and 5 and again on November 4, is confirmed: its neckline sits at $76,270 and its target at $70,969 has already been exceeded by about $7,000, so the pattern no longer carries much weight on its own. The SuperTrend remains bearish at $72,406. On Fibonacci retracement, the decline of the major impulse, from the $57,759 low on July 1 to the $87,385 high on September 21, brings price to the 78.6% retracement at $64,099, within 0.25%. A hidden bearish divergence from October 28 to November 4 had already confirmed the continuation.
Oscillators show the scale of the pressure. The RSI (relative strength index) reads ~19, oversold and flat over the latest session after a rapid drop. The MACD sits below its signal line and below zero, with a bearish crossover dated September 29 and a deep negative histogram. Volume on the last complete daily candle, November 14, reached 1.94 times its 20-day average, the highest of the past 40 sessions, for a 6.1% decline. That suggests capitulation without a confirmed reversal, especially since the provisional candle of the day sits at only 83% of average volume. Price is inside the daily value area ($60,230 – $78,740), right at the volume profile point of control at $64,240.
Intermediate Dynamics (4H): extreme oversold, mixed structure
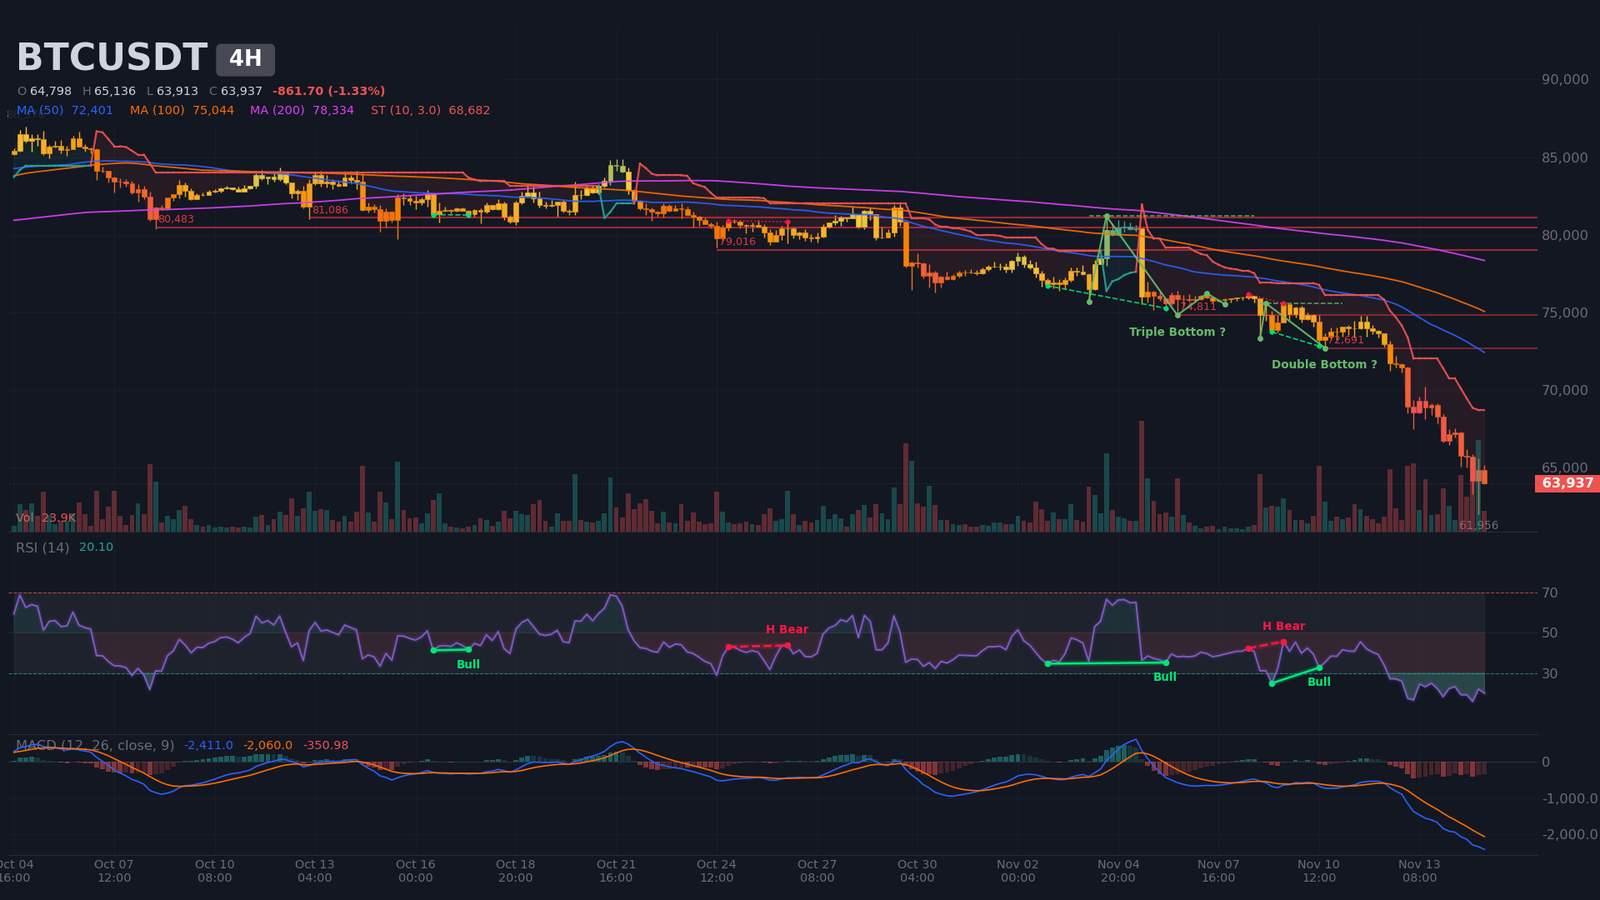
An ADX of 65 and Bollinger Bands at their maximum width describe a very stretched trending regime. The SuperTrend is bearish at $68,680, price trades below the SMA20 ($68,670), SMA50 ($72,400) and SMA200 ($78,330), and the MACD stays below zero after a bearish crossover on November 12. The RSI reads ~20. Highs are declining, lows are irregular, and the last swing low at $67,449 has been broken on a close. The regular bullish divergences of November 9 and 10 were invalidated by the new lows, while the double and triple bottoms detected, with necklines at $75,575 and $81,188, remain unconfirmed.
On Fibonacci, the impulse from November 5 ($80,629) to November 15 ($61,956) gives $66,363 at the 23.6% retracement and $69,089 at 38.2%. The 00:00 H4 candle, at 2.77 times average volume, printed the $61,956 low before rejecting toward $65,565. That suggests partial absorption, which still needs confirmation. Price is trading below the H4 value area and remains exposed to moves without solid support.
Intraday Structure (15m): ascending triangle broken to the downside
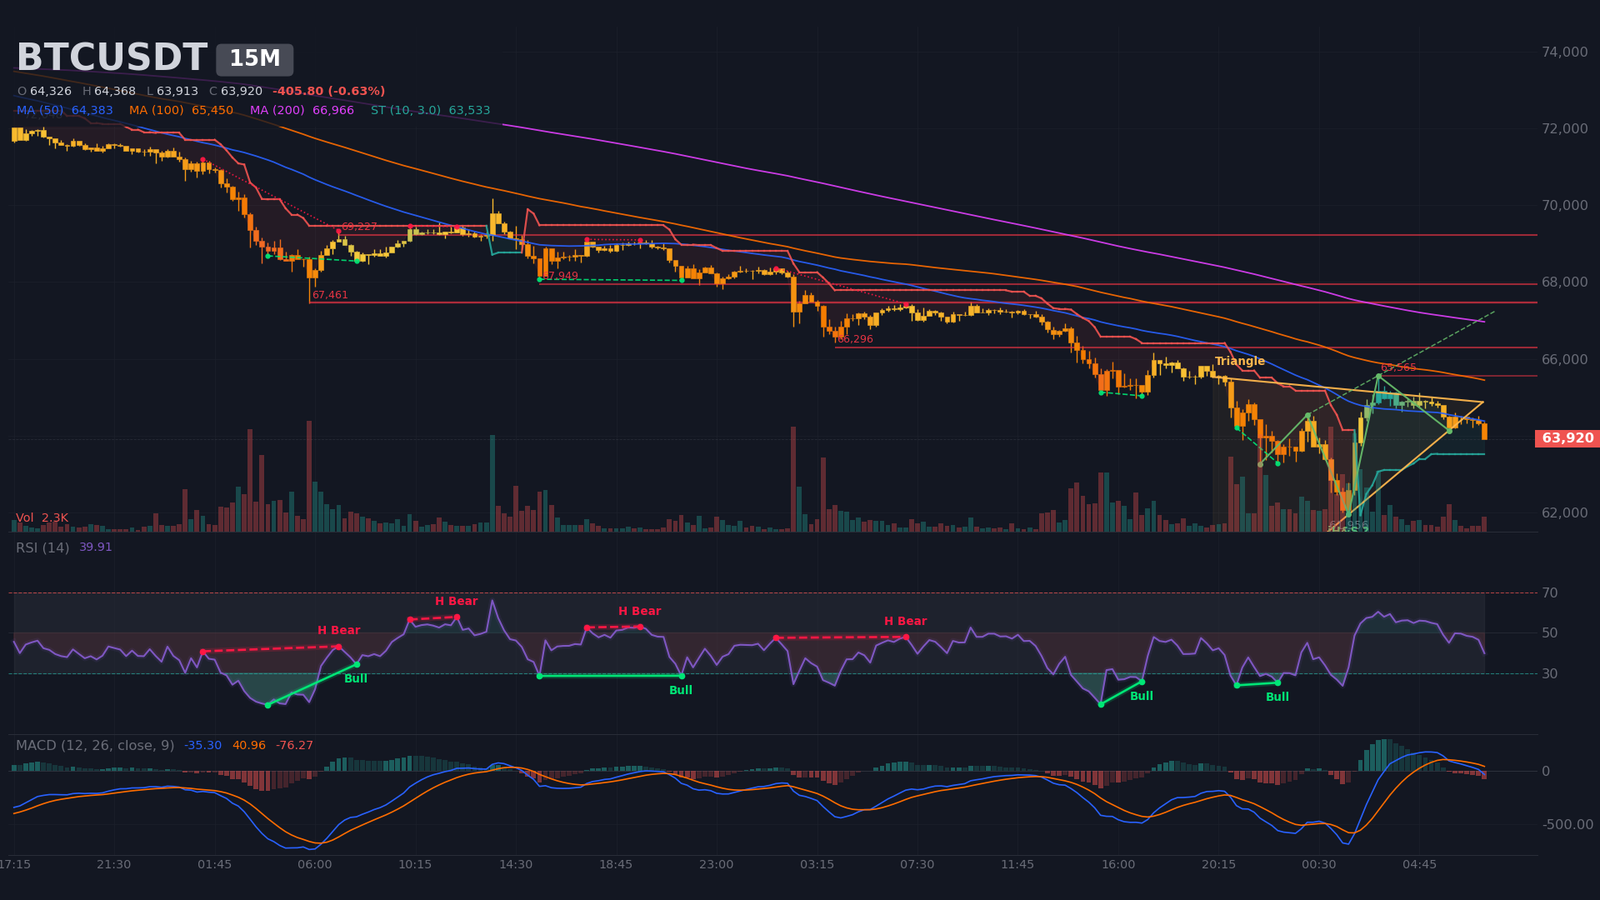
The regime is a range, with an ADX of 17, ordinary band width and the DI- dominating. The ascending triangle, spanning $64,140 to $64,960, has just given way: price trades at $63,920, below its lower boundary, after closing beneath the last swing low at $64,141. The breakdown still needs confirmation on the close of the running candle. The RSI, at ~40 and falling, and the MACD, which crossed down at 06:00, confirm the short-term bearish bias. The M15 SuperTrend, the only bullish signal left, sits at $63,533.
The inverse head and shoulders, with a neckline at $65,565 and a target at $69,767, remains an unconfirmed hypothesis, especially since the triangle that carried it has broken. The boundaries of the intraday structure are $61,956 and $65,565, the November 15 low and high. The short-term bullish trigger is an M15 close above $65,565, while a close below $63,530 opens a test of $62,360. These signals are triggers only: they do not change the daily bias.
Multi-Timeframe Summary
| Timeframe | Dominant trend | RSI (14) | MACD | Chart pattern |
|---|---|---|---|---|
| Daily (1D) | Bearish (extended impulse) | ~19 (oversold) | Below signal and below zero, bearish crossover on September 29 | Double top confirmed, target reached |
| 4 hours (4H) | Bearish (extreme oversold) | ~20 (oversold) | Below signal and below zero, bearish crossover on November 12 | None confirmed (double and triple bottoms unconfirmed) |
| 15 minutes | Range with bearish bias | ~40 | Bearish crossover on November 15 | Ascending triangle broken to the downside |
Level Map: Technical Levels and Pivots
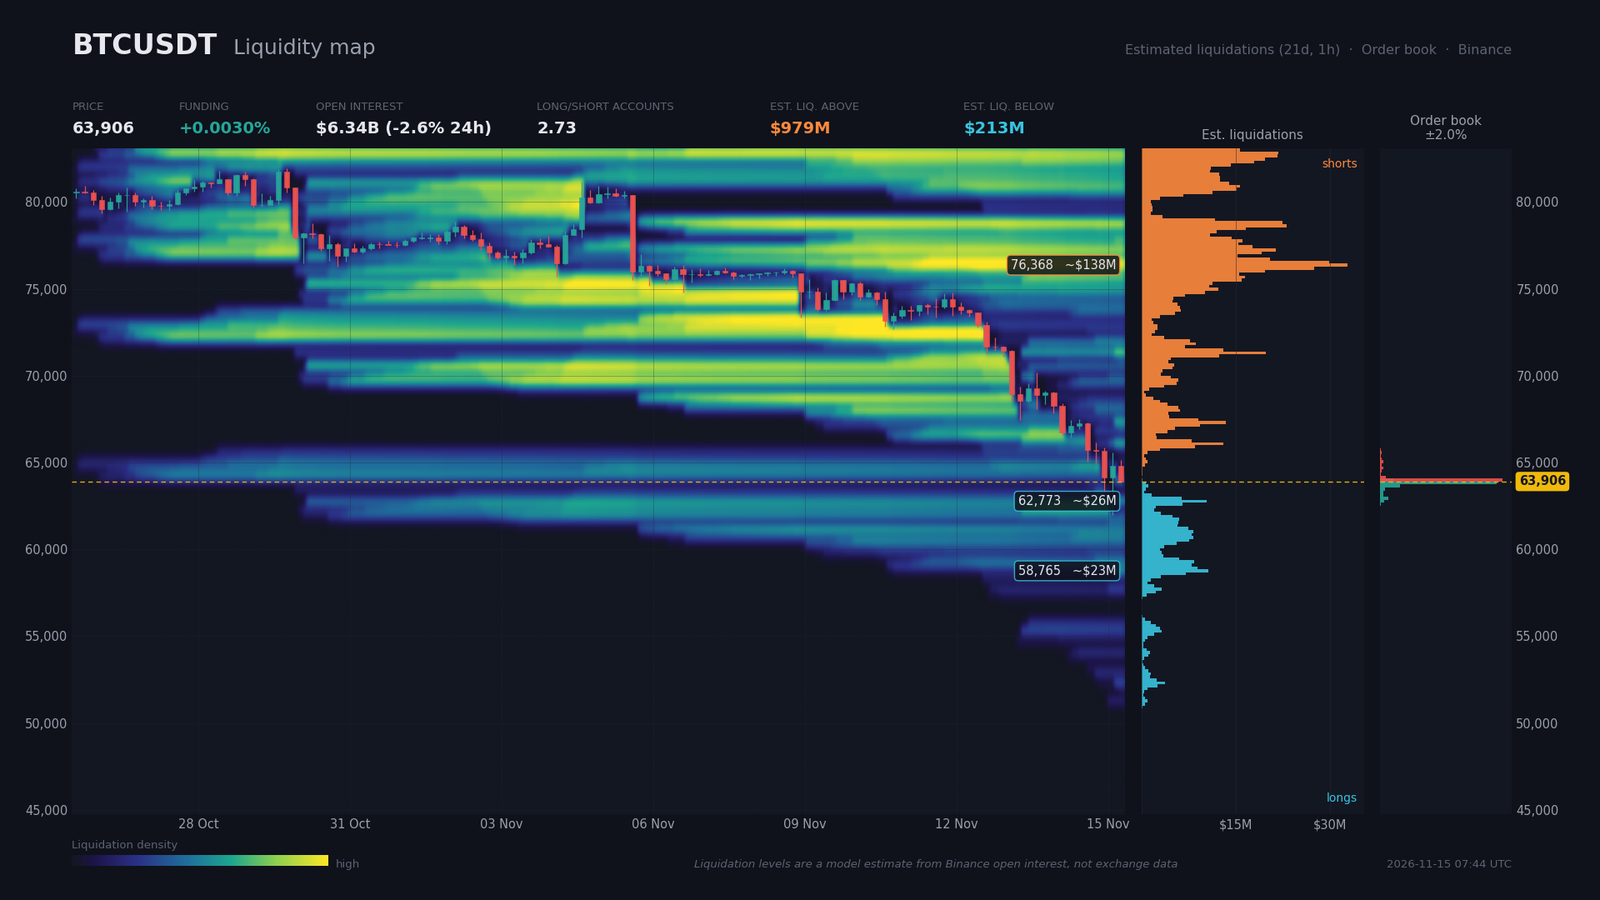
The map overlays daily and weekly pivots, Fibonacci retracements of the Daily and H4 impulses, the volume profile and estimated liquidation zones. The short-term pivot zone, between $63,850 and $64,350, is the node where price is currently trading. It is where the 78.6% retracement ($64,099), the point of control ($64,239), the weekly S3 pivot ($63,853) and the buy wall in the order book ($63,819) converge. The denser the overlap, the more weight the level carries.
| Level | Price (USD) | Category | Technical basis |
|---|---|---|---|
| Major resistance 3 (R3) | $70,200 – $71,000 | Major resistance | Daily R2 pivot ($70,422), double top target ($70,969), H4 high of November 13 ($70,188) |
| Major resistance 2 (R2) | $66,300 – $67,300 | Major resistance | R1 pivot ($67,277), daily resistance with 2 touches ($67,090), H4 Fibonacci 23.6% ($66,363), M15 resistance ($66,296) |
| Immediate resistance (R1) | $65,250 – $65,600 | Resistance | Daily P pivot ($65,274), M15 neckline and November 15 high ($65,565) |
| Central pivot (P) | $63,850 – $64,350 | Short-term pivot | Fibonacci 78.6% ($64,099), point of control ($64,239), weekly S3 pivot ($63,853), buy wall ($63,819) |
| Immediate support (S1) | $61,950 – $62,800 | Support | S1 pivot ($62,128), daily support with 2 touches ($62,357), November 15 low ($61,956), estimated long liquidation pocket ($62,773) |
| Major support 2 (S2) | $60,100 – $60,250 | Major support | S2 pivot ($60,125), bottom of the value area ($60,228) |
| Major support 3 (S3) | $56,980 – $57,760 | Major support | S3 pivot ($56,979), July 1 low ($57,759) |
Order Book and Liquidity Heatmap
Order book coverage is only 1.98% around the price, which limits the reading to the closest walls. A sell wall of $45.7M sits at $63,993 (+0.14%), a weak resistance since no large wall follows above it. Facing it, a buy wall of $43.7M sits at $63,819 (-0.14%), followed by $7.3M at $63,645. Bids within 2% ($64.8M) slightly exceed asks ($51.2M), an 11.8% imbalance in favor of buyers, but this is largely a cosmetic balance around the price.
Estimated liquidation zones are highly asymmetric. Above the price, shorts are estimated at $138M near $76,370 (+19.5%), $117M near $77,240 and $121M near $82,820, for a total of roughly $979M. Below, longs are estimated at $26M near $62,770 (-1.8%), $20M near $59,290 and $23M near $58,770, or about $213M. This is a model-based estimate, not a measured figure. The pocket near $62,770 acts as a short-term magnet, with a liquidity sweep likely, while the short pockets above, too distant, outline a target in the event of a short squeeze.
On the derivatives side, funding at 0.003% (3.2% annualized) is neutral, and open interest of $6.3B fell 2.6% over 24 hours and 12.9% over seven days, a sign of leverage being reduced rather than positions being rebuilt. The account long/short ratio (2.73) remains strongly skewed toward buyers, large traders (1.84) are more balanced and the taker buy/sell ratio (0.945) reflects selling aggression. Retail positioning still leaning long after such a drop raises the risk of another sweep below $62,400.
Calendar: Catalysts to Watch
The calendar is dense this week. Releases already out have weighed on the market, and the event most likely to pull price out of its current structure remains Warsh’s speech. No Deribit or CME expiry is listed in the window reviewed.
- Monday, November 16, 03:00 (Zurich): China, industrial production (consensus 5.3%, previous 5.5%) and retail sales (consensus 0.8%, previous 1.1%). At stake: risk appetite at the open of the week.
- Monday, November 16, 18:00 (Zurich): speech by Fed Chair Warsh. A firm tone would confirm the December hike, while a nuance would be the only possible relief for risk assets.
- Tuesday, November 17, 14:30 (Zurich): US core retail sales (consensus 0.4%, previous 0.9%). An upside surprise would strengthen yields and weigh on price.
- Tuesday, November 17, evening (Zurich): Nvidia earnings under CEO Colette Kress, time not specified (CNBC). They serve as a test for risk assets.
Three Scenarios for the Coming Weeks
The probabilities below, set by the analyst, add up to 100%. They rest on a shared reading: oversold conditions argue for a rebound, but the structure stays bearish as long as $71,000 does not give way.
Scenario A — Relief rally rejected, decline resumes (probability 50%)
The central scenario unfolds if price climbs toward $66,300 – $67,300 and is rejected on an H4 close, with the catalyst being Warsh’s speech on November 16 at 18:00 or the retail sales release on November 17 at 14:30. The path leads first to $62,400 (S1), then to $60,100 – $60,250 (S2), and finally to $57,760 if the move accelerates. A confluence score of 4/5 (daily ADX at 32, H4 ADX at 65, ETF outflows, high yields) supports the bias, but extreme oversold conditions and neutral funding cap conviction. The R:R is 3.5: entry at $66,800, target at $60,150, invalidation at $68,700, or ($66,800 – $60,150) ÷ ($68,700 – $66,800). Toward S1 at $62,400, it comes to 2.3. Execution zone: sell near $66,800. Invalidation: H4 close above $68,700 (H4 SuperTrend at $68,682, or $1,900 of risk, above the H4 ATR of $1,472).
Scenario B — Liquidity sweep then range rebound (probability 30%)
This scenario assumes a wick below $62,360 – $62,770, inside the estimated long pocket, followed by a recovery above $62,800 on an H4 close. Price would then return to the pivot zone and aim for $66,300, the lower edge of resistance R2. The R:R is 1.75: entry at $63,500, target at $66,300, invalidation at $61,900, or ($66,300 – $63,500) ÷ ($63,500 – $61,900). Execution zone: buy near $63,500, close to the $63,645 buy wall and the weekly S3 pivot. Invalidation: H4 close below $61,900, the November 15 low, for $1,600 of risk.
Scenario C — V-shaped reversal and squeeze, thesis invalidation (probability 20%)
The trigger is a daily close above $67,300, supported by Nvidia’s results on the evening of November 17 and easing yields. The path targets $70,200 – $71,000 (R3), then $72,400 – $73,000, the zone of the daily SMA200 at $72,940. A broader squeeze would aim at short liquidations estimated near $76,000, to be confirmed. The R:R is 1.9: entry at $67,500, target at $70,600, invalidation at $65,900. Execution zone: buy near $67,500 on a retest. Invalidation: H4 close below $65,900, for $1,600 of risk.
The signal to watch: the switch from one scenario to another hinges on two levels. A wick below $62,360 reclaimed on an H4 close would tilt toward scenario B, while a sustained H4 close above $65,600 with volume would open the door to scenario C.
Synthesis and Conclusion
The current phase is a late selling impulse, fed by rising yields, a strong dollar and outflows from ETFs, with IBIT absorbing most of the redemptions. Flows confirm no floor: as long as outflows persist, rebounds remain pauses. By contrast, daily volume at 1.94 times its average, falling open interest and a recent unprecedented oversold reading point to partial exhaustion, which favors a bounce before any further decline. The critical levels are $63,850 – $64,350 (short-term pivot), $61,950 – $62,800 (support and estimated liquidation pocket), $66,300 – $67,300 (expected rejection zone), $71,000 (daily invalidation of the thesis) and $60,100 – $60,250 (scenario A target).
The dominant technical strategy is to sell rallies in the $66,300 – $67,300 zone, with protection above $68,700 on an H4 close, and to avoid chasing the decline below $62,400. This reading remains conditional on Warsh’s speech and Nvidia’s results: the hierarchy of signals can shift within hours.
Sources
- Bitcoin ETFs lose $1 billion for the second week in a row as crypto funds, except one, continue bleeding — The Block, 14/11/2026
- Bitcoin Price Falls 14% In A Week To Fresh Lows Near $65,000 — Bitcoin Magazine, 14/11/2026
- Bitcoin ETFs Lose $2.35B as BlackRock Outflows Hit 11 Sessions — Cointelegraph, 14/11/2026
- Nvidia’s leadership crisis rattles the AI trade — CNBC, 14/11/2026
- Bitcoin could fall even further if investors cash out to buy into the Anthropic IPO — MarketWatch, 13/11/2026
- US regulators move ahead on crypto trust charters as Senate scrutiny grows — Cointelegraph, 13/11/2026
- SEC proposes crypto custody rules allowing self-custody and state trust companies — Crypto Briefing, 01/10/2026
- SEC proposes crypto asset custody framework for investment advisers and regulated funds — A&O Shearman, 15/10/2026
- Economic and crypto calendar (Zurich time) — calendar provided, 15/11/2026
Disclaimer: This article is for educational and informational purposes only. It does not constitute investment advice, a recommendation to buy or sell, or an invitation to trade any financial asset. Cryptocurrency markets are extremely volatile; any investment decision should be based on your own research (DYOR) and, where appropriate, the advice of a licensed financial adviser.

