


Bitcoin trades near $73,900 on November 9, 2026, barely above its 200-day simple moving average (SMA200, around $73,200). The period high of $87,250, reached on October 2, sits roughly 15% above the market, while the recent intraday low of $73,333, printed on November 8 at 21:45, has become the immediate reference point. The market has left the $81,000 to $87,000 distribution range and entered a bearish impulse phase.
The dominant driver is the wave of liquidations on November 9. According to Cryptoast (November 9, Coinglass data), more than $1 billion in positions were wiped out over 24 hours, hitting 154,606 traders, including about $280M on Bitcoin alone, with more than 90% of them long positions. CryptoPotato notes a low at $73,500 and an ‘Extreme Fear’ sentiment reading for the first time in three months. The shock follows the late-October Binance hack, which CoinDesk (November 2) put at $6.3B and Cointelegraph (November 8) attributes to North Korea.
The underlying market is fragile too. Spot Bitcoin ETFs logged $643M of outflows on October 30 (CoinDesk, November 2), then $1.28B over the week, the worst since June, which pushed their cumulative 2026 flows into negative territory (The Block, November 7). IBIT alone accounted for 98% of Friday’s outflows, or $403M. On the macro side, October nonfarm payrolls came in at 165,000 against 65,000 expected, with unemployment at 4.1%. That upside surprise weighed on the asset: the November 6 candle fell 0.3% and closed at $75,800. Cryptoast puts the probability of a December Fed rate hike at 78.5% (FedWatch), a scenario unfavorable to risk assets. In China, consumer inflation printed at 0.7% (0.8% expected) and producer prices at 5.7% (5.3% expected), according to CNBC (November 9). The Bank of England held its rate at 4.00% on November 5, in line with consensus.
On regulation, Blumenthal is asking Binance, Tether and World Liberty Financial for documents before January 4, 2027 (Cryptonews, November 9). The MSCI decision on corporate bitcoin holders, mentioned by CoinDesk on November 2, could not be verified, and no usable on-chain data is available at this stage. Taken together, these elements support the bearish technical signal, tempered only by how stretched the capitulation already is.
Multi-Timeframe Technical Analysis
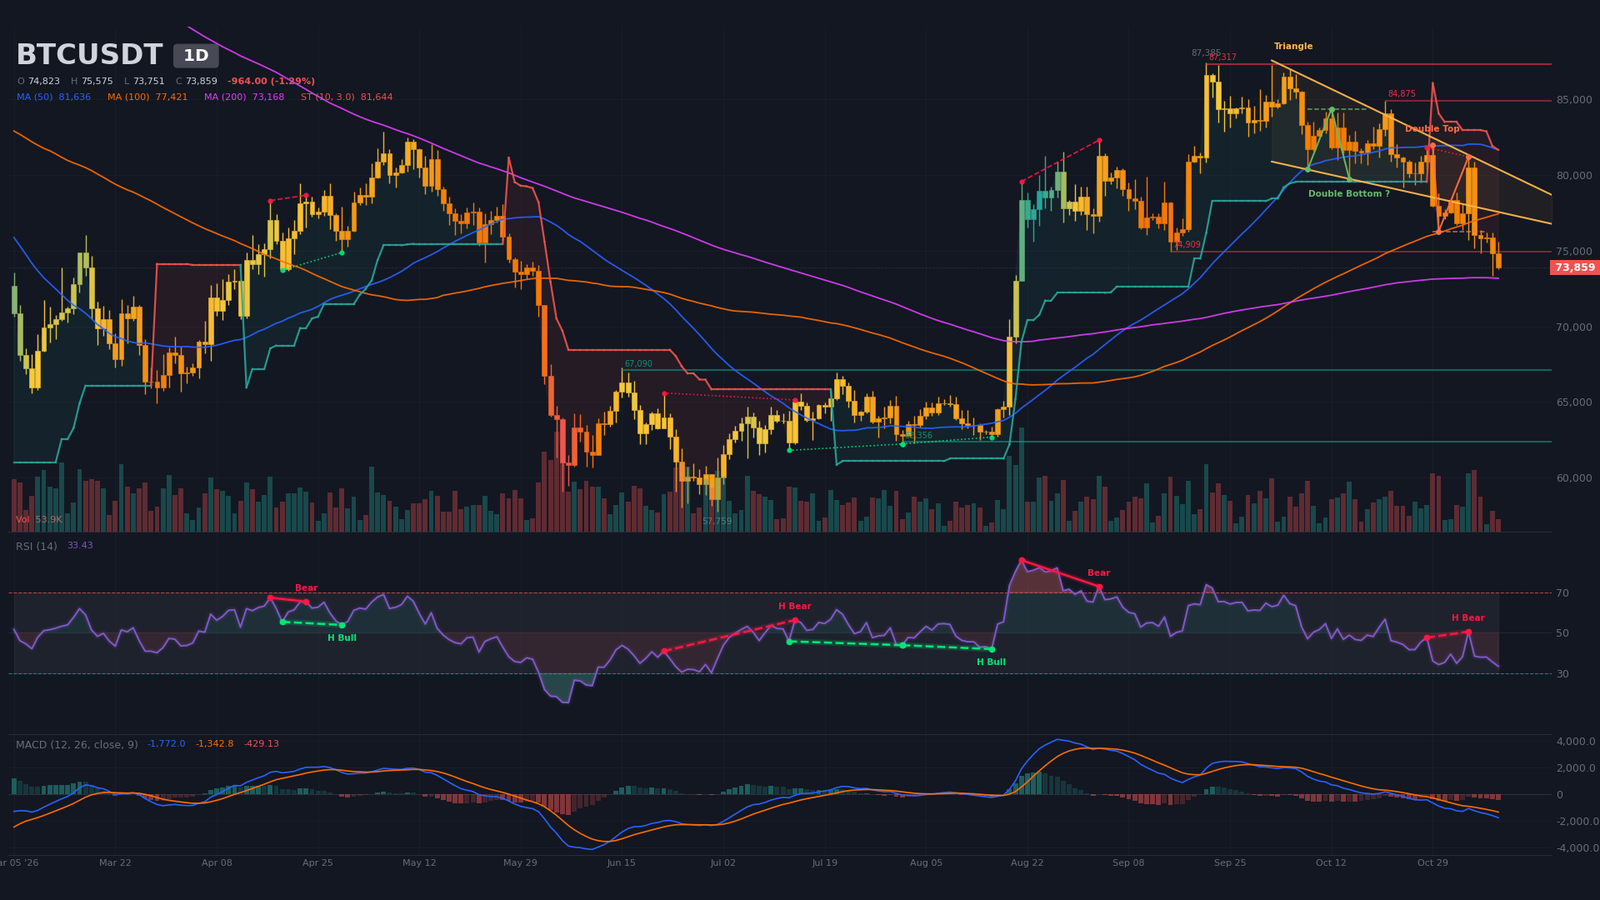
Daily Timeframe (1D): Confirmed Double Top Below the SMA20
The dominant trend is bearish. After the October 2 high at $87,250, the sequence of lower highs ($84,340, $84,880, $81,950 and $81,190) extended into a wedge whose lower boundary, near $77,980, has since been lost; the upper boundary sat at $81,310. Price trades below the SMA20 (around $78,600) and the SMA50 (around $81,600), but above the SMA200 (around $73,200), where it is currently leaning. No 50/200 cross has been recorded, and the bearish SuperTrend, a trend-following indicator, sits at $81,640. The phase looks like distribution that has turned into a bearish impulse.
The dominant pattern is a confirmed double top with a neckline at $76,270, the October 30 trough, and a measured target of $70,970. The neckline has given way and now acts as resistance. A double bottom with a neckline at $84,340 is detected but unconfirmed; it is a very distant hypothesis with no tactical relevance. Daily RSI (relative strength index) sits at ~33, not oversold, after a peak near ~51 on November 4. A hidden bearish divergence (continuation) runs from October 28 to November 4, with price moving from $81,800 to $81,190 while RSI moved from ~48 to ~51.
MACD has stayed below its signal line and below zero since the bearish crossover of September 29, 41 candles ago, with a clearly negative histogram. The current candle’s volume, at 39% of its 20-day average, is provisional. By contrast, the breakdown sessions of October 29 and November 4-5 traded above average volume, which gives the decline its volume confirmation.
Intermediate Dynamics (4H): Confirmed Triple Top and Oversold Reading
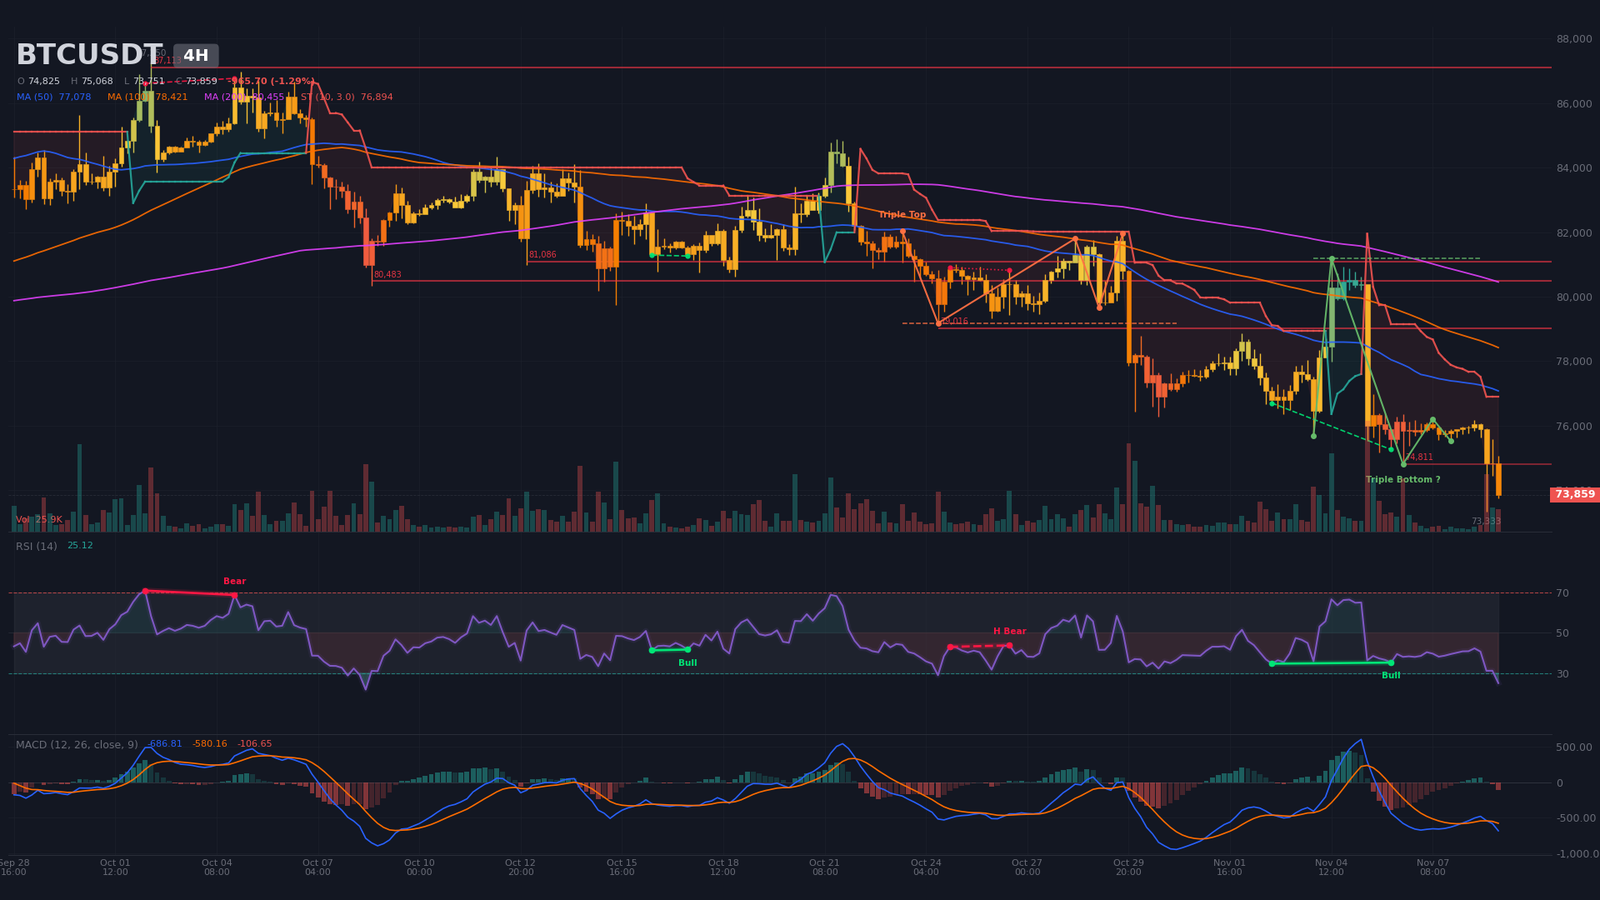
The 4H chart validates the daily view and adds detail. Highs are descending ($81,190, $76,350, $76,210, then $76,170), and so are the lows ($75,690, $75,160, $74,810, then $73,330). The three moving averages, the SMA20 near $75,700, SMA50 near $77,100 and SMA200 near $80,500, all sit above price, and the bearish SuperTrend is at $76,890. The triple top with a neckline at $79,180 is confirmed, and its $76,430 objective has already been overtaken.
4H RSI is at ~25, in oversold territory. A regular bullish divergence, detected between November 2 and 6 (price from $76,700 to $75,260 while RSI held near ~35), did not prevent the November 8 breakdown. MACD crossed lower on November 9 at 00:00, below zero. The current candle’s volume, at 152% of average, confirms an active breakdown rather than a simple sweep. Mechanically, oversold conditions favor a technical bounce toward $74,800 to $75,000 before the decline resumes. A triple bottom with a neckline at $81,190 and an $87,030 objective is detected but unconfirmed; with price roughly 10% lower, it remains a hypothesis.
Intraday Structure (15m): Lower Highs Below $75,800
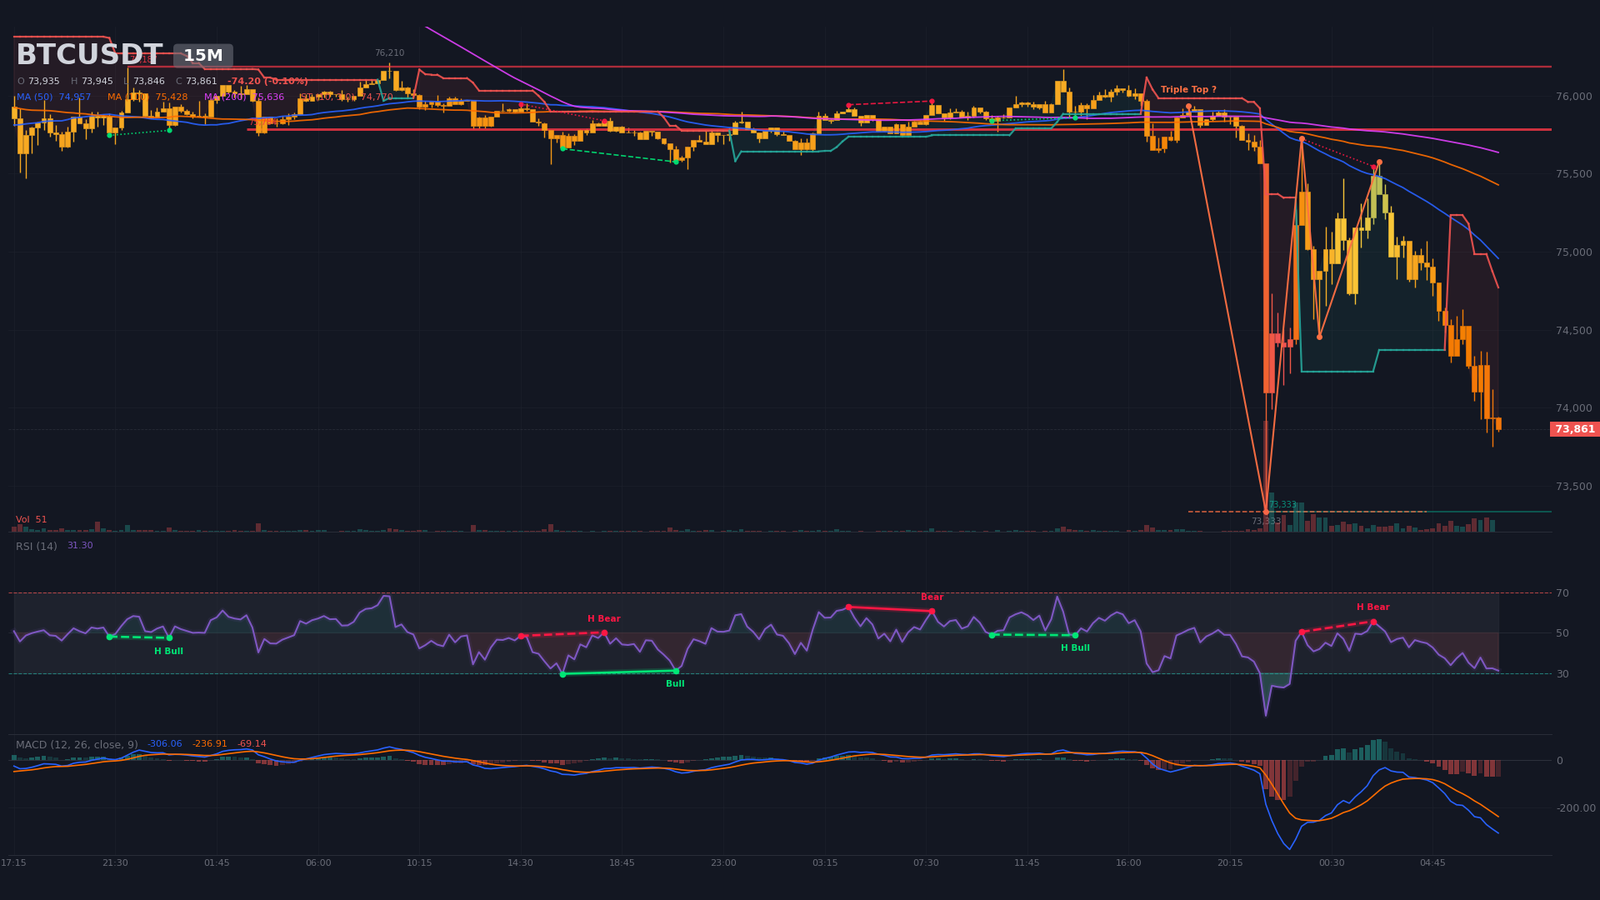
The intraday structure rebuilt itself after the capitulation wick of November 8 at 21:45, which dipped to $73,333 with RSI at 9. Rallies keep failing at lower levels: $75,913, $75,724, $75,575, $75,068 and $74,631. Recent lows ($74,454, $74,662, $74,772 and $74,289) were swept this morning, with a fresh low at $73,751. The working boundaries are therefore $73,330 as support and $75,780 as resistance, the latter tested 15 times. The triple top with a neckline at $73,333 and a $70,920 objective remains unconfirmed; a 15-minute close below $73,330 would validate it.
Price sits below all three moving averages, the 50/200 cross has been bearish since November 8 at 21:45, and the bearish SuperTrend stands at $74,770. RSI is at ~31. A hidden bearish divergence is flagged between November 8 at 23:15 and November 9 at 02:15. The current candle’s volume, at 3% of average, is not usable since the bar has just opened. The 15-minute ATR (average true range, a volatility gauge) of about $293 sets the reference volatility for sizing stops.
Multi-Timeframe Synthesis
| Timeframe | Dominant trend | RSI (14) | MACD | Chart pattern |
|---|---|---|---|---|
| Daily (1D) | Bearish (impulse below SMA20/50) | ~33 | Below signal and zero, bearish crossover on September 29 | Confirmed double top (target $70,970) |
| 4 hours (4H) | Bearish (lower lows) | ~25 (oversold) | Bearish crossover on November 9 | Confirmed triple top, bullish divergence |
| 15 minutes (15m) | Bearish (lower highs) | ~31 | Bearish crossover on November 9 (04:15) | Unconfirmed triple top |
The confluence score stands at 4/5. The missing points are the absence of usable volume on the latest 15-minute candle and the 4H oversold reading.
Level Map: Pivots and Technical Zones
The map combines classic daily and 4H pivots, detected supports and resistances, moving averages, pattern objectives and estimated liquidation pockets. Fibonacci retracements were not retained, because the reference impulse is not dated in the available swings. The short-term central pivot lies between $74,800 and $75,000.
| Level | Price (USD) | Category | Technical basis |
|---|---|---|---|
| Major resistance 3 (R3) | $81,200–$81,700 | Structural resistance | Daily SuperTrend at $81,640, daily SMA50, November 4 swing high ($81,188) |
| Major resistance 2 (R2) | $78,600–$79,200 | Dynamic resistance | Daily SMA20, 4H triple-top neckline ($79,179), estimated short pocket $78,577–$78,923 (~$86M) |
| Immediate resistance (R1) | $75,800–$76,300 | Resistance | 15-touch 15-minute resistance ($75,784), daily double-top neckline ($76,270) |
| Central pivot (P) | $74,800–$75,000 | Pivot | Daily pivot $74,775, 4H pivot $74,951, resistance $74,811–$74,909 |
| Immediate support (S1) | $73,100–$73,400 | Support / magnet | November 8 low ($73,333), daily S1 $73,381, daily SMA200, estimated long pocket $72,124–$73,277 (~$233M) |
| Major support 2 (S2) | $70,400–$71,000 | Pattern objective | Daily double-top objective ($70,969), 15-minute triple-top objective ($70,920), long pocket $70,396–$70,742 (~$59M) |
| Major support 3 (S3) | $67,100–$68,900 | Structural support | Daily support $67,090 (2 touches), estimated long pocket $68,437–$68,898 (~$80M) |
Order Book and Liquidity Heatmap
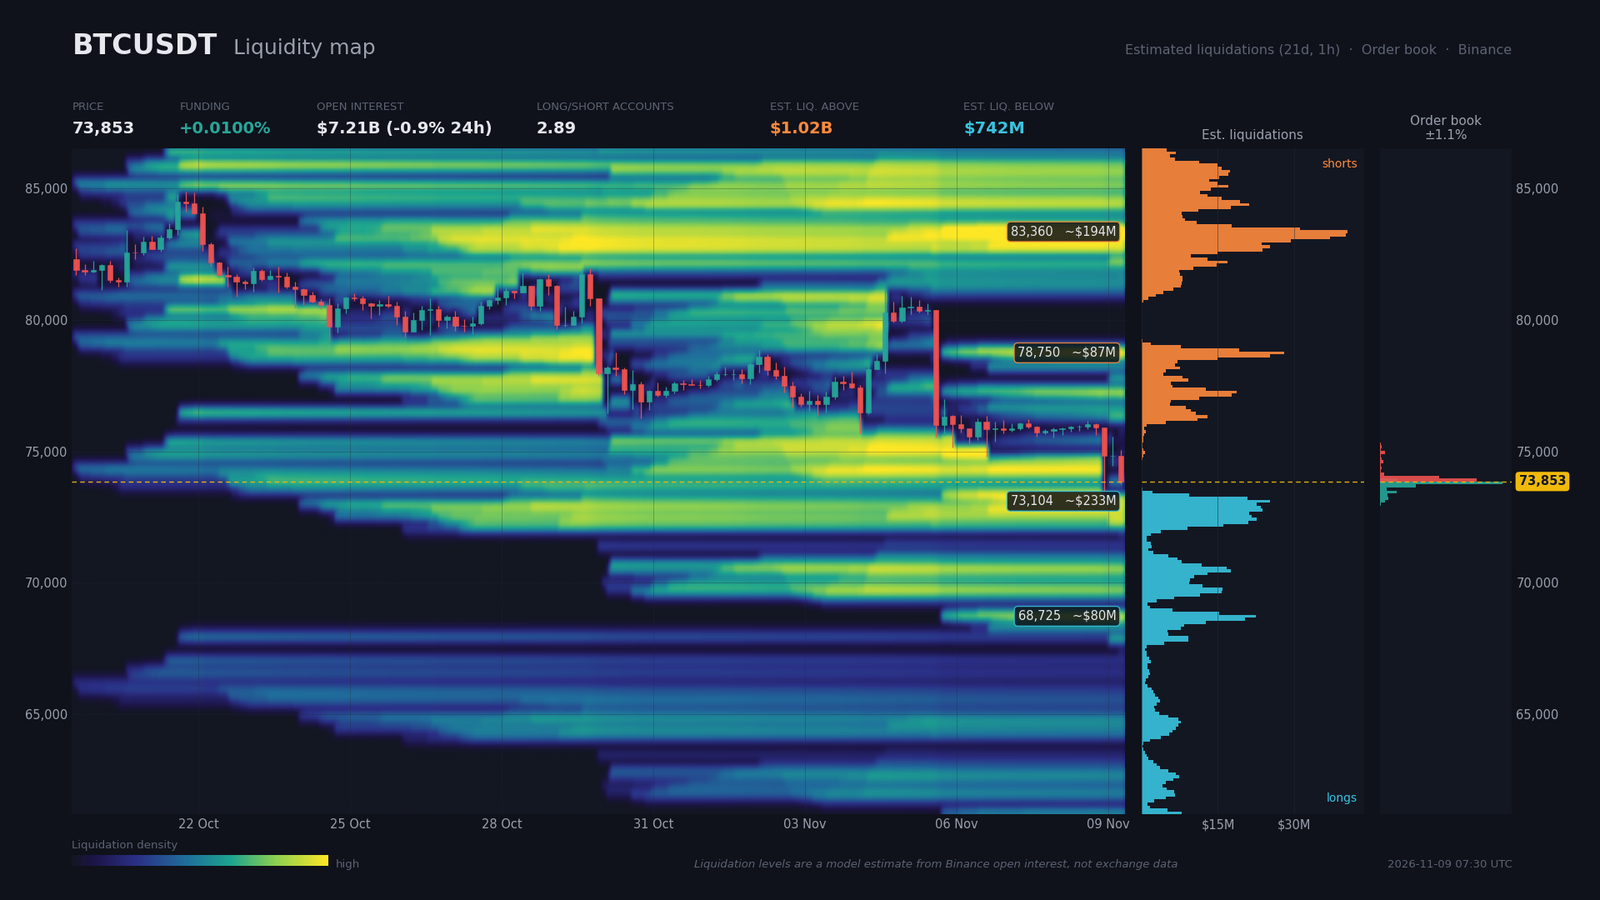
The Binance order book (perp and spot) is only visible within about 1.12% of the current price, so it speaks to the very short term. On the sell side, walls sit at $73,910 ($32.2M) and $74,026 ($19.8M), followed by very thin levels at $74,141 ($1.3M) and $74,948 ($1.6M). On the buy side, the main walls are at $73,795 ($40.9M), $73,680 ($11.8M), $73,449 ($5.5M) and $73,219 ($2.7M). Within a 2% band, bids ($72.7M) exceed asks ($58.1M), an imbalance of 11.1% in favor of buyers, but with coverage this thin the signal stays weak.
Estimated liquidation zones, drawn from a model based on open interest changes rather than measured directly, show a long pocket between $72,124 and $73,277 (peak at $73,104, about $233M), followed by more distant pockets at $70,396 to $70,742 (about $59M) and $68,437 to $68,898 (about $80M). Above price, shorts cluster between $78,577 and $78,923 (about $87M) and between $82,956 and $83,533 (about $194M, peak at $83,360). The estimated total is about $1.02B above against $742M below, which makes the $73,100 pocket, right next to price, the nearest magnet.
Derivatives point to leverage that has been purged without a full capitulation. Funding is at 0.01% (10.9% annualized), and open interest stands at $7.21B, down 0.94% over 24 hours and 3.35% over seven days. The account-based long/short ratio remains at 2.89, still dominated by longs, while the top-trader ratio is at 1.94 and the taker buy/sell ratio at 0.955, a sign of selling aggression. This residual long positioning feeds the risk of a liquidity sweep below $73,300, whereas a quick rebound would find little squeeze fuel before $78,600.
Calendar: Catalysts to Watch
The release most likely to push price out of its current structure is the US CPI print on November 10 at 14:30 (Zurich time). No Deribit options expiry or CME settlement appears in the calendar provided, so scheduled macro releases are the main catalysts. Four events stand out.
- November 10, 04:00 (Zurich) — Chinese trade balance (exports, consensus 33%, previous 36.3%): appetite for risk in Asia.
- November 10, 10:00 (Zurich) — Waller speech (FOMC), medium impact: will either confirm or weaken the case for a December hike.
- November 10, 14:30 (Zurich) — US CPI: core m/m (consensus 0.2%, previous 0.3%) and headline m/m (index consensus 337.023 versus 330.654 previously, values as provided): an upside surprise would add pressure, while a core print below 0.2% would fuel a technical rebound.
- November 13, 14:30 (Zurich) — core producer prices (consensus 0.4%, previous 1.3%): a further gauge of inflation pressure.
Three Scenarios for the Coming Weeks
The probabilities below are the analyst’s own and total 100%. The horizon is short, from a few sessions to a few weeks.
Scenario A — Bearish continuation toward the double-top target (probability 55%)
The main trigger is the US CPI release on November 10 at 14:30, against a backdrop of a 78.5% probability of a December Fed hike according to FedWatch, or a 4H close below $73,330. The path leads first to $73,100, inside the long pocket, then to the double-top objective at $70,970, at the heart of the estimated $70,400 to $70,740 pocket. With an entry at $74,600, the risk is $1,300 for a potential gain of $3,630 toward $70,970, an R:R of 2.8. Execution zone: selling rallies between $74,300 and $74,900, below the 4H S1 and the $74,811 resistance. Invalidation: a 4H close above $75,800, the 15-touch 15-minute resistance; the stop sits near $75,900, more than one 4H ATR ($846) away.
Scenario B — Sweep of the $72,100–$73,300 pocket followed by a technical rebound (probability 30%)
The catalyst is a CPI print below 0.2% on November 10, or a 15-minute close below $73,330 followed by a recovery above it. A wick into the long pocket (peak at $73,104) would coincide with 4H RSI already oversold at ~25 and the 4H bullish divergence. The path would first target $74,800 to $75,000, then the double-top neckline at $76,270, to be retested from below. From $72,800 toward $76,270, the R:R is about 3, but as a counter-trend bounce the trade carries more risk. Execution zone: buying the reaction between $72,400 and $73,300 (daily SMA200, bids of $73,219 to $73,449). Invalidation: a 4H close below $72,100, with a stop near $71,700, more than one 4H ATR away.
Scenario C — Bullish invalidation through a reclaim of the neckline (probability 15%)
The catalyst would be a soft CPI print combined with a return of buying flows into ETFs, and the trigger a daily close above $76,270. The path leads to $78,600 to $78,900, where the daily SMA20 and the estimated short pocket sit, then to $81,200 to $81,700, the zone of the daily SuperTrend and SMA50. This scenario would negate the double top. Execution zone: buying a retest of $75,800 to $76,300. Invalidation: a 4H close back below $74,800.
Synthesis and Conclusion
Bitcoin is in a bearish impulse phase after distribution between $81,000 and $87,000, aggravated by the Binance shock and by ETF outflows that pushed cumulative 2026 flows into negative territory. The November 9 long liquidations confirm how fragile positioning is, but not a full capitulation, since the long/short ratio remains elevated. The daily SMA200 is the only structural support before $70,970, and a confluence score of 4/5 strengthens the reading without making it certain.
The dominant technical strategy remains to sell rallies below $75,800 as long as price stays under the $76,270 neckline, with protection above $75,900. A counter-trend bounce is justified only after a sweep and recovery of $73,300. Five levels deserve monitoring: $75,800 to $76,300, $74,800 to $75,000, $73,100 to $73,400, $70,400 to $71,000, and $78,600, the daily SMA20 and the threshold that would neutralize the bearish bias.
Sources
- Crypto : 1 milliard de dollars de liquidations en 24 heures — Cryptoast, 09/11/2026
- BTC, ETH, XRP Crash Again as Liquidation Wave Hits $1B — CryptoPotato, 09/11/2026
- XRP Suffers Brutal Collapse Against Bitcoin — U.Today, 09/11/2026
- China wholesale inflation hits highest in more than four years — CNBC, 09/11/2026
- Bitcoin ETFs flip negative for 2026 after $1.28 billion outflow week — The Block, 07/11/2026
- Crypto ETFs see over half a billion dollars in outflows — The Block, 06/11/2026
- Bitcoin ETFs saw $643M outflows Friday; 2026 barely green — CoinDesk, 02/11/2026
- Blumenthal Investigation Targets Binance, Tether and Trump Crypto Firms — Cryptonews, 09/11/2026
- Vitalik ‘pivots’ ETH to store of value, crypto suffers after US midterms: Hodler’s Digest — Cointelegraph, 08/11/2026
- United States Nonfarm Payrolls — investing.com, date not specified
- Economic and crypto calendar (Zurich time) — calendar provided, November 9, 2026
Disclaimer: This article is for educational and informational purposes only. It does not constitute investment advice, a recommendation to buy or sell, or an invitation to trade any financial asset. Cryptocurrency markets are extremely volatile; any investment decision should be based on your own research (DYOR) and, where appropriate, the advice of a licensed financial adviser.

