


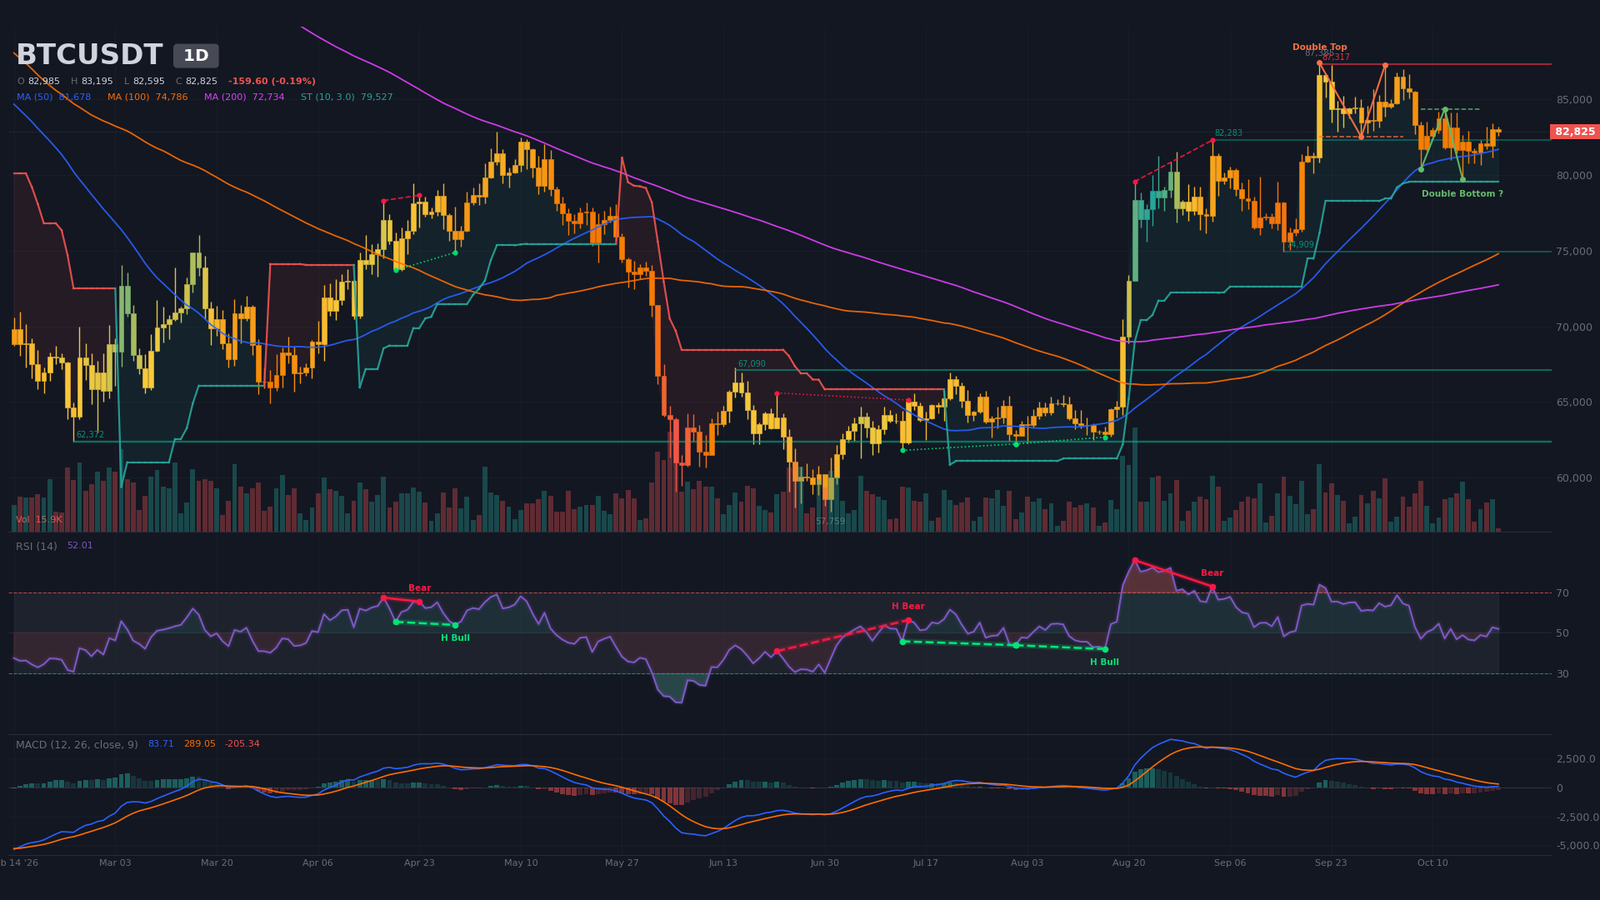
Bitcoin trades at $82,825 on October 21, roughly 5% below the period high of $87,385 set on September 21 and 43% above the period low of $57,759. Since the move from $74,909 (September 15) to that peak, the market has been consolidating in a range of roughly $79,700 to $87,400. The global bias is neutral, conviction is moderate and the confluence score sits at 3 out of 5: price is compressed across all three timeframes, between support near $82,000 to $82,750 and resistance near $83,150 to $83,450.
The immediate engine is institutional flow. US spot ETFs drew $526.7M on October 19, their best day since September 22 ($714.7M). According to Decrypt (October 20), IBIT attracted $665.2M while FBTC and GBTC shed $83.6M and $54.9M respectively, and October’s net outflows shrink to about $88M. BeInCrypto puts the average ETF cost basis near $81,500, a level that coincides with the daily support. On October 20, Switzerland’s FINMA approved the country’s first Bitcoin ETF open to retail investors, while JPMorgan Asset Management published a forecast of 10% compound annual return over 10 to 15 years, with 55% volatility, without including the asset in its core correlation matrices.
Macro conditions are a heavier weight. UK inflation for September came in at 3.5% year on year against 3.4% expected, driven by fuel (+29.8%), and markets now price a 98% chance of a Bank of England hike to 4% next month (CNBC, October 21). In the US, housing starts fell 5.2% on October 20 against a consensus of +1.3%, mortgage rates reached 7.43% and the 10-year yield remains above 5% (Decrypt, October 20). CNBC describes a Fed that is weighing further hikes. Chinese retail sales (1.1% y/y against 0.5% expected) and GDP (4.5% against 4.4%) beat forecasts on October 19 with no directional reaction visible in the asset.
That backdrop partly neutralizes the technical signal. ETF inflows and regulatory approvals support the floor, but high yields and the risk of further monetary tightening cap any upside extension. The multi-timeframe read that follows should therefore be taken as a chain: each timeframe is interpreted in light of the one above it.
Multi-Timeframe Technical Analysis
Daily Timeframe (1D): Sideways Consolidation Under Resistance
On the daily chart, the highs are descending: $87,385 (September 21), $87,250 (October 2), $86,976 (October 5), then $84,340 (October 12). Lows are holding above $79,700 (October 15), with a higher low at $80,622 (October 18). Price sits below the 20-period moving average (near $83,140), above the 50-day SMA (near $81,680) and well above the 200-day SMA (near $72,730). The 50/200 golden cross dates from September 8, 43 candles ago, and the daily SuperTrend remains bullish at $79,530.
The dominant pattern is a double top, flagged as confirmed, with a neckline at $82,500 and a target of $77,680. Closes on October 8 ($81,711), October 12 and October 14 slipped below the neckline, but price reclaimed it on October 20 and 21. That points to a failed bearish retest that still needs confirmation: the target only becomes active on a daily close below $79,700. Conversely, an unconfirmed double bottom would target $88,640 above the $84,340 neckline. The regular bearish divergence from August 21 to September 3 (RSI falling from 86 to 73) is old and no longer weighs directly.
The 14-period RSI sits at ~52, neutral. The MACD is above zero but below its signal line after a bearish crossover on September 29, and its negative histogram is contracting. Volume on the live candle, at 12% of its 20-period average, is too partial to interpret.
Intermediate Dynamics (4H): Compression With a Bullish Bias
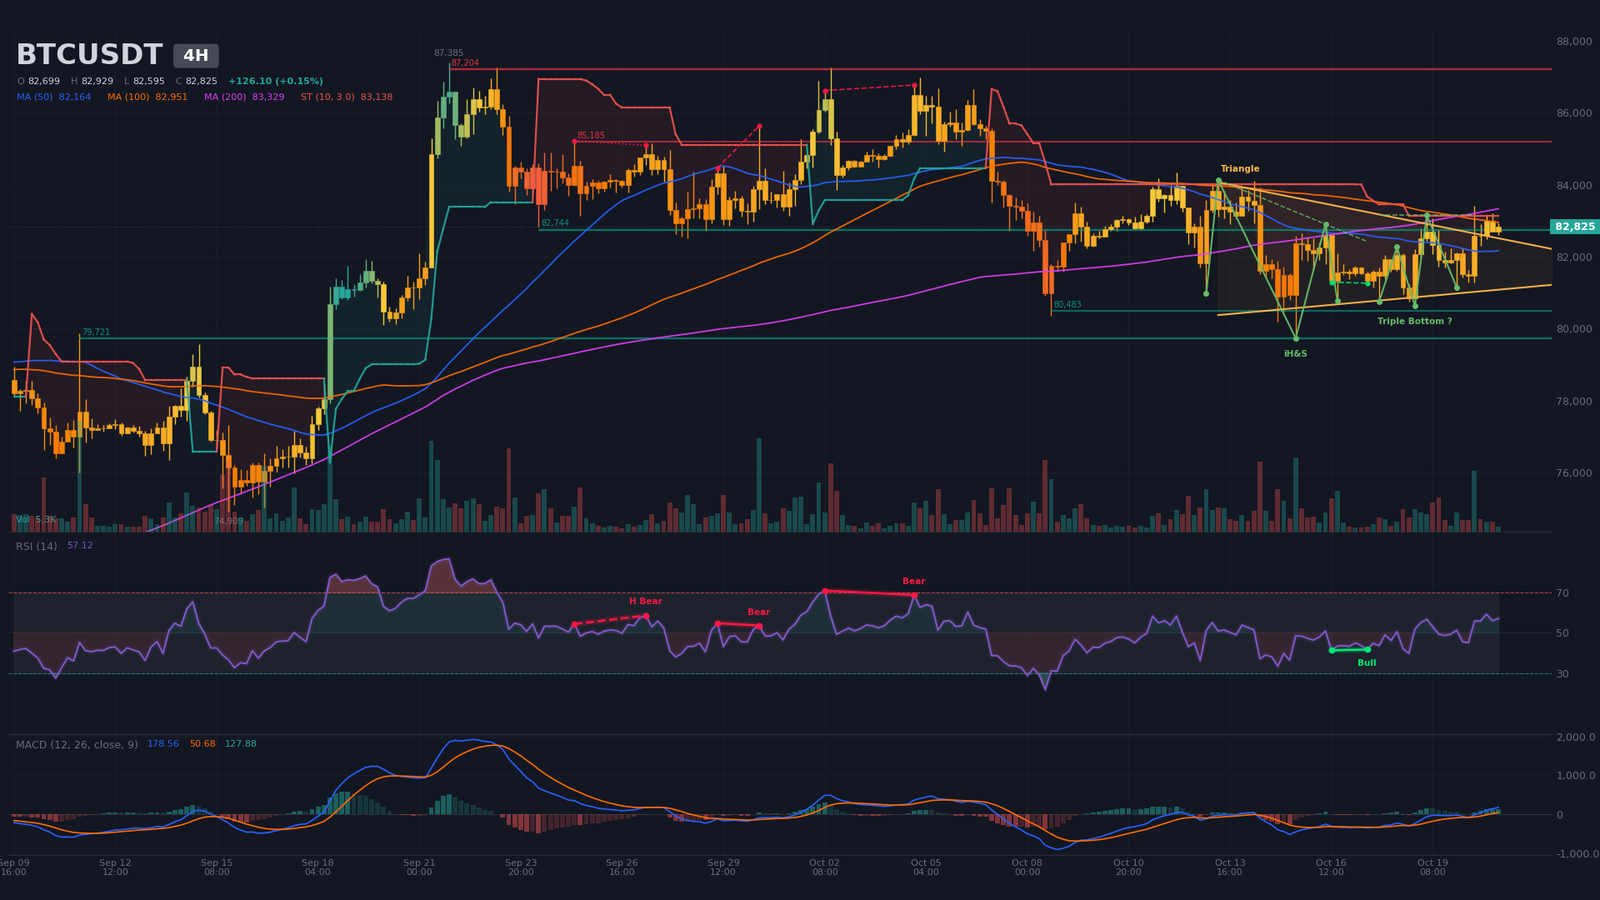
The 4-hour chart holds the most readable structure right now. A symmetrical triangle has been in place since October 13, with an upper boundary at $82,740, a lower boundary at $80,975 and an estimated apex on October 26 around 03:00. Price, at $82,825, sits just above the upper boundary without a confirmed 4H closing breakout. A confirmed inverse head and shoulders carries a neckline at $82,900 and a target of $86,270. An unconfirmed triple bottom would place its neckline at $83,160 and its target at $85,480. A regular bullish divergence between October 16 and 17 (RSI near 41) supports the bounce.
Price is above the 4H SMA20 ($82,080) and SMA50 ($82,160) but below the SMA200 ($83,330), following a bearish 50/200 crossover on October 16. The 4H SuperTrend, bearish at $83,140, tempers the read. On the other hand, the RSI is at ~57 and the MACD crossed up on October 20 at 12:00, above zero, with a positive histogram. Volume on the partial candle is only 27% of its average. The $82,740 support (3 contacts) is being tested; the next resistances are $85,190, then $87,200.
Intraday Structure (15m): Ascending Triangle Already Broken
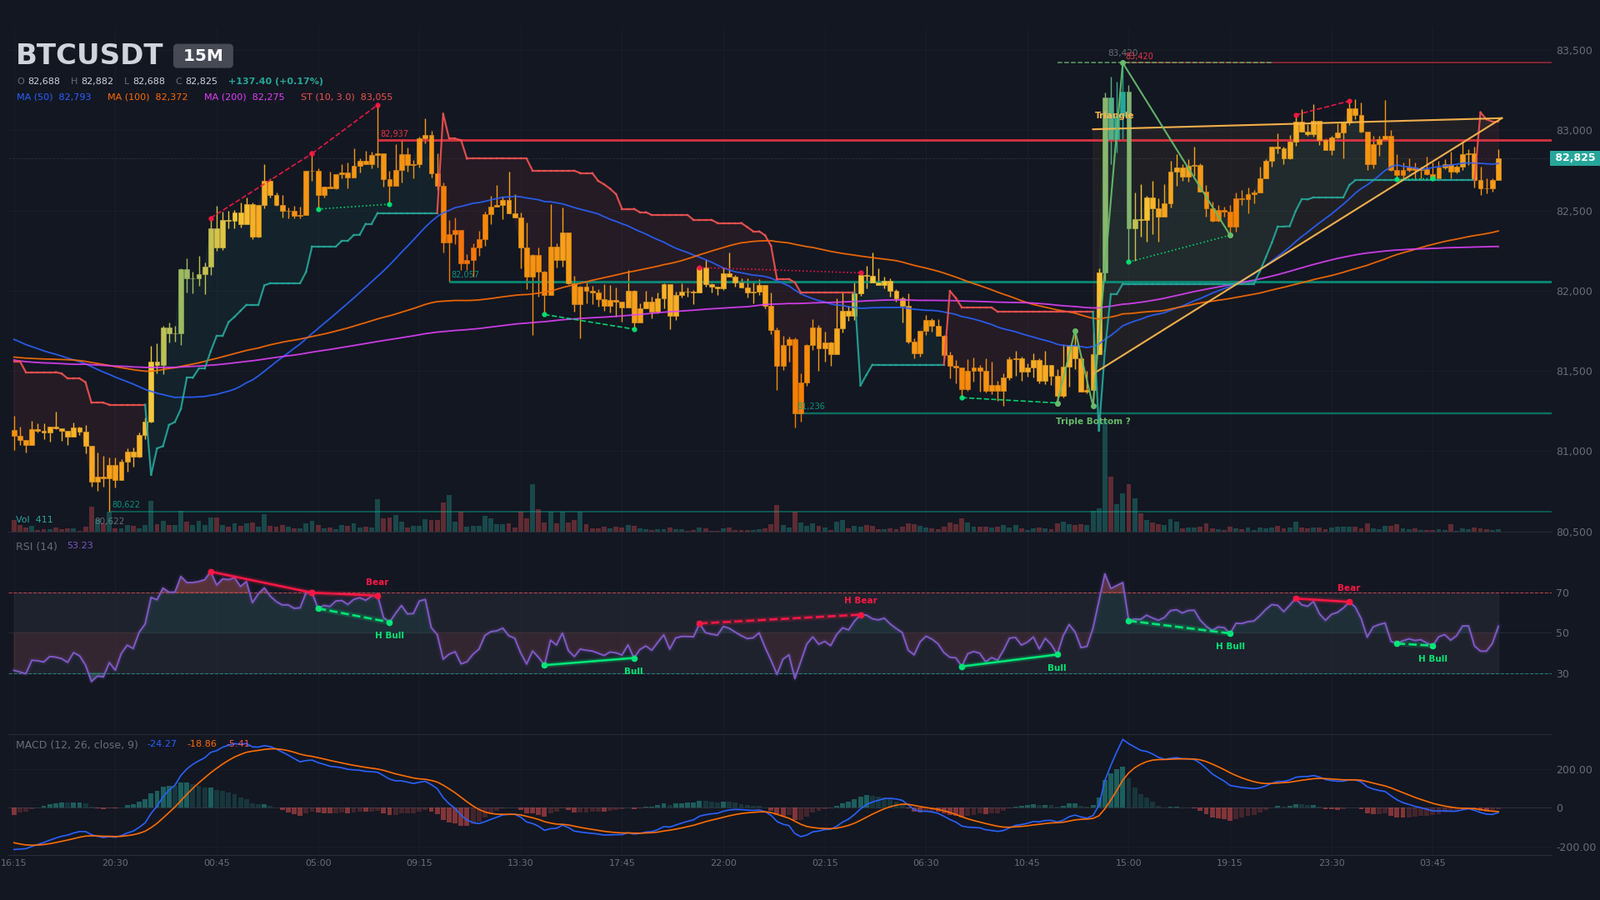
On the 15-minute chart, the ascending triangle detected since October 20 at 13:30 has been exceeded. Its upper boundary is $83,070, its lower boundary $82,920, and its apex, estimated for October 21 around 06:39, has passed. With price at $82,825, below the lower boundary, the pattern no longer offers an actionable signal. Resistance at $82,940 (5 contacts) now caps the range, with an intraday high at $83,420. Supports sit at $82,057 (6 contacts), $81,236 and $80,622. An unconfirmed triple bottom would target $85,200 above $83,420.
The 15m moving averages (SMA20 at $82,760, SMA50 at $82,790 and SMA200 at $82,280) are bunched together, a sign of compression, and the RSI is at ~53. The MACD has been below zero since its bearish crossover on October 20 at 23:15. A regular bearish divergence (RSI from 67 to 65 between October 20 and 21) is offset by a hidden bullish divergence (RSI from 45 to 44 between 02:15 and 03:45). Volume is at 77% of its average, and the 15m SuperTrend remains bearish at $83,050.
Multi-Timeframe Synthesis
| Timeframe | Dominant trend | RSI (14) | MACD | Chart pattern |
|---|---|---|---|---|
| Daily (1D) | Range under resistance | ~52 | Bearish crossover on September 29, contracting histogram | Double top, neckline tested |
| 4 hours (4H) | Compression with bullish bias | ~57 | Bullish crossover on October 20 | Symmetrical triangle and inverse head and shoulders |
| 15 minutes (15m) | Neutral (compression) | ~53 | Bearish crossover on October 20 | Ascending triangle broken |
Level Mapping and Pivots
The map combines classic daily pivots, support and resistance levels weighted by their number of contacts, swing points, pattern targets and estimated liquidation pockets. Fibonacci extensions are not used because the phase is a range. The short-term central pivot is the daily P at $82,517, aligned with the $82,500 neckline of the double top.
| Level | Price (USD) | Category | Technical basis |
|---|---|---|---|
| Major resistance 3 (R3) | $87,000 – $87,400 | Structural resistance | Daily resistance at $87,317 (2 contacts), the September 21 high ($87,385) and October 2 high ($87,250), 4H $87,204 (3 contacts) |
| Major resistance 2 (R2) | $84,900 – $85,500 | Resistance / liquidity magnet | 4H $85,185 (2 contacts), estimated short pockets $84,953–$85,277, targets $85,198 (15m) and $85,476 (4H) |
| Immediate resistance (R1) | $83,100 – $83,450 | Resistance | Daily SMA20 ($83,137), 4H SuperTrend ($83,138), 4H triple bottom neckline ($83,158), 15m high of October 20 ($83,420) |
| Central pivot (P) | $82,500 – $82,750 | Pivot / pivot support | Daily P at $82,517, double top neckline at $82,500, 4H support at $82,744 (3 contacts), buy walls $82,710–$82,802 |
| Immediate support (S1) | $81,600 – $82,100 | Support | Daily SMA50 ($81,678), daily S1 ($81,614), 15m support at $82,057 (6 contacts), average ETF cost near $81,500 |
| Major support 2 (S2) | $80,300 – $80,650 | Support | 4H support at $80,483 (2 contacts), October 8 low ($80,345) and October 18 low ($80,622) |
| Major support 3 (S3) | $79,200 – $79,750 | Support / liquidity magnet | October 15 low ($79,732), 4H support at $79,721 (3 contacts), daily SuperTrend ($79,527), estimated long pocket $79,217–$79,356 |
Order Book and Liquidity Heatmap
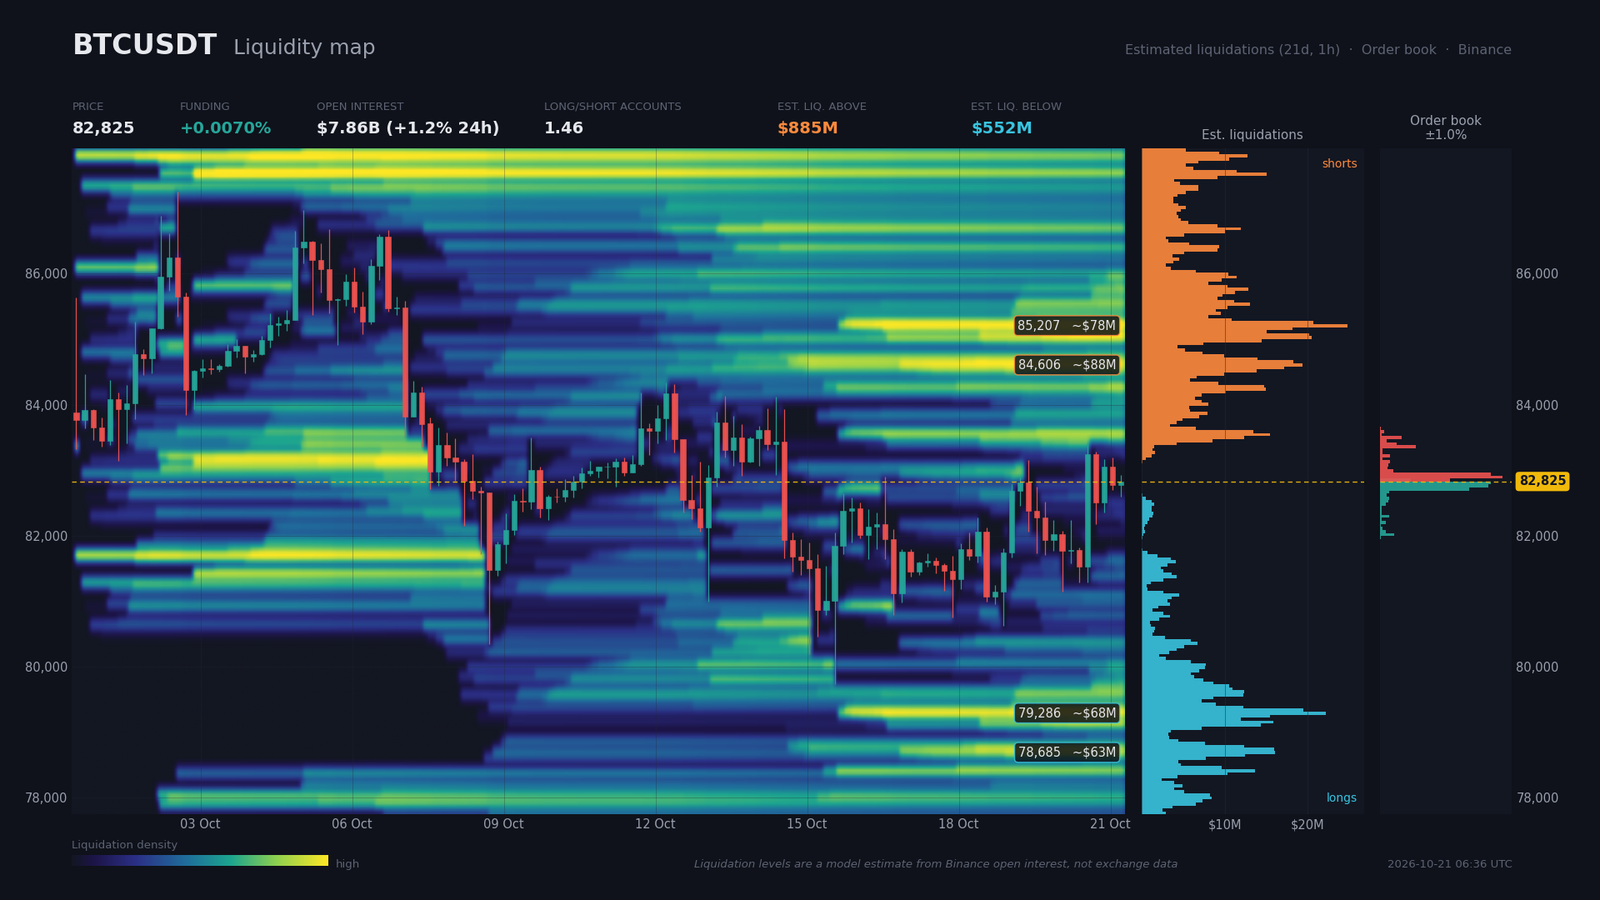
The order book is only visible up to about 1% from price (0.98% coverage), which limits its reach. Sell walls sit at $82,848 ($11.8M), $82,895 ($20.7M), $82,941 ($18.7M) and $83,357 ($6.0M), facing buy walls at $82,802 ($18.7M), $82,756 ($18.2M), $82,710 ($15.0M) and $82,016 ($2.4M). Within 2% of price, the imbalance is -2.8% ($70.8M on the bid side against $74.8M on the ask side), close to neutral. The walls face each other within a few dollars, which is consistent with compression.
Estimated liquidation zones, drawn from a model rather than measured data, are larger above price. Short pockets total an estimated $885M, with a peak at $84,606 (about $88M, +2.15%), followed by $85,138–$85,277 (about $78M, +2.88%) and $84,953–$85,092 (about $71M, +2.71%). Long pockets, estimated at about $552M, sit between $79,217 and $79,356 (about $68M, -4.27%), $78,616–$78,801 (about $63M) and $79,078–$79,171 (about $45M).
On the derivatives side, funding is 0.007% (about 7.7% annualized), which is moderate. Open interest stands at $7.86B (+1.25% over 24 hours, +2.42% over seven days). The account long/short ratio is 1.46, the top-trader ratio 1.89 and the 24-hour taker buy/sell ratio 1.05. Positioning leans modestly long without excess leverage. That asymmetry suggests a bullish break could trigger a liquidity sweep toward $84,500–$85,300, while a false breakdown below $81,000 remains possible before a recovery higher.
Calendar: Catalysts to Watch
No Deribit options expiry or CME settlement appears in the calendar provided. The events below are those with real potential to move price.
- Thursday, October 22, 14:30 (Zurich) — US initial jobless claims (consensus 200, previous 199): short-term read on the macro tone, medium impact.
- Friday, October 23, 01:30 (Zurich) — Japan inflation (consensus 2.1%, previous 1.9%): a hotter print would revive the risk of a Bank of Japan tightening.
- Friday, October 23, 08:00 and 10:30 (Zurich) — UK retail sales (consensus -0.1%, previous 0.5%) and flash manufacturing PMI (consensus 51.7, previous 51.9): a test of the European growth backdrop.
- Wednesday, October 28, 19:00 (Zurich) — Fed rate decision (consensus 4%, unchanged from previous), press conference at 19:30: the key event, since the tone on possible hikes will weigh on volatility.
- Thursday, October 29, 13:30 (Zurich) — core PCE m/m (previous 0.2%) and personal spending (previous 0.9%): a closely watched inflation gauge, to be read in the wake of the previous day’s decision.
The FOMC meeting of October 28, preceded by the tightening of the 4H compression with an estimated apex on October 26, is the event most likely to pull price out of its structure.
Three Scenarios for the Coming Weeks
The three scenarios cover a horizon of a few weeks and hinge on the calendar above. The probabilities, set by the analyst, add up to 100%.
Scenario A — Bullish Breakout From the 4H Compression (probability 45%)
The trigger is a 4H close above $82,900 (the neckline of the inverse head and shoulders), then above $83,160. Catalysts are the US jobless claims on October 22 (14:30), then the Fed decision on October 28 (19:00). The path targets $84,340 (the daily double-bottom neckline), then $84,600 (peak of the estimated short pocket) and $85,190–$85,480, with a possible extension to $86,270 (the 4H pattern target). The R:R toward $84,340 is about 1.8. Execution zone: pullback toward $82,500–$82,750 (4H support at $82,744, buy walls). Invalidation: a 4H close below $81,800, with a stop at $81,800, about 1.2 × the 4H ATR ($772).
Scenario B — Bearish Sweep Then Return to the Range (probability 35%)
The trigger is a wick below $80,975 (the lower boundary of the triangle) toward $79,700–$80,500, followed by a recovery above $81,000. Catalysts are the UK PMI on October 23 (10:30) or pre-FOMC volatility. The path leads to a bounce toward $82,100, then $82,750, with an R:R toward $82,750 of about 1.7. Execution zone: $79,900–$80,600 once the recovery is confirmed. Invalidation: a daily close below $79,700, with a stop below $79,000 (more than 1 × the 4H ATR).
Scenario C — Bearish Invalidation of the Range (probability 20%)
The trigger is a daily close below $79,700, which would validate the double-top target. Catalysts are the FOMC on October 28 (19:00) and the PCE on October 29 (13:30), if the tone is more restrictive than expected. The path descends toward $79,200 (estimated long pocket), then $77,680 (double-top target) and $74,910 (September 15 low), with an R:R toward $77,680 of about 1.9. Execution zone: retest of $80,400–$80,800 from below. Invalidation: a 4H close above $82,100 (stop at $1,500, wider than the 4H ATR).
Summary and Conclusion
The market is consolidating after the September impulse, in a multi-timeframe compression. ETF inflows (of $526.7M on October 19), an average ETF cost basis near $81,500 and moderate funding support the floor. On the other hand, descending daily highs, a daily MACD below its signal, bearish 4H and 15m SuperTrend readings and high yields cap the immediate potential. The $83,150–$83,450 zone is the bullish ceiling to clear, and the data does not allow a call until the 4H closes outside the triangle.
The dominant technical strategy is to wait for the compression to resolve rather than anticipate it. A buy-on-dip bias is only justified while price holds above $81,800 on a 4H close. The structural protection level remains $79,700 on a daily close, while the critical levels to watch are $83,150–$83,450, $82,500–$82,750, $81,600–$82,100 and $84,340 as the first recovery target.
Sources
- JPMorgan Puts a Number on Bitcoin for the First Time: 10% a Year, With a Big Caveat — Decrypt, October 20, 2026
- Bitcoin ETFs Post Their Best Day in Nearly a Month as BlackRock Does All the Buying — Decrypt, October 20, 2026
- Bitcoin ETFs Pull $526.6 Million, Their Biggest Day Since September 22 — BeInCrypto, October 20, 2026
- Swiss Financial Regulator Gives Green Light to Country’s First Bitcoin ETF — Bitcoin Magazine, October 20, 2026
- Swiss Regulator Approves First Retail Fund That Holds Bitcoin Directly — Decrypt, October 20, 2026
- UK inflation jumps to 3.5% — cementing rate hike expectations — CNBC, October 21, 2026
- Housing is flashing warning signs just as the Fed weighs more interest rate hikes — CNBC, October 20, 2026
- Bitcoin’s Next Move: Here’s What to Watch — Decrypt, October 20, 2026
- Liquid Network Announces Final Stages of Recovery Following Massive Hack — Bitcoin Magazine, October 20, 2026
- Bitget plans Thai crypto exchange acquisition weeks after $388M hack — Cointelegraph, October 20, 2026
- Crypto firms, Wall Street push SEC to revise Regulation Crypto Assets as comments close — The Block, October 20, 2026
- Bitcoin On-Chain Analysis: 10 Metrics Every Crypto Investor Should Know — Blockchain Council, October 6, 2026
- Economic calendar and liquidity data (order book, derivatives, estimated liquidations) — data provided, October 21, 2026 (URL not provided)
Disclaimer: This article is for educational and informational purposes only. It does not constitute investment advice, a recommendation to buy or sell, or an invitation to trade any financial asset. Cryptocurrency markets are extremely volatile; any investment decision should be based on your own research (DYOR) and, where appropriate, the advice of a licensed financial adviser.

