


Bitcoin trades at $82,730 as of October 19, 2026, roughly 5.3% below the period high of $87,385 reached on September 21 and about 10% above the September 15 swing low of $74,910. The rebound from that floor is losing momentum as price approaches a resistance band, and the market is consolidating in a way that looks more like a pause than a reversal.
The dominant driver remains the outflow from spot funds. According to Decrypt (October 18), US spot ETFs recorded $228.6M of net outflows this week, after $681.1M the week before, or roughly $910M over two weeks. The worst session, a Wednesday, saw $261.4M of redemptions, a figure the Farside table confirms for October 14. On the derivatives side, open interest reached $7.86B, up 3.4% over 24 hours, without signs of excess leverage: early October funding exceeded 8% annualized in only one of 28 exchange-day observations, and $487M of long positions were liquidated in 24 hours, according to Yahoo Finance (October 7).
The macro backdrop weighs just as heavily. US inflation for September came in at 0.6% month on month, in line with consensus, but underlying PPI surprised sharply at 0.7% against 0.3% expected, and underlying retail sales printed 0.9% against 0.5% expected, according to releases on October 14 and 15. The price briefly slipped back below $80,000 and touched a low of $79,730 on October 15. CNBC (October 18) describes two inflation readings that were hotter than expected, Middle East tensions, and US midterm elections in about two weeks. Bitcoin Magazine (October 13) reported that the Fed raised rates last month, and CryptoPotato (October 19) notes that the central bank is now in its blackout period. The VIX jumped 21.5% on Friday, but China’s 4.5% third-quarter growth, above the 4.4% expected, supported risk assets on Monday, according to Journal du Coin (October 19). Japanese yields at multi-decade highs (CNBC, October 19) and a French-German spread of 160 bp at the end of September (CoinDesk, October 5) remain background pressures.
Institutional signals are mixed. Morgan Stanley recommends 0% to 4% crypto exposure depending on the profile (Journal du Coin, October 19), while MSCI is moving ahead with a proposal that could exclude Strategy from its indices (Bitcoin Magazine, October 16). On-chain, Santiment reported 86,702 BTC accumulated by whales over three weeks and 24,073 BTC withdrawn from exchanges in a single day, with no visible effect on price. This context partly neutralizes the technical signal: outflows argue against a strong rebound, while risk appetite and whale accumulation support it. The three timeframes below should be read within that frame.
Multi-Timeframe Technical Analysis
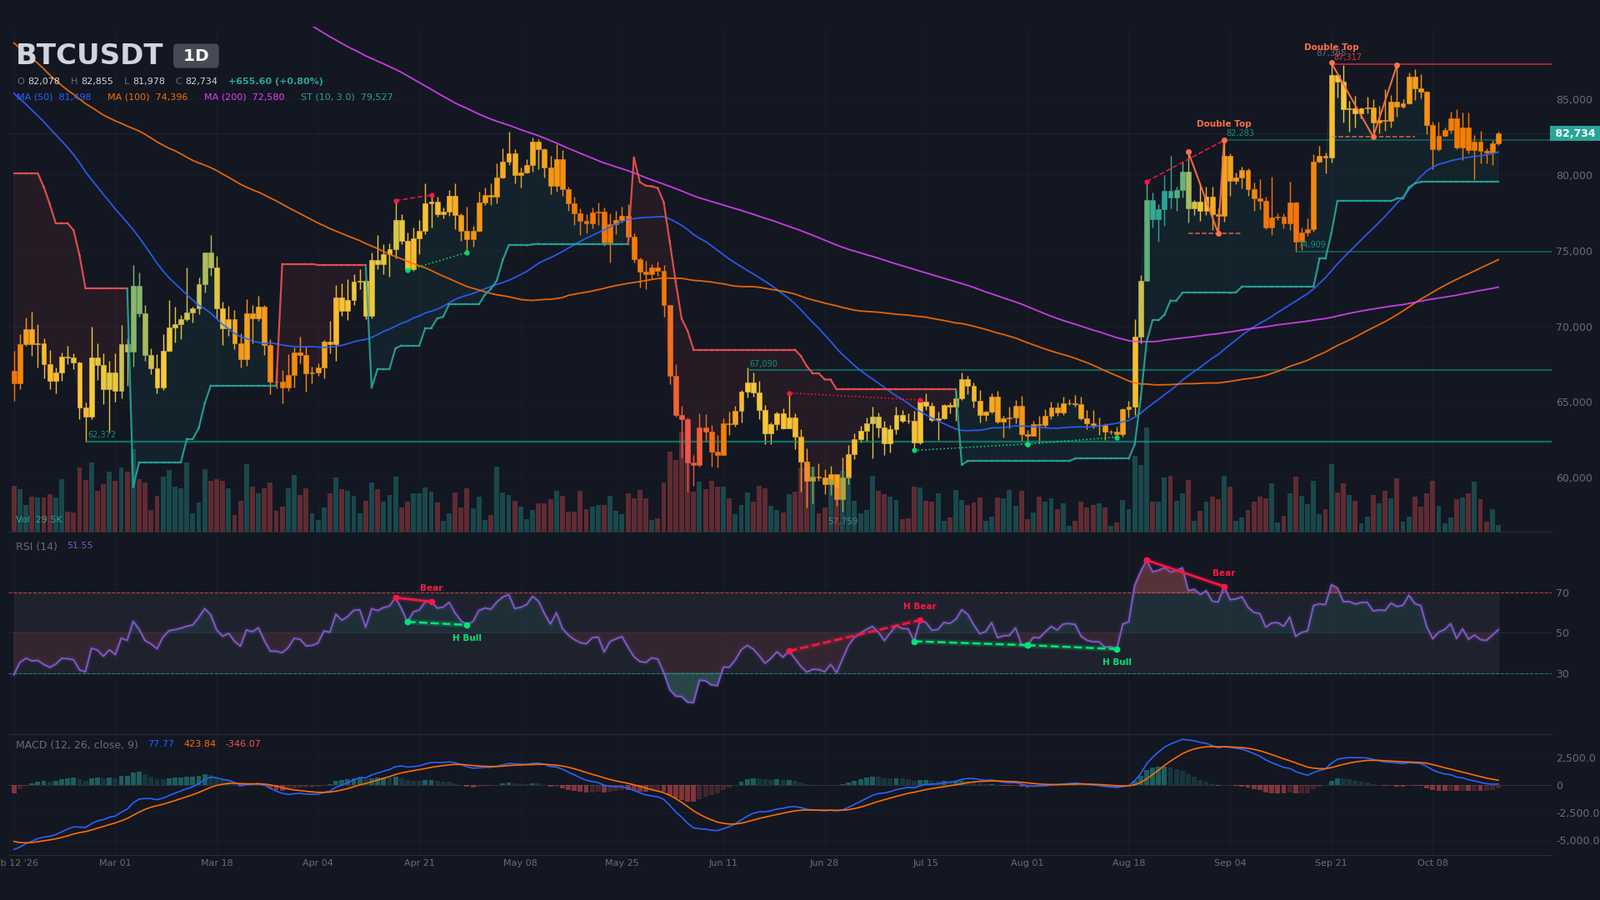
Daily Timeframe (1D): Double Top Below Resistance
On the daily chart, the broader structure remains bullish. Price holds above the 50-day simple moving average (SMA50, about $81,500) and the SMA200 (about $72,600), with the bullish 50/200 crossover dated September 8, 41 candles ago. It has slipped below the SMA20 (about $83,300), a sign that the impulse from $74,910 on September 15 to $87,385 on September 21 has lost steam. The SuperTrend remains bullish, with its level at about $79,530.
The algorithm flags two confirmed bearish double tops. The first, pivoting on October 2, has a neckline at $82,500 and a target near $77,680; price is trading above that neckline, which suggests a partial failure of the pattern that needs confirmation through closes. The second, pivoting on September 3, has a neckline near $76,150 and a target near $70,410. A regular bearish RSI/price divergence between August 21 and September 3, older but still classified as recent, completes the picture.
Momentum indicators are neutral. The RSI (14) sits near 52, and the MACD (moving average convergence divergence) crossed down on September 29: the line remains above zero but below its signal line, with a negative histogram. Volume on the current candle, at 23% of its average, is too partial to draw conclusions. The daily chart is therefore a backdrop, not an entry signal.
Intermediate Dynamics (4H): Descending Triangle Below Resistance
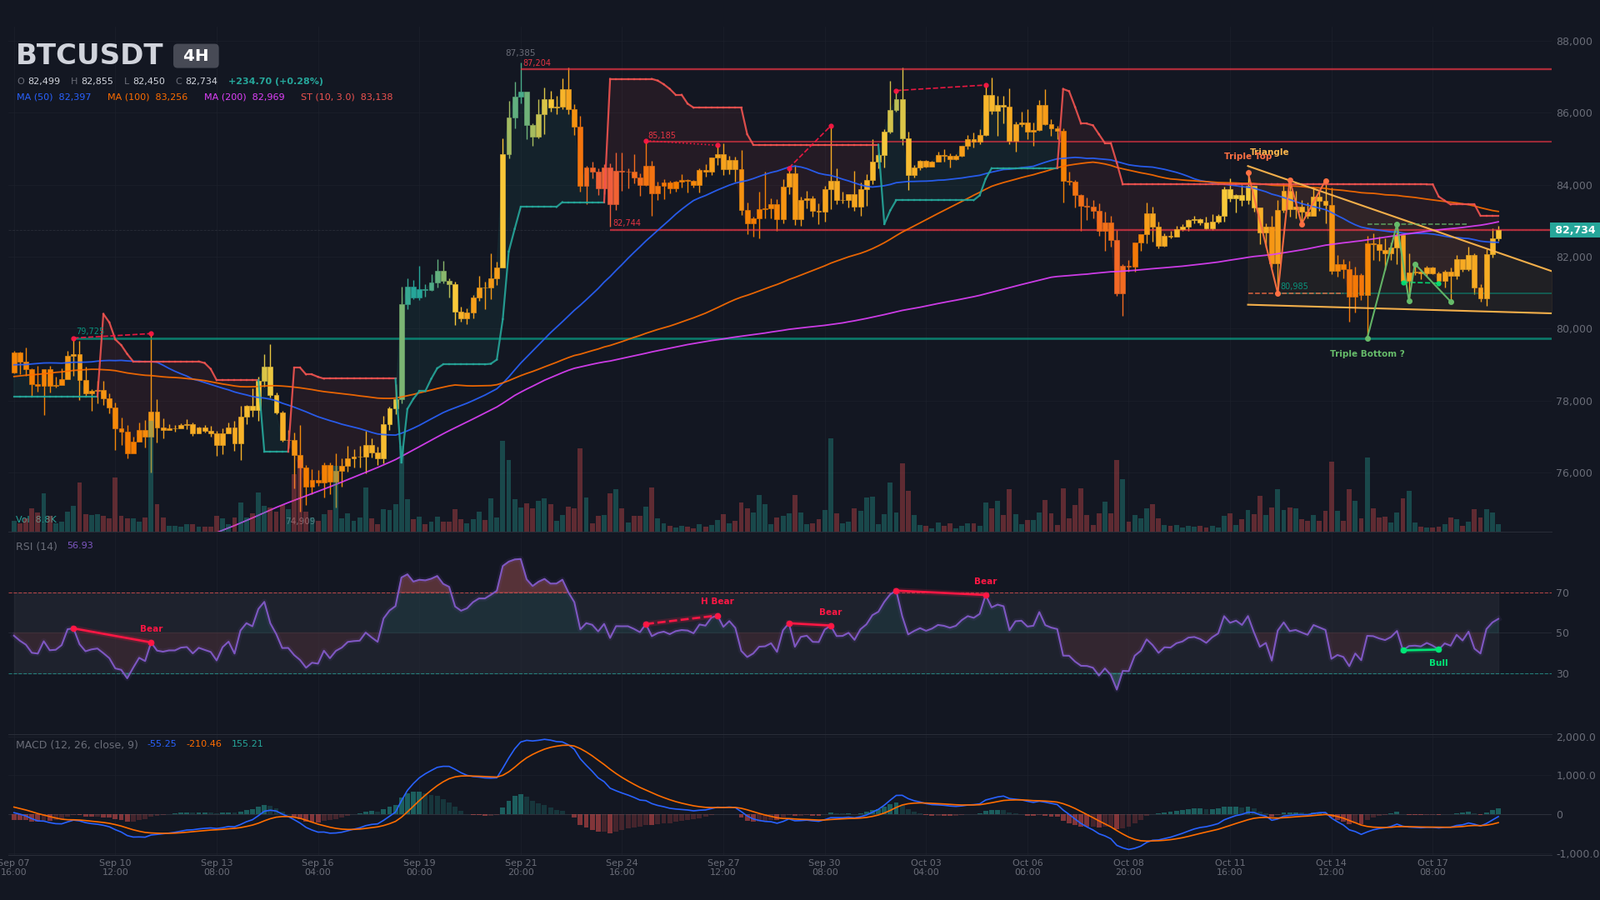
The four-hour chart is where the market is tightening. The descending triangle (descending triangle) detected since October 12 is bounded by a upper line near $82,570 and a lower line near $80,500, with an apex estimated for October 24. It is a bearish continuation pattern by default and remains unconfirmed as long as the lower boundary holds. A confirmed triple top would have a neckline near $80,985 and a target near $77,770, while an unconfirmed triple bottom, still a hypothesis, would have a neckline near $82,900 and a target near $85,380. The four-hour SuperTrend is bearish at about $83,140, and the bearish 50/200 crossover dates from October 16.
At $82,730, price is pressing against resistance at $82,740, tested three times, and sits above the SMA20 and SMA50 (about $81,800 and $82,400) but below the SMA200 (about $82,970). The RSI, near 57, has recovered from 40, and a regular bullish divergence between October 16 and 17 preceded this bounce. The MACD crossed up on October 18, below zero, with an expanding histogram. Volume, at 56% of its average, remains weak, so the rebound still lacks conviction.
Intraday Structure (15m): Wedge Compressing Near Its End
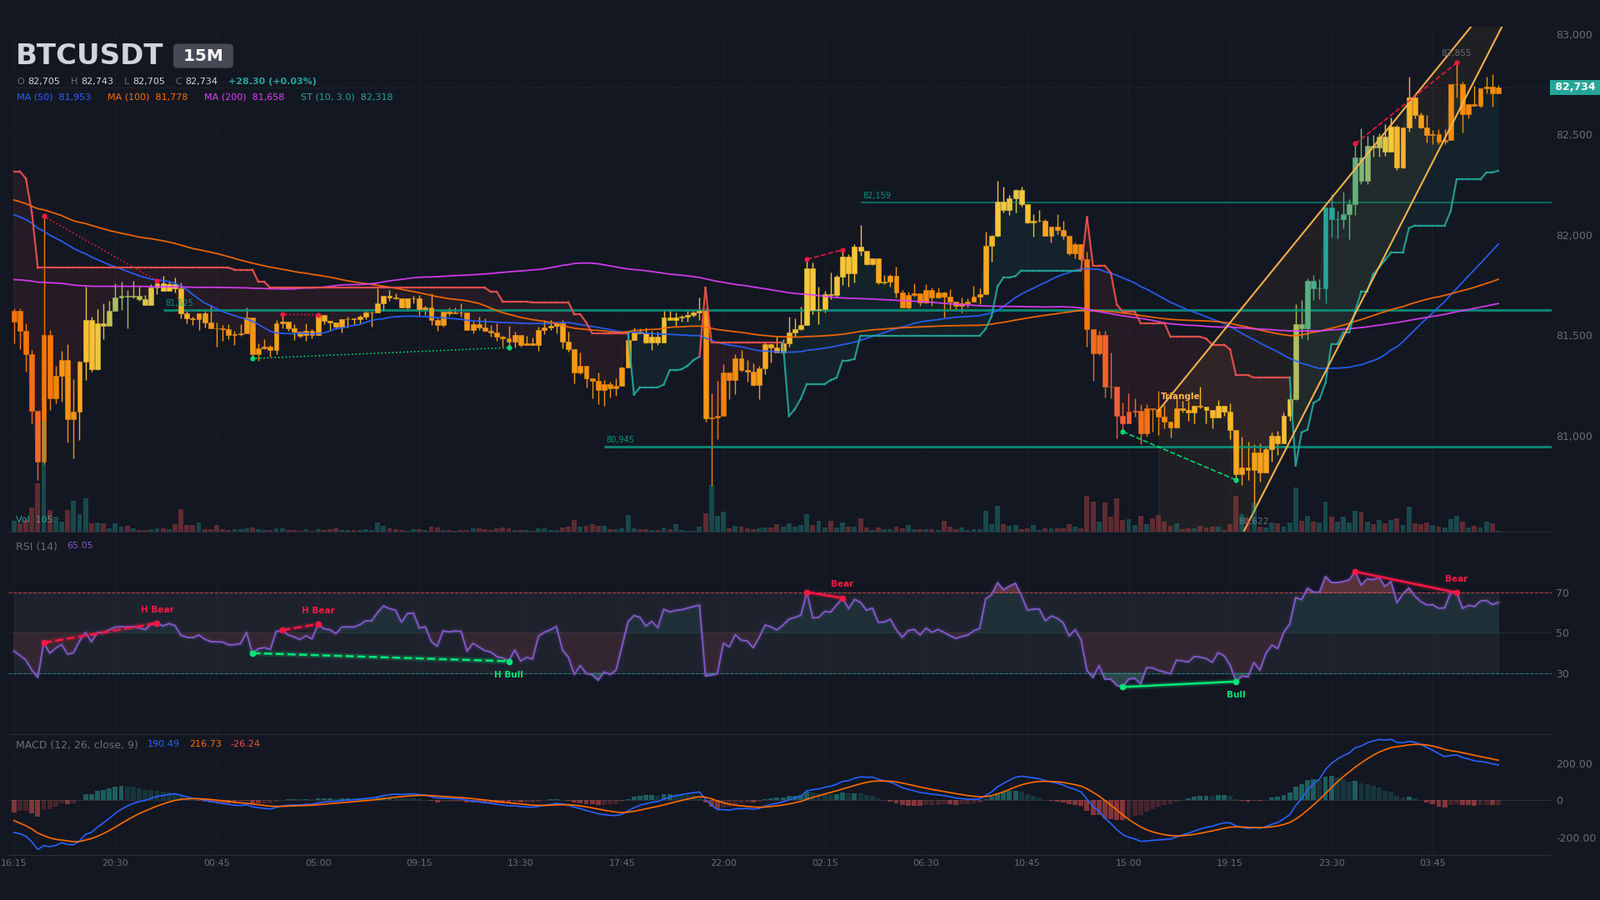
On the 15-minute chart, the wedge (wedge) is bounded by about $82,595 and $82,947, with an apex estimated on the morning of October 19: resolution is imminent. Supports sit at about $82,160 (2 contacts), $81,625 (6 contacts) and $80,945 (5 contacts). The M15 SuperTrend is bullish at about $82,320, and the bullish 50/200 crossover, dated the night of October 18 to 19, supports the short term.
The RSI, near 65, is elevated, and a regular bearish divergence between 00:30 and 04:45 (a higher high at $82,855 while the RSI fell from about 80 to about 70) signals fatigue. The MACD crossed down overnight, above zero, with a negative histogram, and volume at 10% of its average remains partial. A rejection below $82,950 would bring price back toward $82,160 and then $81,625; a 15-minute close above $82,950 would open the way to $83,150.
Multi-Timeframe Synthesis
The table below summarizes the three timeframes: the daily base uptrend, the four-hour compression and the intraday momentum on the 15-minute chart do not yet converge.
| Timeframe | Dominant trend | RSI (14) | MACD | Chart pattern |
|---|---|---|---|---|
| Daily (1D) | Bullish (upper consolidation) | ~52 | Bearish cross on 09/29, above zero | Double top below resistance |
| 4 hours (4H) | Neutral to bearish (compression) | ~57 | Bullish cross on 10/18, below zero | Descending triangle |
| 15 minutes (15M) | Bullish intraday | ~65 | Bearish cross, above zero | Compression wedge |
Level Mapping: Technical Levels and Pivots
The map combines classic daily and four-hour pivots, swing points, detected supports and resistances, pattern targets and estimated liquidation pockets. No Fibonacci extension is retained, because the reference impulse is not clear enough in the swings. The short-term central pivot sits between the daily pivot ($81,656) and the four-hour pivot ($82,422), a zone from $81,650 to $82,420.
| Level | Price (USD) | Category | Technical basis |
|---|---|---|---|
| Major resistance 3 (R3) | $87,200 – $87,400 | Resistance | September 21 high ($87,385), daily resistance (2 contacts) and H4 (3 contacts) |
| Major resistance 2 (R2) | $84,950 – $85,400 | Resistance / liquidity | H4 resistance ($85,185), estimated short pocket $84,950–$85,240, H4 triple bottom target ($85,380) |
| Immediate resistance (R1) | $82,750 – $83,300 | Resistance | H4 resistance (3 contacts), H4 SuperTrend ($83,140), daily pivot R2 |
| Central pivot (P) | $81,650 – $82,420 | Pivot | Daily pivot ($81,656), H4 pivot ($82,422), M15 support ($82,160) |
| Immediate support (S1) | $80,500 – $81,000 | Support | Lower boundary of the H4 triangle, H4 triple top neckline ($80,985), daily pivot S1 |
| Major support 2 (S2) | $79,100 – $79,750 | Support / liquidity | H4 support (4 contacts), October 15 low ($79,732), estimated long pocket $79,098–$79,334, daily SuperTrend |
| Major support 3 (S3) | $77,700 – $78,800 | Support / targets | Estimated long pocket $78,626–$78,815, daily ($77,683) and H4 ($77,773) pattern targets |
Order Book and Liquidity Heatmap
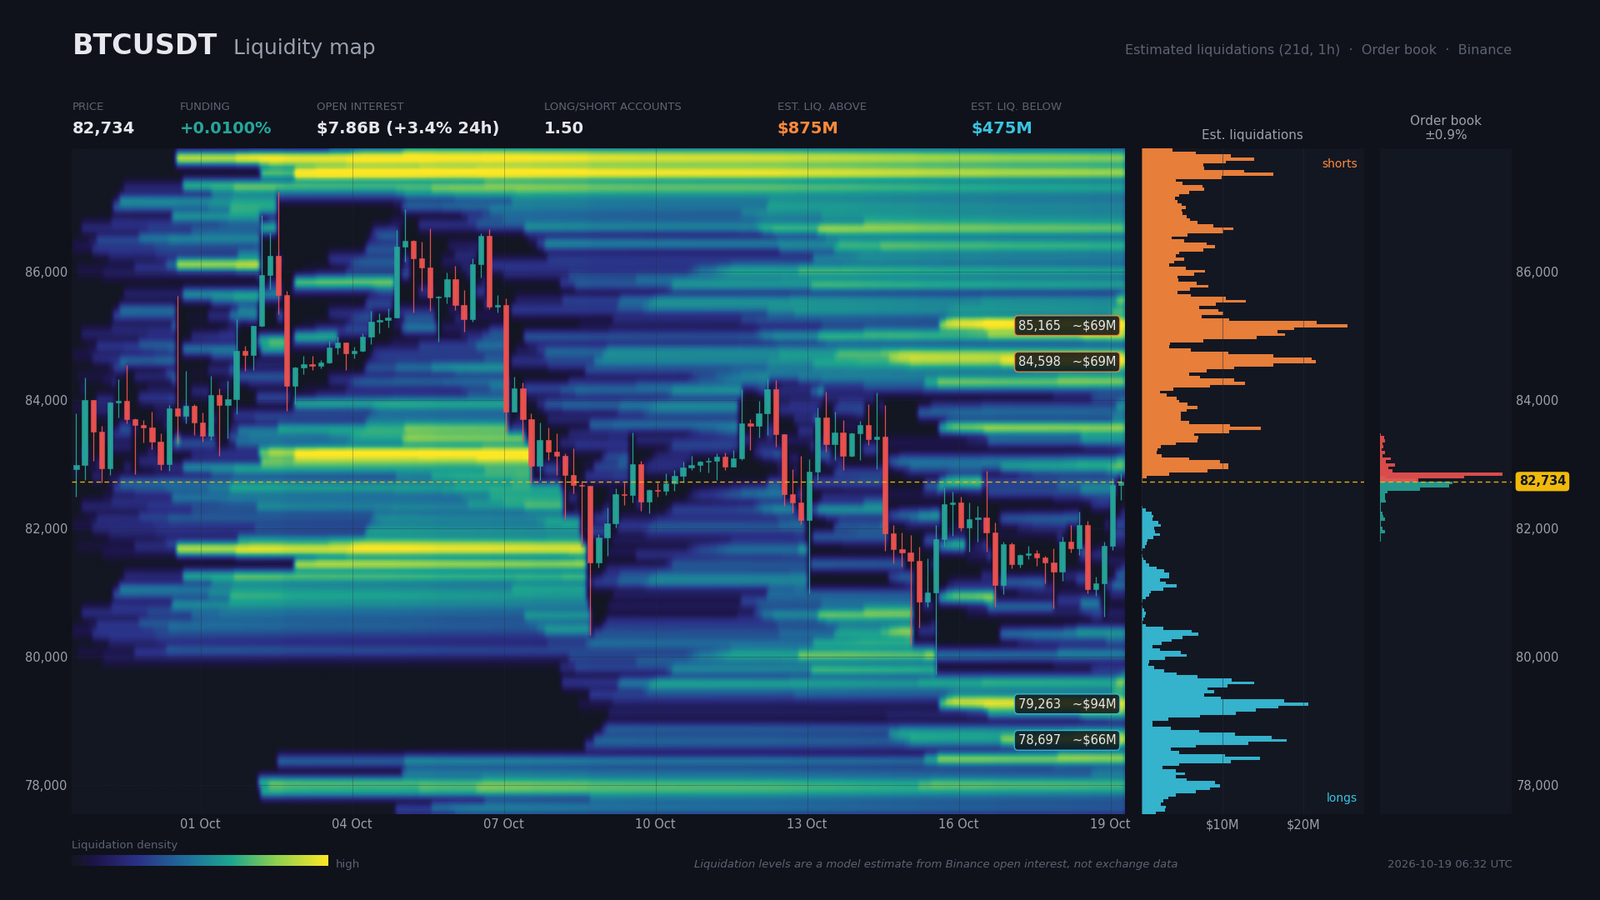
The visible order book covers only 0.88% around the price, which limits the reading. Within that window, asks total $75.4M against $62.7M of bids within ±2%, a 9.2% imbalance in favor of sellers. Sell walls sit at $82,757 ($9.1M), $82,804 ($20.0M) and $82,852 ($29.1M, +0.14%). Buy walls are at $82,710 ($17.2M), $82,663 ($16.4M) and $82,615 ($9.4M). Price is therefore moving in a corridor of less than 0.2% on either side.
Estimated liquidation zones (a model, not measured data) total $875M above the price in shorts, against $475M below in longs. Above, the main pockets are $84,575–$84,717 (about $69M, +2.3%), $84,953–$85,094 (about $59M) and $85,141–$85,236 (about $69M, +2.9%). Below, $79,098–$79,334 (about $94M, 4.2% under the price), $78,626–$78,815 (about $66M) and $79,523–$79,712 (about $46M).
Funding is moderate at 0.01%, or 10.9% annualized. Open interest rose 3.4% over 24 hours but fell 0.3% over seven days. The long/short ratio stands at 1.50 for accounts and 1.78 for top traders, and the taker buy/sell ratio is 1.007. This points to a moderate buying bias, with more shorts to squeeze above than longs to flush below, and a magnet toward $84,600–$85,200 if $83,150 breaks. Conversely, a purge toward $79,100–$79,750 remains possible if $80,500 gives way, and a liquidity sweep (liquidity sweep) is a risk in both directions.
Calendar: Catalysts to Watch
The calendar is dense over the next ten days, but few releases have a direct impact on Bitcoin. No Deribit options expiry or CME settlement appears in the agenda available. Recent releases, which shaped the $79,730 low, remind us how sensitive the asset is to US macro data.
- Tuesday, October 20, 14:30 (Zurich) — US building permits (consensus 1.4, prior 1.403) and housing starts (consensus 1.3, prior -2.6): moderate impact expected on risk appetite.
- Wednesday, October 21, 08:00 (Zurich) — UK annual CPI (3.4% expected, prior 3.1%; core 2.7% against 2.6%): a surprise would reinforce the global tightening thesis and could push price out of the H4 triangle.
- Wednesday, October 21, evening — Meta and Tesla earnings (according to CNBC and CryptoPotato): a test of tech risk appetite.
- Thursday, October 22, 14:30 (Zurich) — US initial jobless claims (200 expected, prior 199): a secondary release, but useful to read the employment trend.
- Friday, October 23, 01:30 (Zurich) — Japan annual inflation (2.1% expected, against 1.9%): the path of the Bank of Japan is at stake; the same day brings UK retail sales and flash PMIs.
- Tuesday, October 27 — US durable goods orders and the Conference Board consumer confidence index.
Three Scenarios for the Coming Weeks
The probabilities below reflect the weak confluence (2/5) and the neutral bias of this analysis. No scenario clearly dominates, and the H4 triangle must resolve before its October 24 apex.
Scenario A — Rejection Below Resistance, Drift Within the Triangle (probability 45%)
Trigger: a rejection between $82,750 and $83,150, on the $82,850 sell wall and the H4 resistance tested three times. No single catalyst is dated, but the UK CPI release on October 21 could act as an accelerator. The path runs through $81,600, then $80,500–$81,000, the lower boundary of the triangle. Execution zone: sell between $82,800 and $83,000. Stop at $83,700, at least 1 ATR (average true range) on H4, about $780. Target at $81,000, a R:R of about 2.4. Invalidation: H4 close above $83,700.
Scenario B — Bullish Squeeze Toward the Short Pockets (probability 30%)
Trigger: an H4 close above $83,150, the H4 SuperTrend level, possibly supported by Meta and Tesla results on October 21. The path targets $84,600, the first estimated short pocket, then $85,170–$85,380, which combines the short pocket with the triple bottom target. Execution zone: buy on retest between $83,200 and $83,400. Stop at $82,400, below the H4 SMA50, at least 1 ATR away. Target at $85,200, a R:R of about 2. Invalidation: H4 close below $82,400.
Scenario C — Bearish Breakdown of the Triangle (probability 25%)
Trigger: an H4 close below $80,500 before the October 24 apex, for example on a Japanese inflation surprise on October 23. The path passes $79,725, an H4 support tested four times, then $79,100–$79,330, an estimated long pocket, then $77,700–$77,800, the H4 and daily pattern targets. Execution zone: sell on retest between $80,400 and $80,500. Stop at $81,300. Invalidation: H4 close above $81,300.
Summary and Conclusion
The phase is a consolidation below the $87,385 high. The daily chart keeps a bullish structure, above its SMA50 and SMA200, but momentum is held back by ETF outflows (about $910M over two weeks) and persistent inflation. Whale accumulation and risk appetite after China’s GDP release have not yet translated into price: flows argue against a rebound, without invalidating the underlying structure.
The dominant technical strategy is tactical: sell the rejection below $83,100, or wait for a confirmed breakout of the H4 triangle rather than anticipate it. Protection sits on an H4 close above $83,700 for sellers, and below $82,400 for buyers. A medium-term directional bias would require a daily close outside the $79,700–$87,400 zone. The levels to watch remain $83,150, $82,160–$82,420, $80,500–$80,985, $79,100–$79,750 and $87,400.
Sources
- Bitcoin Volatility Ahead? These 5 Events Could Move Crypto This Week — CryptoPotato, October 19, 2026
- The Altcoin Run Is Giving Back Ground Fast as Bitcoin Dominance Climbs — BeInCrypto, October 19, 2026
- Bitcoin : la croissance chinoise à 4,5 % sauve le lundi noir — Journal du Coin, October 19, 2026
- Bitcoin and Crypto: Morgan Stanley Sets the Dose at 4% in Its Most Aggressive Portfolios — Journal du Coin, October 19, 2026
- Bitcoin ETFs Shed Nearly $1 Billion in Two Weeks as Uptober Stays Red — Decrypt, October 18, 2026
- Japanese Prime Minister Takaichi rejects criticism around weak yen and high interest rates — CNBC, October 19, 2026
- Here are the 3 big things we’re watching in the stock market this week — CNBC, October 18, 2026
- MSCI To Move Forward With Proposal That Could Exclude Strategy From Index — Bitcoin Magazine, October 16, 2026
- Bitcoin Extends Slide — Can ‘Uptober’ 2026 Beat Last Year’s? — Bitcoin Magazine, October 13, 2026 (date not confirmed)
- Live updates: Bitcoin under pressure as rates continue to rise — CoinDesk, October 5, 2026
- Bitcoin ETF Flow (US$m) — Farside Investors, date not specified
- Will the Crypto Market Repeat 10-10? Here’s What the Data Says — Yahoo! Finance, October 7, 2026
- Whales Bought 86,702 Bitcoin in Three Weeks and 24,073 Left Exchanges in a Day — 24/7 Wall St, October 8, 2026
- SEC custody rule amendments (To the Point) — EY, October 15, 2026 (date not confirmed)
Disclaimer: This article is for educational and informational purposes only. It does not constitute investment advice, a recommendation to buy or sell, or an invitation to trade any financial asset. Cryptocurrency markets are extremely volatile; any investment decision should be based on your own research (DYOR) and, where appropriate, the advice of a licensed financial adviser.

