


Bitcoin is trading at $81,715 on Sunday, October 18, 2026, 6.5% below the September 21 high of $87,385 and roughly 9% above the September 15 low of $74,909. After the mid-September impulse, the market has entered a consolidation phase, compressing between $80,450 and $82,970 inside a four-hour descending triangle (descending triangle) whose apex is estimated around October 24.
Institutional flows are the first driver. According to Coincall (October 14), spot bitcoin and ether ETFs recorded $1.15B of net outflows between October 7 and 12, including $773.3M for bitcoin alone, with October 7 accounting for $484.9M by itself. This follows the strongest inflow week of the year ($2.4B from September 21 to 25, per Yahoo Finance, October 8), and price capped at $87,385 on September 21. On the options side, 64% of Coincall’s taker flow went into puts between October 5 and 11, with the October 30 expiry carrying about $190M of volume: protection demand more than bullish conviction.
Macro dominates. US inflation for September came in hotter than expected: the consumer price index (CPI) stood at 3.7% year over year, and core inflation at 2.6% against a 2.5% consensus (CNBC, October 17). On October 15, core producer prices rose 0.7% month over month versus 0.3% expected, while retail sales jumped 0.8% (consensus 0.3%). The Nasdaq shed 4.5% over the week, its worst performance since June. The Fed raised rates by 25 basis points in September, to a range of 3.75% to 4.00% (Coincall, October 14), and markets price only about a 22% chance of another hike at the October 28 decision. Ten-year and 30-year Treasury yields reached their highest levels since 2002 (CNBC, October 18), and Sarah Breeden of the Bank of England warned about hedge fund leverage in bond markets. Remarks by Lagarde, Bailey and Warsh are not documented in the sources retained.
The technical reading must therefore stay cautious: the inflation shock neutralizes the signal, with a slight bearish lean. One element remains constructive, since the daily Supertrend is still bullish.
Multi-Timeframe Technical Analysis
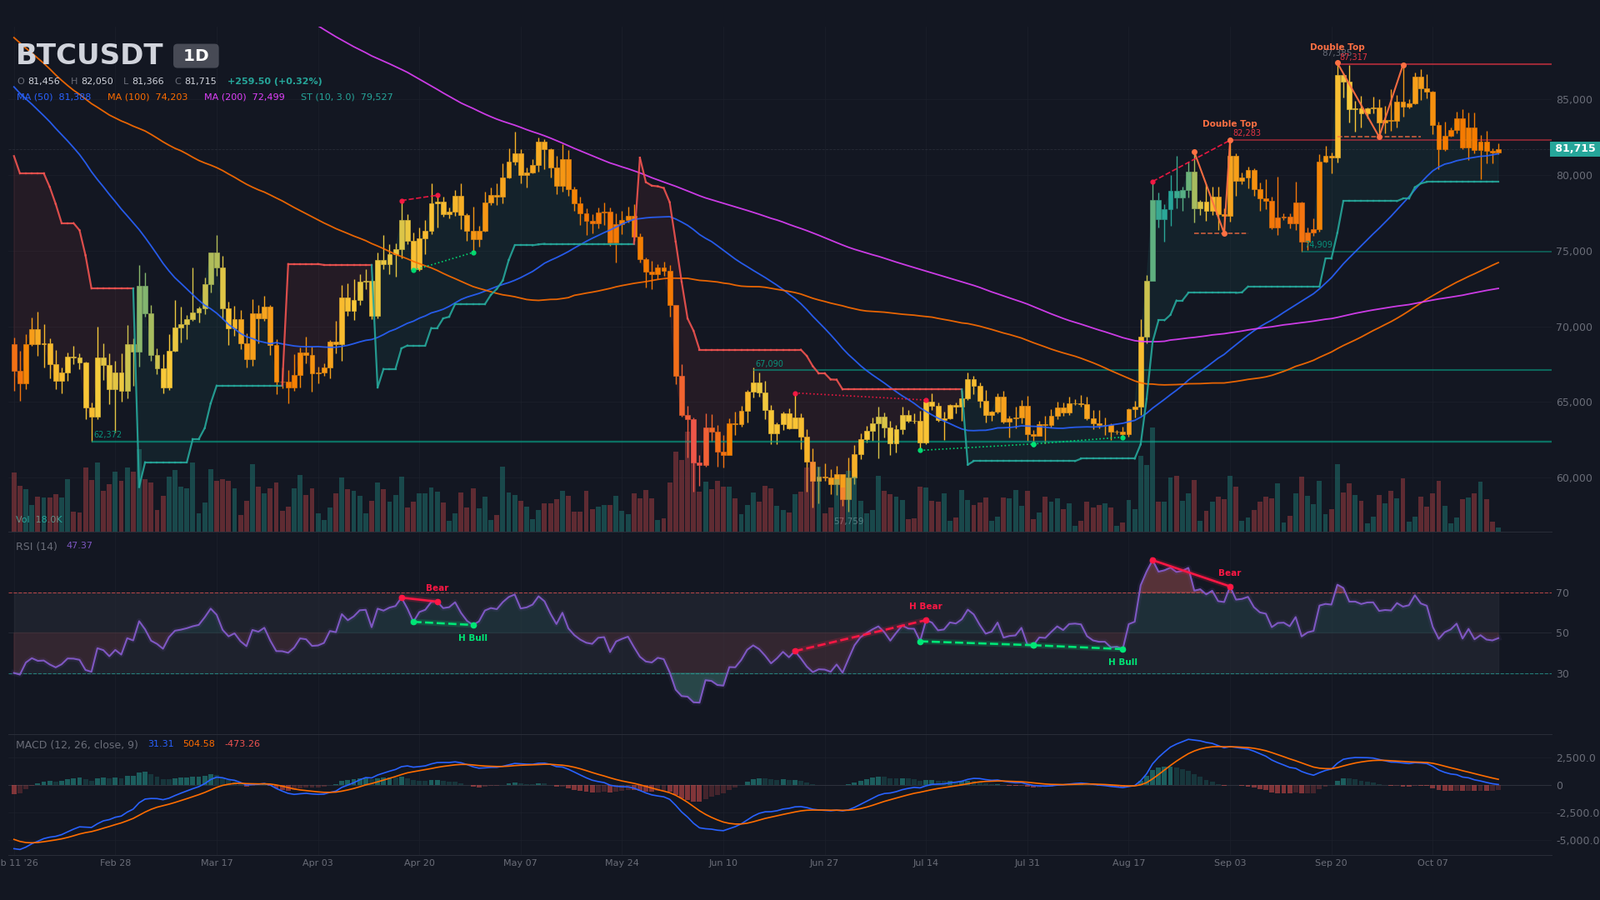
Daily Timeframe (1D): Confirmed Double Top Under a Falling SMA20
On the daily chart, the trend is neutral with a bearish tilt: peaks have been lowering since $87,385 (September 21), with $87,250 (October 2), $86,980 (October 5) and then $84,340 (October 12). Troughs rose first, then faded: $82,500 (September 28), $80,345 (October 8), $79,732 (October 15). The pattern detector flags a confirmed bearish double top (pivot of October 2): neckline at $82,500, target $77,680. A second double top, with a neckline at $76,150 (target $70,410), has been far exceeded by price and is treated as void.
Price sits below the SMA20 ($83,330) but above the SMA50 ($81,390, nearly flat) and the SMA200 ($72,500). The bullish 50/200 crossover dates from September 8, 40 candles ago. The RSI (relative strength index) is at ~47, neutral, with no recent divergence; the regular bearish divergence from August 21 to September 3 (RSI from ~86 to ~73) is older. The MACD (moving average convergence divergence) has been below its signal line since the bearish crossover of September 29; its line hovers near zero and the histogram stays negative. Volume on the current candle is only 14% of its 20-day average, too partial to conclude. The 14-period ATR (average true range) stands at $2,076, or 2.5% of price.
Intermediate Dynamics (4H): Descending Triangle Under a Double Top
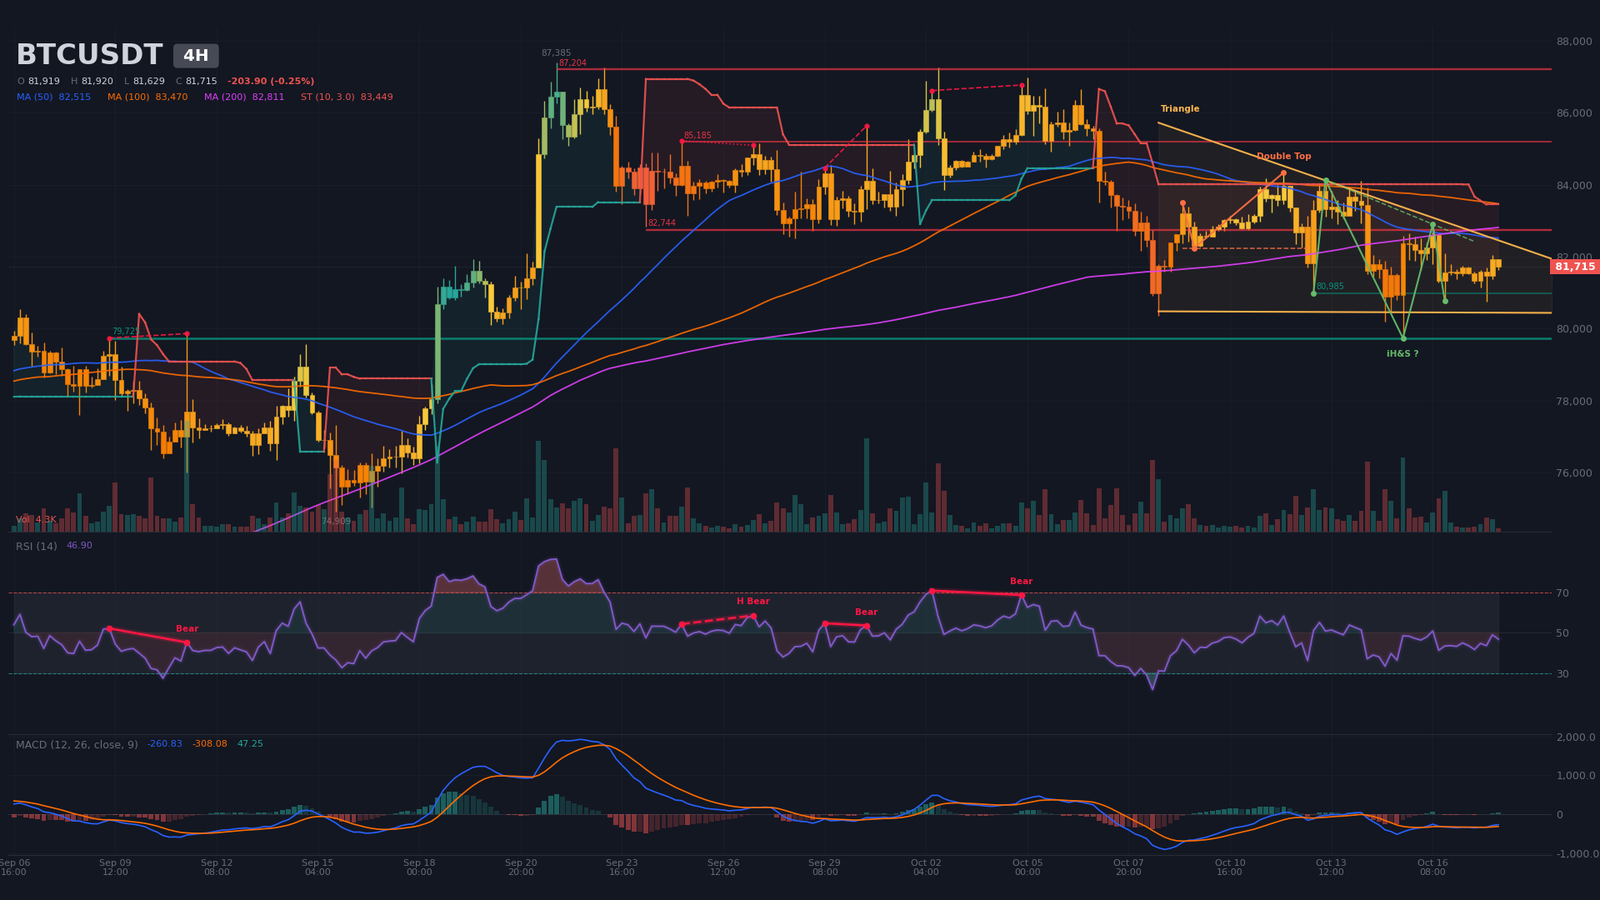
The four-hour chart tells a different story, one of compression. The descending triangle has been forming since October 8, with an upper boundary at $82,970, a lower boundary at $80,450 and an estimated apex around October 24. A confirmed bearish double top (neckline $82,240, target $80,560) overlaps it. On the other side, an inverse head and shoulders (inverse head and shoulders) remains unconfirmed: it is a hypothesis, with a neckline at $82,900 and a target at $86,270. The H4 Supertrend is bearish at $83,450, price hugs the SMA20 ($81,720) and stays below the SMA50 ($82,510) and SMA200 ($82,810), with a bearish 50/200 crossover dated October 16 at 16:00.
The RSI is at ~47. The MACD histogram has turned positive on the bullish crossover of October 17 at 20:00, but the line remains below zero: this is a technical rebound rather than a reversal. Volume stays weak at 20% of its average. The most constructive point is the October 15 low ($79,730), which produced a rejection wick on above-average volume and validates support at $79,725 (4 touches). The H4 ATR stands at $747.
Intraday Structure (15m): Compression Under a 10-Touch Resistance
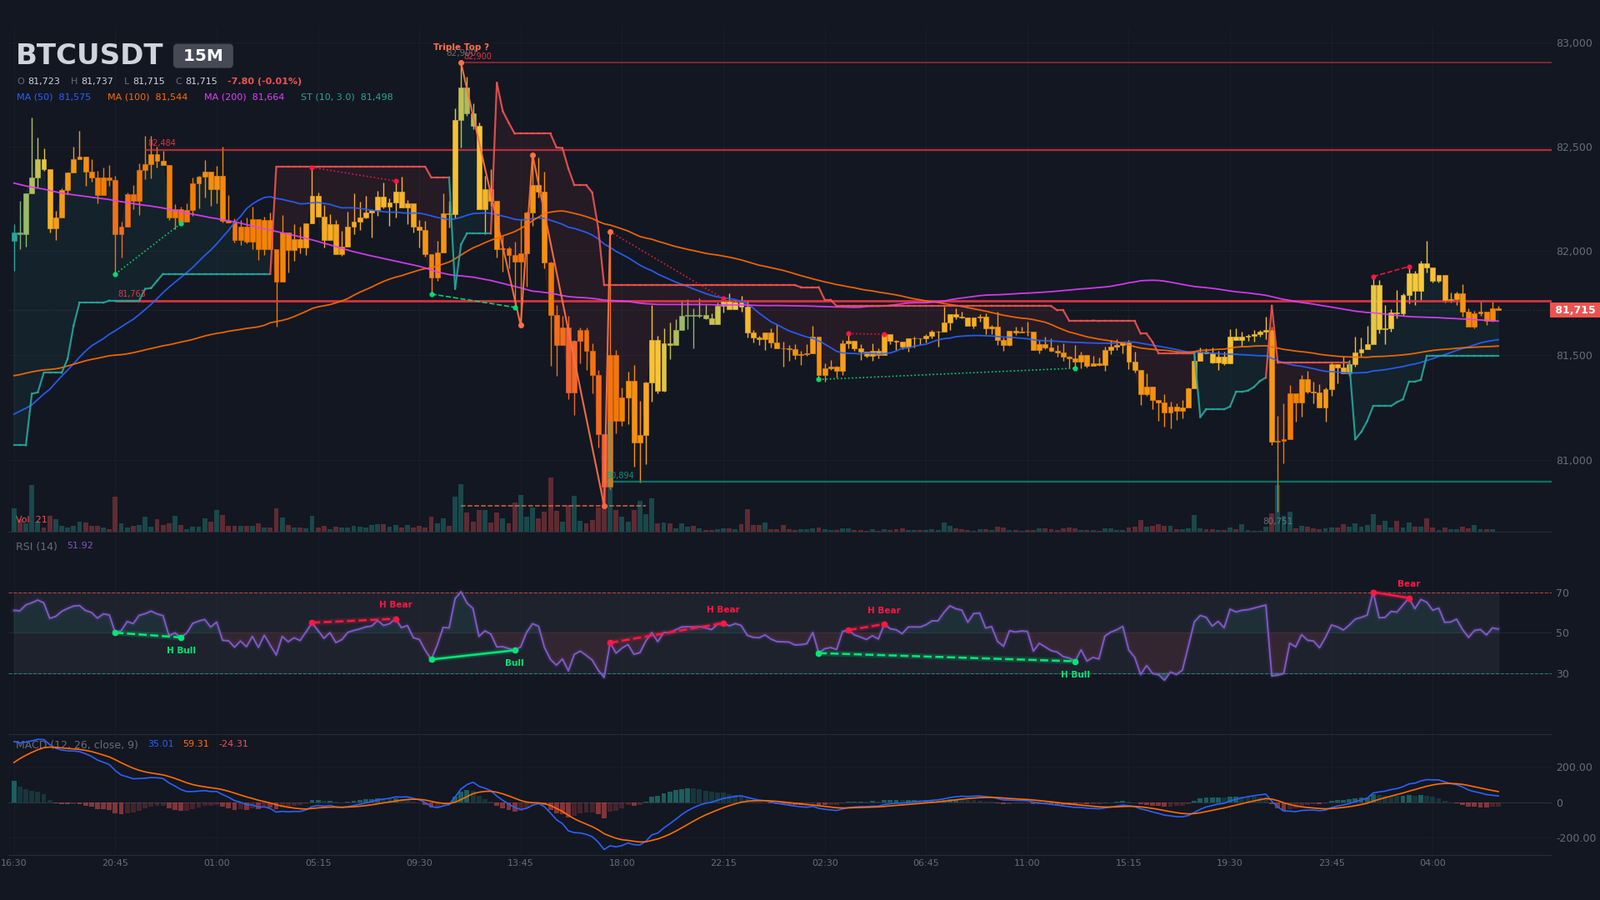
On the 15-minute chart, price trades in a tight range between $81,150 and $82,050, pressed against resistance at $81,760 (10 touches). Above sit $82,480 (3 touches) and then $82,900; below, $80,890 (3 touches). The 50, 100 and 200 moving averages are tangled between $81,540 and $81,660, a sign of a market without direction. A regular bearish divergence appears from October 18 at 01:30 to 03:00 (RSI from ~70 to ~67), and the MACD fell back below its signal line at 04:45 on October 18, while still above zero. The RSI is at ~52 and the M15 Supertrend remains bullish at $81,500. A triple top is detected but unconfirmed (neckline $80,780, target $79,080). The triggers are clear: a M15 close above $82,050 would be bullish, a close below $81,500 and then $80,780 bearish. The M15 ATR of $108 underlines how limited the intraday range remains.
Multi-Timeframe Synthesis
| Timeframe | Dominant trend | RSI (14) | MACD | Chart pattern |
|---|---|---|---|---|
| Daily (1D) | Neutral (consolidation under highs) | ~47 | Bearish crossover on 09/29, negative histogram | Confirmed double top (target $77,680) |
| 4 hours (4H) | Bearish (compression) | ~47 | Bullish crossover on 10/17, below zero | Descending triangle |
| 15 minutes (15m) | Neutral (range) | ~52 | Bearish crossover on 10/18, above zero | Compression under resistance |
Price Map: Levels and Pivots
The method cross-checks classic daily and H4 pivots, detected supports and resistances, dated swings and estimated liquidation pockets. The reference impulse, from $74,909 on September 15 to $87,385 on September 21, places price near its midpoint, an analyst reading. The central short-term pivot lies between $81,300 and $81,780.
| Level | Price (USD) | Category | Technical basis |
|---|---|---|---|
| Major resistance 3 (R3) | $87,200 – $87,400 | Resistance | September 21 high ($87,385), daily resistance $87,317 (2 touches), H4 $87,204 |
| Major resistance 2 (R2) | $84,500 – $85,250 | Resistance / liquidity | Estimated short liquidation pockets $84,492–$84,782 and $85,129–$85,245, H4 resistance $85,185 |
| Immediate resistance (R1) | $82,250 – $82,970 | Resistance | H4 neckline $82,240, daily resistance $82,283, H4 $82,744 (3 touches), triangle upper bound $82,970 |
| Central pivot (P) | $81,300 – $81,780 | Pivot | Daily pivot $81,313, H4 pivot $81,778, daily SMA50 $81,388, M15 resistance $81,763 |
| Immediate support (S1) | $80,450 – $80,990 | Support | H4 support $80,985, triangle lower bound $80,448, M15 support $80,894 |
| Major support 2 (S2) | $79,230 – $79,730 | Support / liquidity | H4 support $79,725 (4 touches), October 15 low ($79,732), daily Supertrend $79,527, estimated long pocket $79,227–$79,343 |
| Major support 3 (S3) | $77,680 – $78,400 | Support / target | Daily double top target $77,683, estimated long pockets $78,359–$78,817 |
Order Book and Liquidity Heatmap
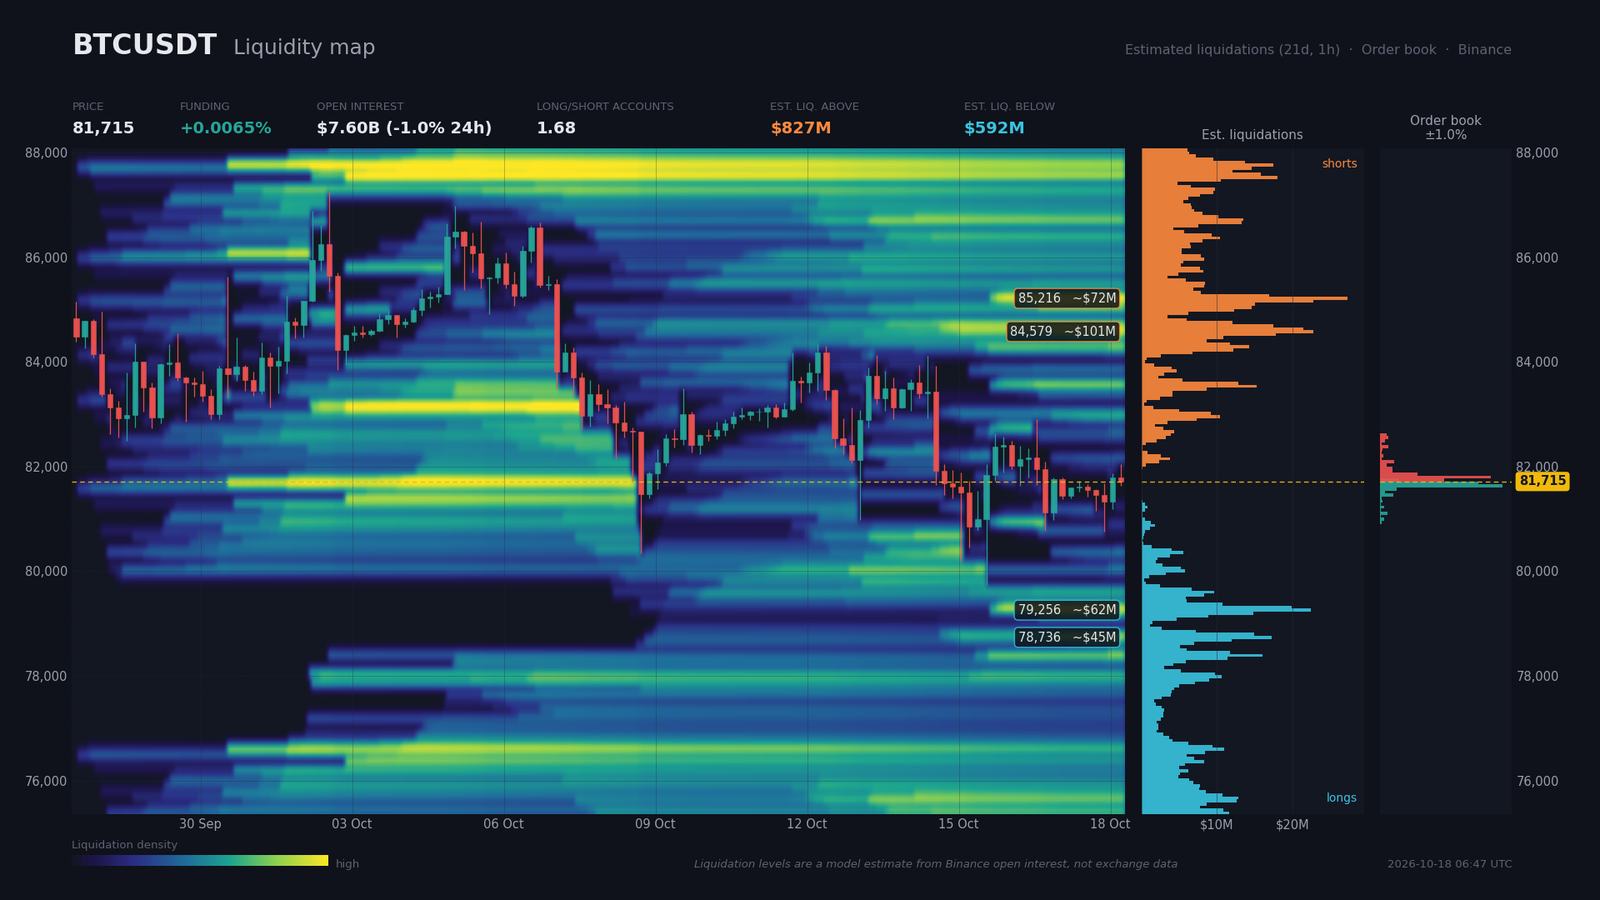
The order book is only visible up to about 1% from price (0.99% coverage), and it is balanced: $55.1M of bids against $54.9M of asks at 2%, an imbalance of just 0.2%. On the sell side, walls sit at $81,744 ($12.0M), $81,802 ($20.7M), $81,860 ($7.0M) and $82,091 ($2.5M). On the buy side, there are $81,686 ($18.5M), $81,629 ($22.9M), then $81,571 ($3.0M) and $81,455 ($2.5M). Price is therefore squeezed between two walls of roughly $20M each, consistent with the M15 range.
The liquidation zones are estimated by a model based on open interest, not measured. They are asymmetric. Above price, shorts total an estimated $827M, with pockets at $83,510–$83,625 (about $43M), $84,490–$84,780 (about $101M) and $85,130–$85,245 (about $72M). Below, longs are estimated at $592M, spread across $79,230–$79,340 (about $62M), $78,710–$78,820 (about $45M) and $78,360–$78,420 (about $30M). Funding is low at 0.0065% (7.2% annualized), open interest of $7.6B is stable, the long/short ratio stands at 1.68 across accounts and 1.78 among top traders, and the taker flow is at 1.035.
There is no excessive leverage, but positions remain mostly long. This imbalance exposes longs to a liquidity sweep (liquidity sweep) toward $79,300, while a short squeeze toward $84,500 remains possible. The larger bullish pocket acts as a magnet should $82,970 break.
Calendar: Catalysts to Watch
With no major macro release before October 21, the apex of the H4 triangle (October 24) is the key date, possibly accelerated by the UK CPI, which could push price out of its structure. The Fed decision of October 28 comes next.
- Monday, October 19, 04:00 (Zurich) — China GDP year over year (consensus 4.4%, prior 4.3%), industrial output (5.4% vs. 5.2%) and retail sales (0.5% vs. 0.4%): stake, appetite for risk.
- Tuesday, October 20, 14:30 (Zurich) — US building permits (consensus 1.4, prior -2.1) and housing starts (1.3 vs. -2.6): stake, rate sensitivity.
- Wednesday, October 21, 08:00 (Zurich) — UK CPI year over year (consensus 3.4%, prior 3.1%) and core (2.7% vs. 2.6%): stake, pressure on gilts and a possible accelerator for the H4 triangle.
- Friday, October 23, 10:30 (Zurich) — UK flash manufacturing PMI (consensus 51.8, prior 52.1), after the morning retail sales release: stake, the UK economic trajectory.
- Wednesday, October 28 — Fed rate decision (date not specified by Investing.com, Coincall points to October 27 and 28): stake, the hike probability, currently estimated at about 22%.
Three Scenarios for the Coming Weeks
The probabilities below reflect a low conviction (confluence score of 3/5) and a neutral stance with a bearish tilt. They cover the coming weeks, in connection with the H4 triangle apex and the Fed decision.
Scenario A — Rejection Below Resistance and Slide Toward $79,700 (probability 45%)
This most likely scenario rests on a failure below the $82,240–$82,750 zone, followed by an H4 close below $80,450. The UK CPI release on October 21 could act as an accelerator. The path leads first to $80,560 (H4 double top target), then to $79,730, and finally to the estimated long pocket at $79,230–$79,340. With an entry at $82,500, the $80,560 target gives a R:R of about 2 and the $79,730 target about 2.9. Execution zone: sell on a retest of $82,240–$82,750. Invalidation: H4 close above $83,450, more than one H4 ATR ($747) above the entry.
Scenario B — Bullish Short Squeeze (probability 30%)
The trigger is an H4 close above $82,970, which would validate the inverse head and shoulders, still an unconfirmed hypothesis. The path targets $83,510–$83,625, then $84,490–$84,780, where estimated short liquidations cluster, with a theoretical target at $86,270; the probable ceiling remains the H4 resistance at $85,180. Execution zone: retest of $82,700–$82,970 after the breakout. Invalidation: H4 close below $81,000, which is one H4 ATR below the entry zone.
Scenario C — Clean Break of the Daily Supertrend (probability 25%)
The trigger is a daily close below $79,500 (Supertrend at $79,527), which could come from a bond shock or sustained ETF outflows. The path would lead to $77,680 (daily double top target), then to the September 15 low at $74,910. Execution zone: retest of $79,500–$79,730 from below. Invalidation: daily close above $82,500 (neckline), a stop distance greater than one daily ATR ($2,076).
Synthesis and Conclusion
The market is consolidating after its impulse, with lower highs and a descending triangle nearing maturity. Net ETF outflows of $1.15B, rising yields and protective options buying weigh on a bullish scenario. Whale accumulation, flagged by Santiment (86,702 BTC over three weeks), and near-neutral funding, however, rule out a capitulation scenario. Nothing yet confirms a bullish reversal.
The dominant technical strategy remains patient: sell rallies toward $82,250–$82,750 as long as the H4 close stays below $83,450, and turn bullish only after a close above $82,970. The main protection level is $83,450 (H4 Supertrend). Given the low conviction, position size should be reduced before October 24. The critical levels to watch are $82,970, $82,240–$82,500, $80,450–$80,990, $79,530–$79,730 and $77,680.
Sources
- Crypto Firms Launch Quantum Alliance as 6 Million Bitcoin Sit Exposed — Decrypt, 10/17/2026
- Bitcoin Treasury Giant Strategy Faces Index Removal Under Finalized MSCI Rules — Decrypt, 10/16/2026
- Hot Inflation Data Puts Bitcoin Under Pressure, but ‘Difficult’ Isn’t ‘Bearish’: CoinShares — Bitcoin Magazine, 10/16/2026
- AI stocks plunge. Inflation heats up. Where we’re still finding opportunities — CNBC, 10/17/2026
- Why hedge funds could be making a bond market shock more likely — CNBC, 10/18/2026
- October 14, 2026 – Bitcoin Holds Near $84K as Crypto ETF Outflows Top $1.1B — Coincall, 10/14/2026
- Bitcoin ETFs Faced Outflows on Nearly Half of All Trading Days This Year — Yahoo! Finance, 10/08/2026
- Whales Bought 86,702 Bitcoin in Three Weeks — 24/7 Wall St, 10/08/2026
- SEC Proposes Custody Rule Updates — Faegre Drinker, 10/07/2026
- Poetic Justice: Scammer Lost $5M in Bitcoin After Being Targeted by Ledger Thieves — Bitcoin Magazine, 10/17/2026
- United States Federal Reserve Interest Rate Decision — Investing.com, date not specified
Disclaimer: This article is for educational and informational purposes only. It does not constitute investment advice, a recommendation to buy or sell, or an invitation to trade any financial asset. Cryptocurrency markets are extremely volatile; any investment decision should be based on your own research (DYOR) and, where appropriate, the advice of a licensed financial adviser.

